. 2018 Sep 6;19(9):2643.
doi: 10.3390/ijms19092643.

Myosin Head Configurations in Resting and Contracting Murine Skeletal Muscle

Affiliations

Myosin Head Configurations in Resting and Contracting Murine Skeletal Muscle

Weikang Ma et al. Int J Mol Sci. .

Abstract

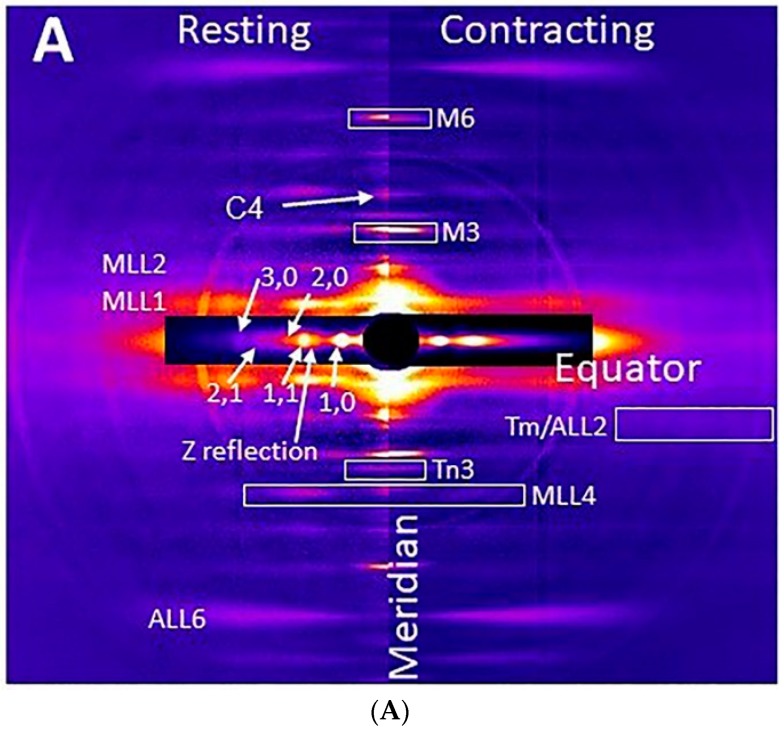
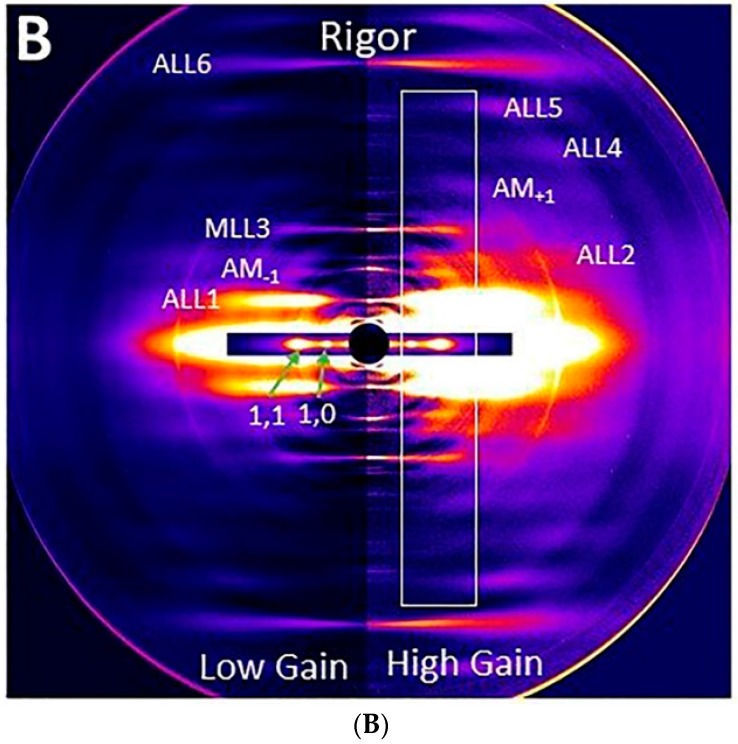
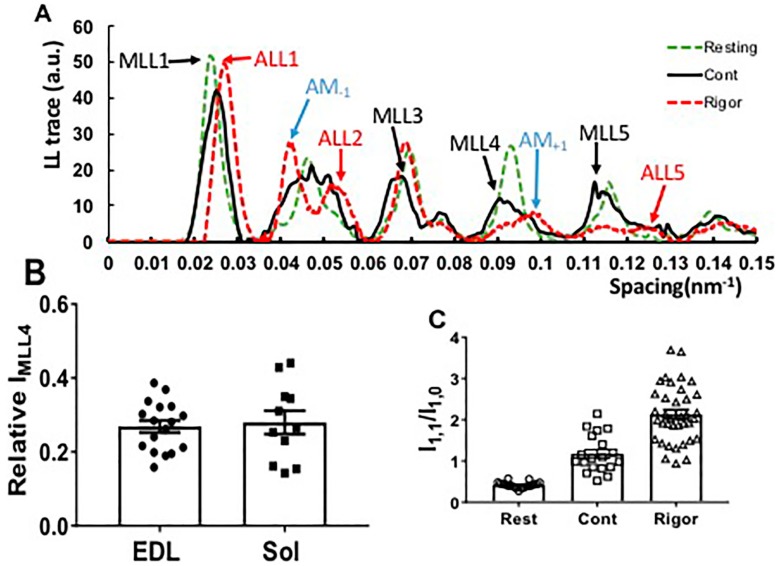
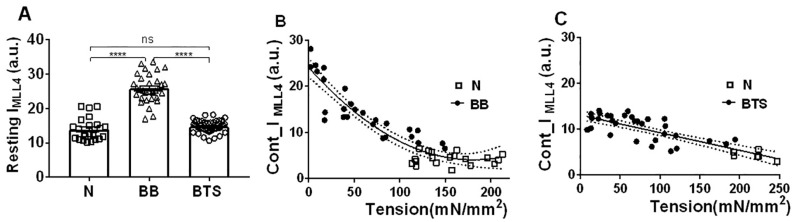
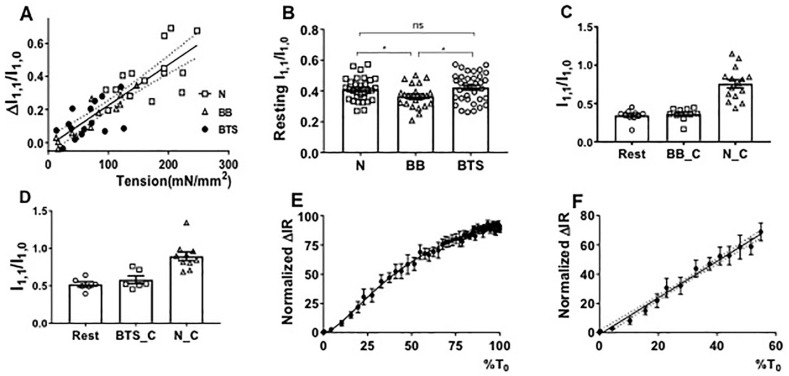
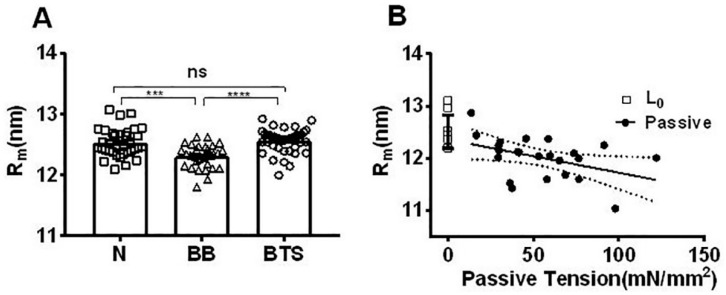
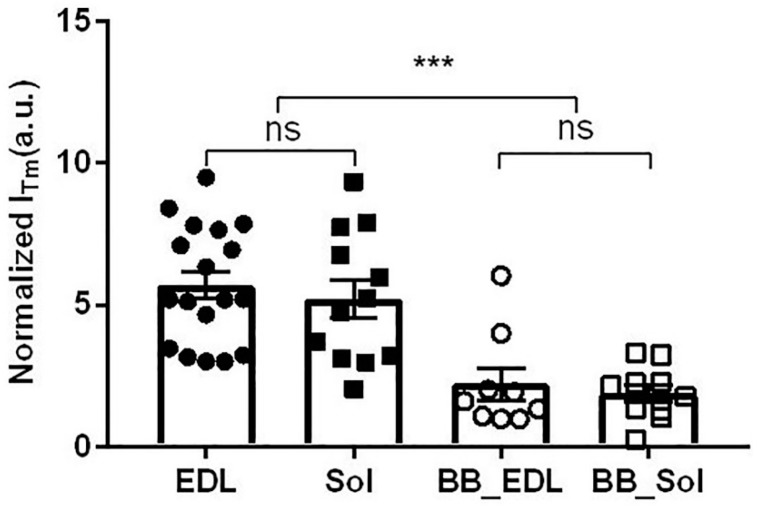
Transgenic mouse models have been important tools for studying the relationship of genotype to phenotype for human diseases, including those of skeletal muscle. We show that mouse skeletal muscle can produce high quality X-ray diffraction patterns establishing the mouse intact skeletal muscle X-ray preparation as a potentially powerful tool to test structural hypotheses in health and disease. A notable feature of the mouse model system is the presence of residual myosin layer line intensities in contracting mouse muscle patterns. This provides an additional tool, along with the I1,1/I1,0 intensity ratio, for estimating the proportions of active versus relaxed myosin heads under a given set of conditions that can be used to characterize a given physiological condition or mutant muscle type. We also show that analysis of the myosin layer line intensity distribution, including derivation of the myosin head radius, Rm, may be used to study the role of the super-relaxed state in myosin regulation. When the myosin inhibitor blebbistatin is used to inhibit force production, there is a shift towards a highly quasi-helically ordered configuration that is distinct from the normal resting state, indicating there are more than one helically ordered configuration for resting crossbridges.

Keywords: X-ray diffraction; actomyosin interaction; sarcomere structure; skeletal muscle; super-relaxed state.


Conflict of interest statement

The authors declare no conflict of interest.

Figures

Figure 1
Figure 1
X-ray diffraction patterns from mouse EDL muscle. (A) Patterns from resting (left) and contracting (right) mouse EDL muscle. The equatorial reflections and myosin layer lines (MLL) are as indicated. (B) X-ray pattern from muscle in rigor at low gain (left) and at high gain (increased 3-fold, right). The equatorial reflections and actin-based layer lines (ALL) are as indicated. The box indicates the range used for the integrated intensity trace shown in Figure 2. C4: 4th myosin binding protein C reflection; M3: third order myosin meridional X-ray reflection; M6: sixth order myosin meridional reflection. AM: actomyosin.
Figure 1
Figure 1
X-ray diffraction patterns from mouse EDL muscle. (A) Patterns from resting (left) and contracting (right) mouse EDL muscle. The equatorial reflections and myosin layer lines (MLL) are as indicated. (B) X-ray pattern from muscle in rigor at low gain (left) and at high gain (increased 3-fold, right). The equatorial reflections and actin-based layer lines (ALL) are as indicated. The box indicates the range used for the integrated intensity trace shown in Figure 2. C4: 4th myosin binding protein C reflection; M3: third order myosin meridional X-ray reflection; M6: sixth order myosin meridional reflection. AM: actomyosin.
Figure 2
Figure 2
Low order meridional reflections in resting muscle. The meridional reflections, including high order sarcomere repeat, M1 cluster, M2 cluster, and M3 reflection. Taken from resting muscle with a 9 m sample to detector distance. Integration region is from 0.03 nm−1 to 0.077 nm−1 in reciprocal space (white box in Figure 1B). Reflection intensities to the left of the dotted line are scaled down by a factor of 15 for visibility. C1: lowest angle myosin binding protein C reflection; C2: second myosin binding protein C reflection (doublet with C1); M2: second order myosin meridional X-ray reflection; M3: third order myosin meridional X-ray reflection; Tn1: 1st order troponin reflection; Tn2: 2nd order troponin reflection.
Figure 3
Figure 3
Residual myosin layer line (MLL) intensity in X-ray patterns from contracting mouse muscle. (A) The layer line intensity traces from resting (green arrows), contracting (black arrows) and rigor patterns (red arrows) along the meridian integrated over a radial spacing range from 0.03 nm−1 to 0.077 nm−1. Both myosin (MLL) and actin (ALL) layer lines were present in contracting patterns, while all myosin layer lines were replaced by actin- or actomyosin-based layer lines in rigor patterns. (B) MLL4 remained at about 30% of its resting value in both EDL (0.27 ± 0.02, n = 17) and soleus muscle (0.28 ± 0.1, n = 11) during the plateau region of tetanic contraction. (C) Equatorial intensity ratio in resting (Rest), contracting (Cont) and rigor (Rigor) muscle.
Figure 4
Figure 4
Myosin layer line 4 (MLL4) intensities (in arbitrary units–a.u.) in resting and contracting mouse EDL muscle. (A). The normalized MLL4 intensities were the same in untreated normal (N) muscle and BTS-treated muscle but the intensities almost doubled in samples after blebbistatin treatment (BB). ns: p ≥ 0.05; ****: p < 0.0001. (B) MLL4 intensities against tension generated by blebbistatin-treated (BB) and normal untreated (N) muscle. Line is the fit to a second order polynomial with R2 = 0.87. Dotted lines show 95% confidence limits (C) MLL4 intensities against tension generated by BTS-treated and normal muscle. Solid line is the linear fit with R2 = 0.68 and the dotted lines are 95% confidence limits. The slope of the line is significantly different from zero (p < 0.0001).
Figure 5
Figure 5
Equatorial intensities in active and resting mouse EDL muscle. (A) The change in I1,1/I1,0 (ΔI1,1/I1,0), has a linear relationship with the tension generated by blebbistatin-treated (BB), BTS-treated (BTS), and normal contracting muscle (N). (B) I1,1/I1,0 in resting normal muscle (from Figure 3B), blebbistatin-treated (BB), and BTS-treated muscle. ns: p ≥ 0.05, *: p < 0.05. (C) Intensity ratio changes from resting to contracting conditions at maximum inhibited (less than 10% of normal contraction tensions) by BB as compared to normal contracting (N_C). (D) Intensity ratio changes from resting to contracting conditions at maximum inhibited (less than 10% of normal contraction tensions) by BTS as compared to normal contracting (N_C). (E) ΔI1,1/I1,0 (ΔIR) as a percent of its maximal value, as a function of normalized tension during tension rise after stimulation in tetanically contracting muscle in the absence of inhibitors. (F) As C, but showing linear behavior at low tension values.
Figure 6
Figure 6
Average myosin head radius (Rm) in resting mouse EDL muscle. (A) Under resting conditions, Rm was the same in normal muscle (N) and BTS-treated muscle, but smaller in samples with blebbistatin treatment (BB). ns: p ≥ 0.05, ***: p < 0.001 and ****: p < 0.0001. (B) At optimal length (L0) in passive stretching experiments, the Rm was 12.5 ± 0.29 nm (n = 11) and decreases with increasing passive tension. Solid line is the linear fit with R2 = 0.68 and the dotted lines are 95% confidence limits. The slope was significantly different from zero (p < 0.05).
Figure 7
Figure 7
Normalized integrated intensities from Tm reflections from both normal contracting and fully blebbistatin inhibited muscle. EDL and Sol—untreated EDL, and soleus muscles respectively. BB_EDL and BB_Sol—maximally inhibited (<10% maximum force) EDL and soleus muscle, respectively. ***: p < 0.001.

Similar articles

Cited by

References

    1. Brunello E., Bianco P., Piazzesi G., Linari M., Reconditi M., Panine P., Narayanan T., Helsby W.I., Irving M., Lombardi V. Structural changes in the myosin filament and cross-bridges during active force development in single intact frog muscle fibres: Stiffness and X-ray diffraction measurements. J. Physiol. 2006;577:971–984. doi: 10.1113/jphysiol.2006.115394. - DOI - PMC - PubMed
    1. Reconditi M. Recent improvements in small angle X-ray diffraction for the study of muscle physiology. Rep. Prog. Phys. 2006;69:2709–2759. doi: 10.1088/0034-4885/69/10/R01. - DOI - PMC - PubMed
    1. Tamura T., Wakayama J., Inoue K., Yagi N., Iwamoto H. Dynamics of thin-filament activation in rabbit skeletal muscle fibers examined by time-resolved X-ray diffraction. Biophys. J. 2009;96:1045–1055. doi: 10.1016/j.bpj.2008.09.022. - DOI - PMC - PubMed
    1. Huxley H.E. Past, present and future experiments on muscle. Philos. Trans. R. Soc. Lond. B Biol. Sci. 2000;355:539–543. doi: 10.1098/rstb.2000.0595. - DOI - PMC - PubMed
    1. Kress M., Huxley H.E., Faruqi A.R., Hendrix J. Structural changes during activation of frog muscle studied by time-resolved X-ray diffraction. J. Mol. Biol. 1986;188:325–342. doi: 10.1016/0022-2836(86)90158-0. - DOI - PubMed

LinkOut - more resources