. 2018 Sep 6;19(9):2646.
doi: 10.3390/ijms19092646.

RBM4a-SRSF3-MAP4K4 Splicing Cascade Constitutes a Molecular Mechanism for Regulating Brown Adipogenesis

Affiliations

RBM4a-SRSF3-MAP4K4 Splicing Cascade Constitutes a Molecular Mechanism for Regulating Brown Adipogenesis

Hui-Yu Peng et al. Int J Mol Sci. .

Abstract

An increase in mitogen-activated protein kinase kinase kinase kinase 4 (MAP4K4) reportedly attenuates insulin-mediated signaling which participates in the development of brown adipose tissues (BATs). Nevertheless, the effect of MAP4K4 on brown adipogenesis remains largely uncharacterized. In this study, results of a transcriptome analysis (also referred as RNA-sequencing) showed differential expressions of MAP4K4 or SRSF3 transcripts isolated from distinct stages of embryonic BATs. The discriminative splicing profiles of MAP4K4 or SRSF3 were noted as well in brown adipocytes (BAs) with RNA-binding motif protein 4-knockout (RBM4-/-) compared to the wild-type counterparts. Moreover, the relatively high expressions of authentic SRSF3 transcripts encoding the splicing factor functioned as a novel regulator toward MAP4K4 splicing during brown adipogenesis. The presence of alternatively spliced MAP4K4 variants exerted differential effects on the phosphorylation of c-Jun N-terminal protein kinase (JNK) which was correlated with the differentiation or metabolic signature of BAs. Collectively, the RBM4-SRSF3-MAP4K4 splicing cascade constitutes a novel molecular mechanism in manipulating the development of BAs through related signaling pathways.

Keywords: MAP4K4; RBM4a; SRSF3; alternative splicing; brown adipocytes.


Conflict of interest statement

The authors declare no conflict of interest.

Figures

Figure 1
Figure 1
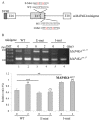
Splicing profiles of mitogen-activated protein kinase kinase kinase kinase 4 (MAP4K4) and serine/arginine-rich splicing factor 3 (SRSF3) transcripts are reprogrammed during brown adipogenesis. (A) The schemes respectively present the exon composition of mouse MAP4K4 and SRSF3 transcripts. (B) Total RNAs prepared from embryonic (E13.5 and E15.5) and postnatal (P0) brown adipose tissues dissected from wild-type (WT) and RBM4a−/− mice (n = 4) were subjected to RT-PCR assays using specific primer sets as listed in Supplementary Table S1. The bar graph presents relative levels of the MAP4K4 Iso 4 and SRSF3+ex4 transcripts. (C) C3H1oT1/2 cells were respectively transfected with empty vector or the RBM4a targeting vector (sh-RBM4a), followed by culturing in growth medium and differentiating medium for 48 h. Total RNAs extracted from non-differentiating (0 day) and differentiating cells (2 day) were subjected to RT-PCR assays using indicated primer sets (n = 4). The bar graph shows relative levels of MAP4K4 Iso 4 and SRSF3+ex4 transcripts. Signal densities of the RT-PCR products were quantified using TotalLab Quant Software. Quantitative results are shown as the mean ± SD. Statistical significance was determined using Student’s unpaired t-test (* p < 0.05; ** p < 0.01; *** p < 0.005), N.D., No Difference.
Figure 2
Figure 2
Overexpression of RNA-binding motif protein 4a (RBM4a) specifically reprograms splicing profiles of mitogen-activated protein kinase kinase kinase kinase 4 (MAP4K4) and serine/arginine-rich splicing factor 3 (SRSF3) transcripts. (A) Total RNAs and cell extracts were prepared from C3H10T1/2 cells respectively transfected with an expression vector encoding various SRSF family members or RBM4a, followed by culturing in growth medium for 24 h. (B) Total RNAs and cell extracts were isolated from C3H10T1/2 cells respectively transfected with an expression vector encoding wild-type (WT) RBM4a or the derived mutants, followed by culturing in growth medium for 24 h. (C) Total RNAs and cell lysates were extracted from C3H10T1/2 cells respectively transfected with an SRSF3-targeting vector, or expression vector encoding WT SRSF3 or the derived mutant, followed by culturing in growth medium for 24 h. Splicing profiles of MAP4K4 and SRSF3 transcripts were analyzed using RT-PCR assays with specific primer sets as listed in Supplementary Table S1. Immunoblot analyses were performed using specific antibodies against FLAG-tagged proteins, GAPDH, and SRSF3. The bar graph presents relative levels of MAP4K4 Iso 4 and SRSF3+ex4 transcripts in independent experiments (n = 4). Signal densities of the RT-PCR results were analyzed using TotalLab Quant Software, and quantitative results are shown as the mean ± SD (* p < 0.05; ** p < 0.01; *** p < 0.005), N.D., No Difference.
Figure 3
Figure 3
Overexpression of RNA-binding motif protein 4a (RBM4a) leads to an upregulated level of serine/arginine-rich splicing factor 3 (SRSF3)+ex4 transcripts in a intronic CU element-dependent manner. (A) The diagram presents the sequence of CU elements (underlined) within mouse SRSF3 exon 4′ and the downstream intron. (B) C3H10T1/2 cells were respectively transfected with the wild-type (WT) SRSF3 reporter and derived mutants, followed by culturing in growth (0 day) or differentiating (2 day) medium (n = 4). (C) An empty vector, or RBM4a-expressing vector, or RBM4a-targeting vector were respectively co-transfected with the WT SRSF3 minigene or derived mutants into C3H10T1/2 cells (n = 4). Total RNAs and cell extracts were isolated and subjected to RT-PCR and immunoblotting assays using primer sets as listed in Supplementary Table S1 and specific antibodies. The bar graph shows relative levels of SRSF3+ex4 transcripts. Signal densities of the RT-PCR results were quantified using TotalLab Quant Software. Quantitative results are shown as the mean ± SD. Statistical significance was determined using Student’s unpaired t-test (* p < 0.05; ** p < 0.01; *** p < 0.005), N.D., No Difference.
Figure 4
Figure 4
RNA-binding motif protein 4a (RBM4a) and serine/arginine-rich splicing factor 3 (SRSF3) discriminatively modulate the selection of mitogen-activated protein kinase kinase kinase kinase 4 (MAP4K4) exon 17 by interacting with distinct CU elements. (A) The scheme shows sequences of CU elements (underlined) within mouse MAP4K4 exon 17 and the downstream intron. (B) The wild-type (WT) MAP4K4 reporter and derived mutants were respectively transfected into C3H10T1/2 cells, followed by maintenance in growth (0 day) or differentiating (2 days) medium (n = 4). (C) The WT MAP4K4 reporter and derived mutants were respectively co-transfected with an expressing vector encoding RBM4a or SRSF3 into C3H10T1/2 cells. Total RNAs and cell extracts were prepared from transfected cells after 24 h and subjected to RT-PCR and immunoblotting assays with primer sets as listed in Supplementary Table S1 and specific antibodies (n = 4). The bar graph shows relative levels of MAP4K4−ex17 transcripts. Signal densities of the RT-PCR results were quantified using TotalLab Quant Software. Quantitative results are shown as the mean ± SD. Statistical significance was determined using Student’s unpaired t-test (* p < 0.05; ** p < 0.01; *** p < 0.005), N.D., No Difference.
Figure 4
Figure 4
RNA-binding motif protein 4a (RBM4a) and serine/arginine-rich splicing factor 3 (SRSF3) discriminatively modulate the selection of mitogen-activated protein kinase kinase kinase kinase 4 (MAP4K4) exon 17 by interacting with distinct CU elements. (A) The scheme shows sequences of CU elements (underlined) within mouse MAP4K4 exon 17 and the downstream intron. (B) The wild-type (WT) MAP4K4 reporter and derived mutants were respectively transfected into C3H10T1/2 cells, followed by maintenance in growth (0 day) or differentiating (2 days) medium (n = 4). (C) The WT MAP4K4 reporter and derived mutants were respectively co-transfected with an expressing vector encoding RBM4a or SRSF3 into C3H10T1/2 cells. Total RNAs and cell extracts were prepared from transfected cells after 24 h and subjected to RT-PCR and immunoblotting assays with primer sets as listed in Supplementary Table S1 and specific antibodies (n = 4). The bar graph shows relative levels of MAP4K4−ex17 transcripts. Signal densities of the RT-PCR results were quantified using TotalLab Quant Software. Quantitative results are shown as the mean ± SD. Statistical significance was determined using Student’s unpaired t-test (* p < 0.05; ** p < 0.01; *** p < 0.005), N.D., No Difference.
Figure 5
Figure 5
Mitogen-activated protein kinase kinase kinase kinase 4 (MAP4K4) isoforms differentially manipulate activation of c-Jun N-terminal kinase (JNK) signaling throughout brown adipogenesis. (A) Cell extracts were prepared from embryonic or postnatal brown adipose tissues (BATs) or (B) in vitro cultured cells transfected with an RNA-binding motif protein 4a (RBM4a)-targeting vector, followed by culturing in growth or differentiating medium. (C) C3H10T1/2 cells were respectively transfected with an empty vector or expression vectors encoding MAP4K4 isoforms. The cells extracts were isolated after 24 h and subjected to immunoblot assays. (D) Cell extracts were isolated from FLAG-tagged MAP4K4 Iso-overexpressing cells, followed by incubation with anti-FLAG M2 agarose. Cell extracts and precipitated complexes were analyzed with immunoblot assays using indicated antibodies (n = 4).
Figure 6
Figure 6
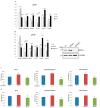
Mitogen-activated protein kinase kinase kinase kinase 4 (MAP4K4) isoforms and serine/arginine-rich splicing factor 3 (SRSF3) exhibit differential impacts on brown adipogenic gene expressions and metabolic signatures. (A,B) C3H10T1/2 cells were respectively transfected with an empty vector, expression vectors encoding MAP4K4 isoforms, or SRSF3-overexpressing or SRSF3-targeting vectors (n = 4). Total RNAs were prepared from transfected cells and subjected to qPCR assays with specific primer sets as listed in Supplementary Table S2. The bar graph shows relative levels of adipogenic genes normalized with the levels of Gapdh transcripts. (C,D) C3H10T1/2 cells were respectively transfected with an empty vector, expressing vectors encoding MAP4K4 isoforms, or SRSF3-overexpressing, or SRSF3-targeting vector, followed by culturing in growth medium for 24 h and then were subjected to bioenergetic analyses. The bar graph shows mean values of the basal and maximal oxygen consumption rates, and ATP production which were measured using a Seahorse XF24 Bioanalyzer (n = 4). Quantitative results are shown as the mean ± SD. Statistical significance was determined using Student’s unpaired t-test (* p < 0.05; ** p < 0.01; *** p < 0.005).

Similar articles

Cited by

References

    1. Kim S.P., Frey J.L., Li Z., Kushwaha P., Zoch M.L., Tomlinson R.E., Da H., Aja S., Noh H.L.J., Kim K., et al. Sclerostin influences body composition by regulating catabolic and anabolic metabolism in adipocytes. Proc. Natl. Acad. Sci. USA. 2017;114:E11238–E11247. doi: 10.1073/pnas.1707876115. - DOI - PMC - PubMed
    1. Hung C., Bronec C., Napoli E., Graham J., Stanhope K.L., Marsilio L., Giron M.C., Havel P.J., Giulivi C. Adipose depot-specific effects of ileal interposition surgery in UCD-T2D rats: Unexpected implications for obesity and diabetes. Biochem. J. 2018;475:649–662. doi: 10.1042/BCJ20170899. - DOI - PMC - PubMed
    1. Banfi S., Gusarova V., Gromada J., Cohen J.C., Hobbs H.H. Increased thermogenesis by a noncanonical pathway in ANGPTL3/8-deficient mice. Proc. Natl. Acad. Sci. USA. 2018;115:E1249–E1258. doi: 10.1073/pnas.1717420115. - DOI - PMC - PubMed
    1. Xiong Y., Yue F., Jia Z., Gao Y., Jin W., Hu K., Zhang Y., Zhu D., Yang G., Kuang S. A novel brown adipocyte-enriched long non-coding RNA that is required for brown adipocyte differentiation and sufficient to drive thermogenic gene program in white adipocytes. Biochim. Biophys. Acta. 2018;1863:409–419. doi: 10.1016/j.bbalip.2018.01.008. - DOI - PMC - PubMed
    1. Reza M.M., Subramaniyam N., Sim C.M., Ge X., Sathiakumar D., McFarlane C., Sharma M., Kambadur R. Irisin is a pro-myogenic factor that induces skeletal muscle hypertrophy and rescues denervation-induced atrophy. Nat. Commun. 2017;8:1104. doi: 10.1038/s41467-017-01131-0. - DOI - PMC - PubMed

LinkOut - more resources