Comparative Study
. 2018 Sep 10;18(1):92.
doi: 10.1186/s12874-018-0552-4.

Harmonization of delirium severity instruments: a comparison of the DRS-R-98, MDAS, and CAM-S using item response theory

Collaborators, Affiliations
Comparative Study

Harmonization of delirium severity instruments: a comparison of the DRS-R-98, MDAS, and CAM-S using item response theory

Alden L Gross et al. BMC Med Res Methodol. .

Abstract

Background: This study aimed to describe the level of agreement of three commonly used delirium instruments: the Delirium Rating Scale-Revised-98 (DRS-R-98), Memorial Delirium Assessment Scale (MDAS), and Confusion Assessment Method-Severity (CAM-S).

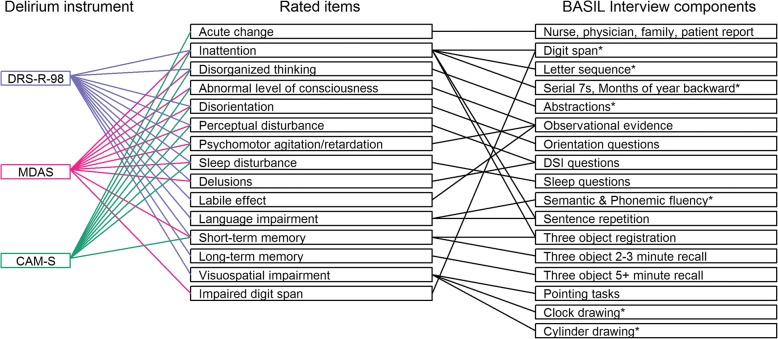
Methods: We used data from a prospective clinical research study, in which a team of trained lay interviewers administered each instrument along with supporting interview and cognitive assessments in the same group of patients daily while in the hospital (N = 352). We used item response theory methods to co-calibrate the instruments.

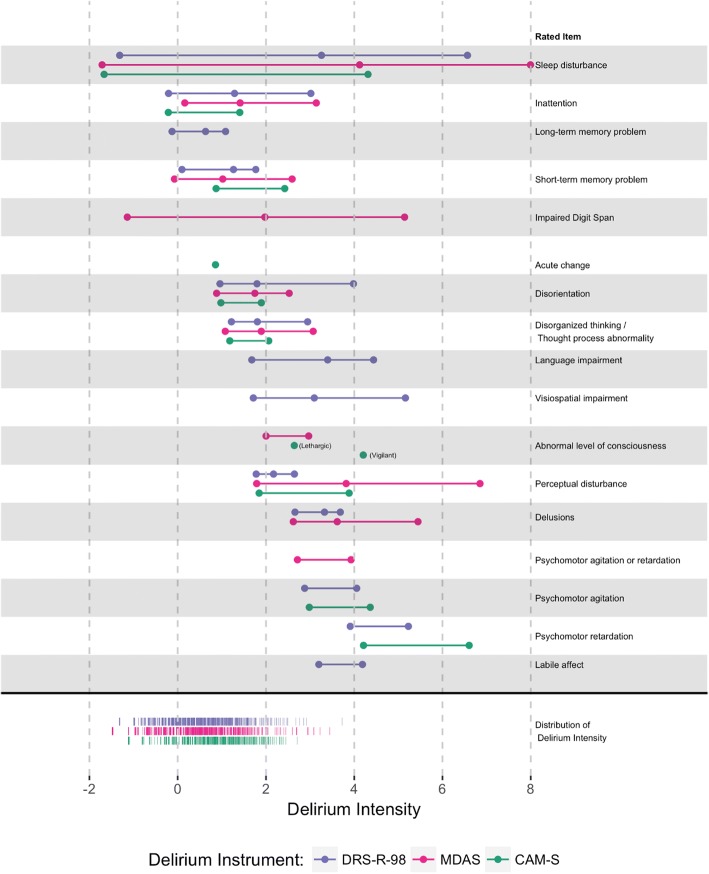
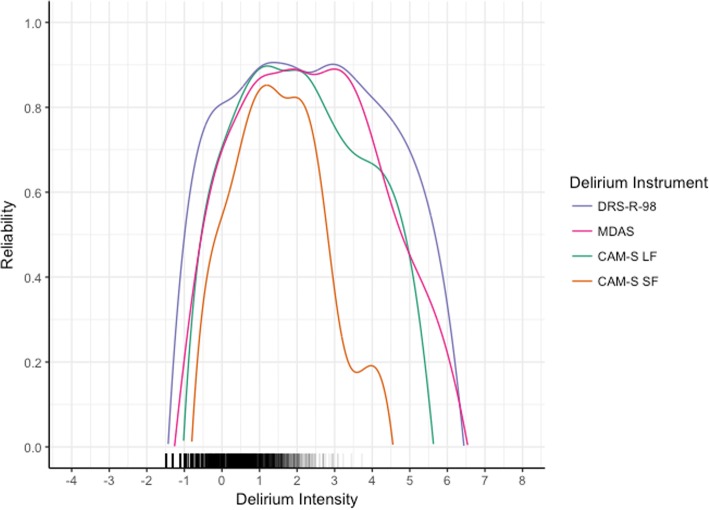
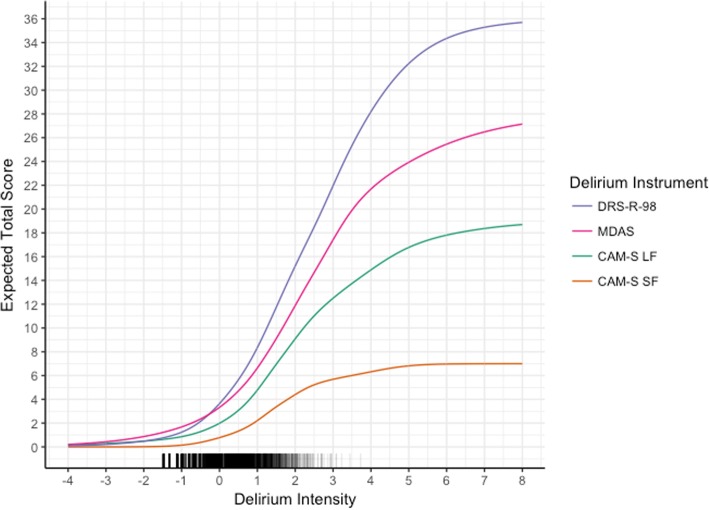
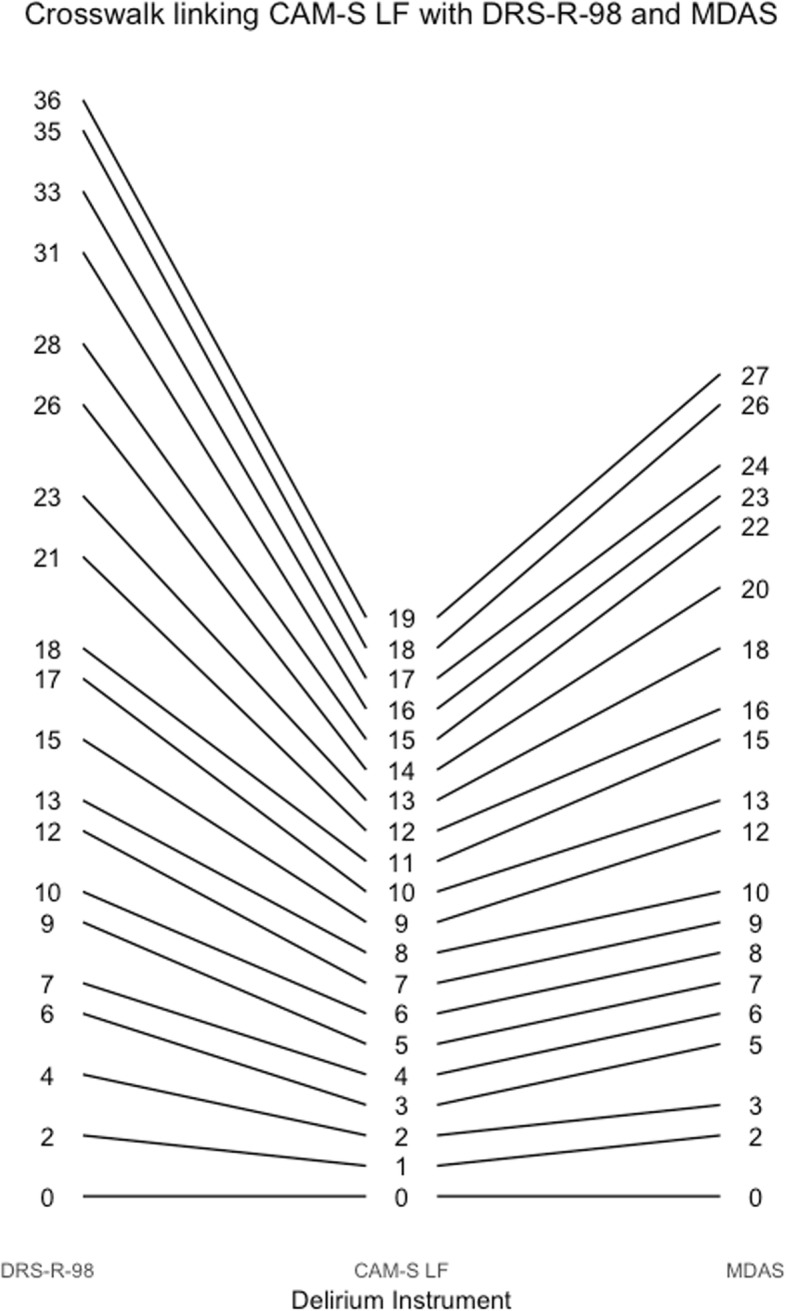
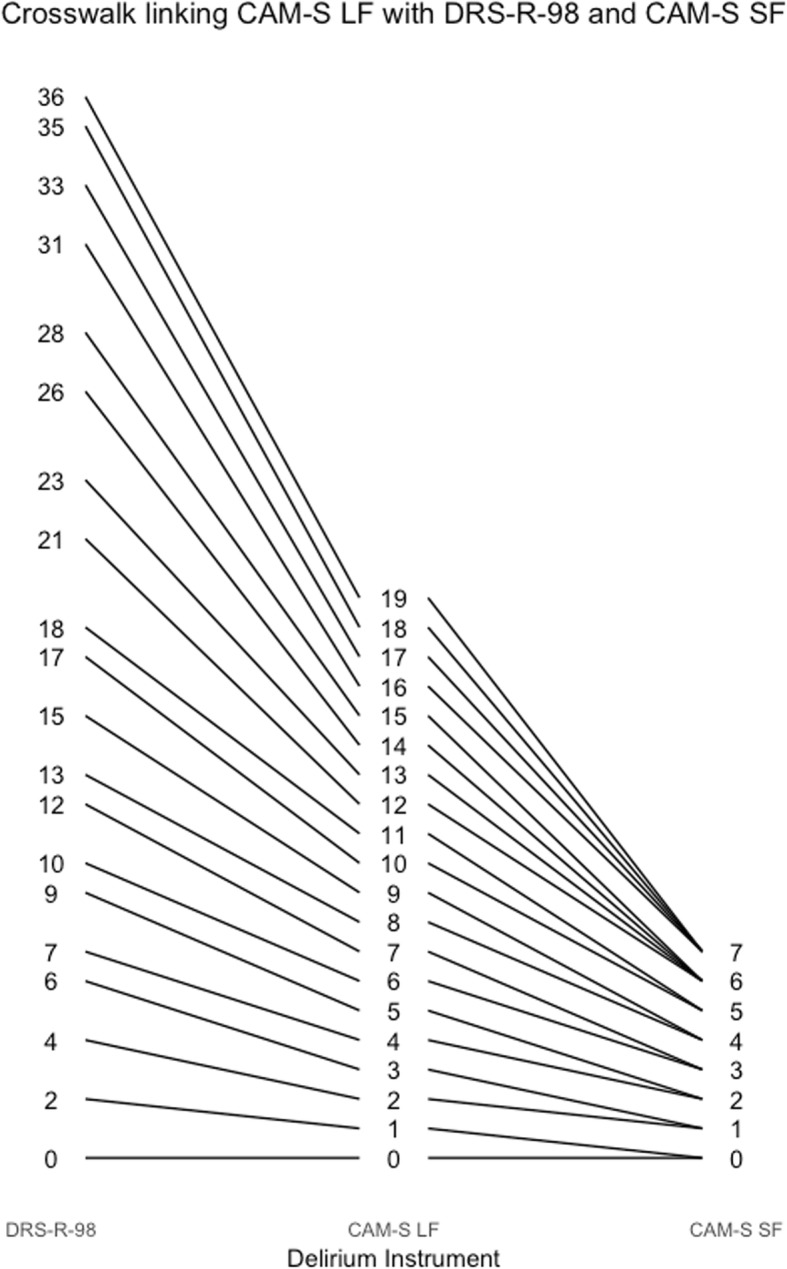
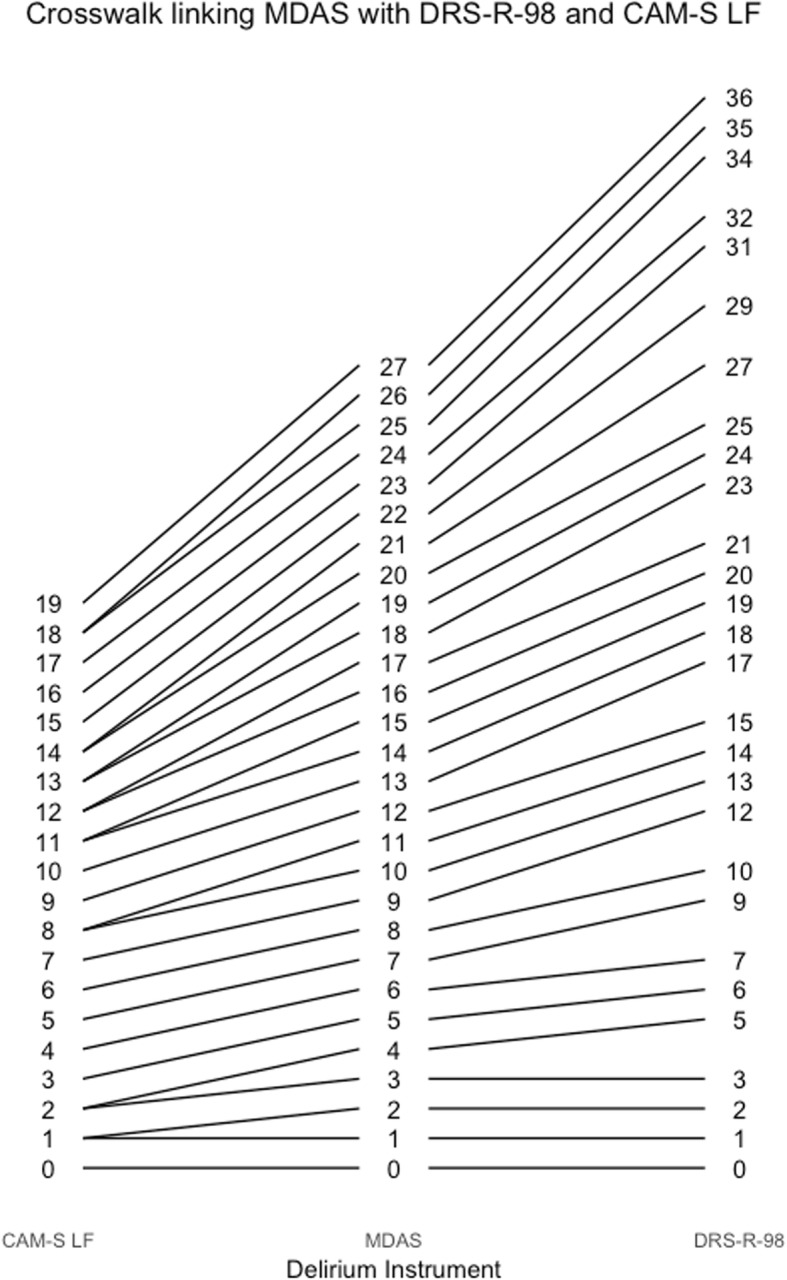
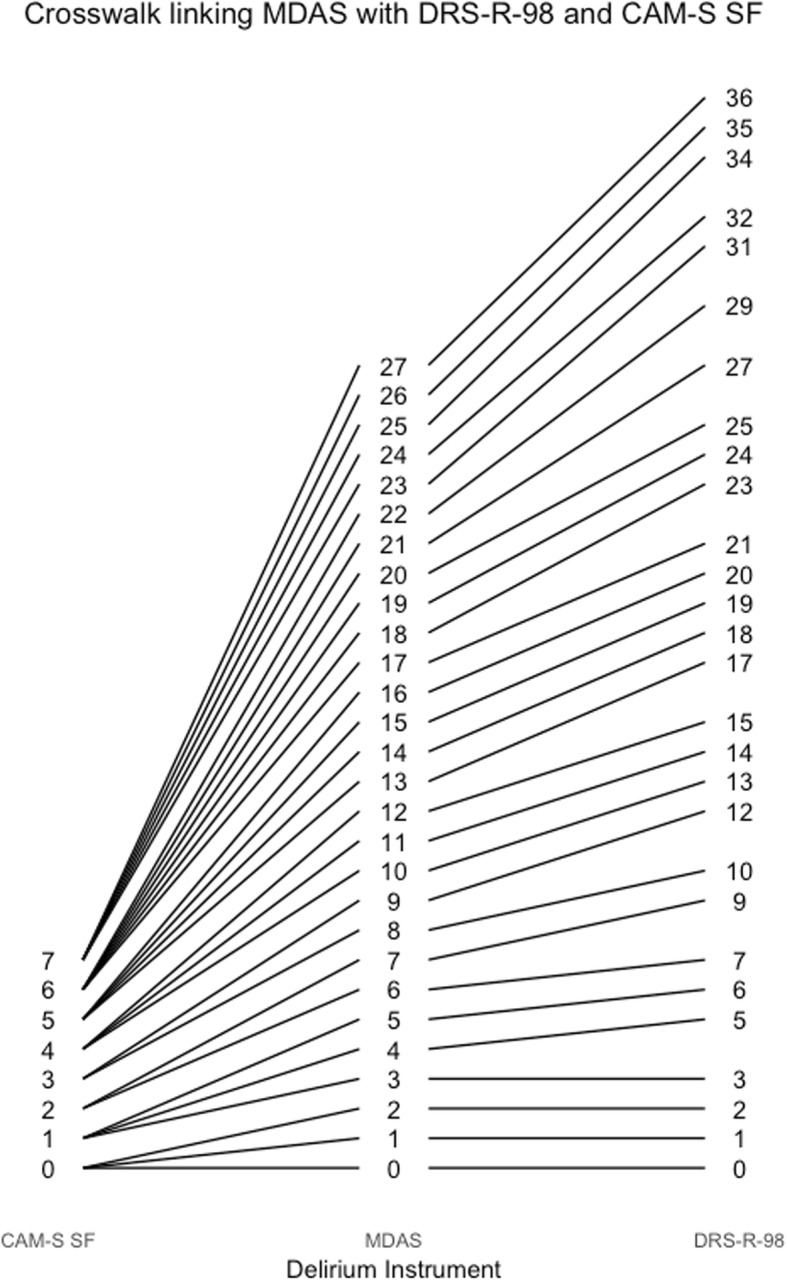
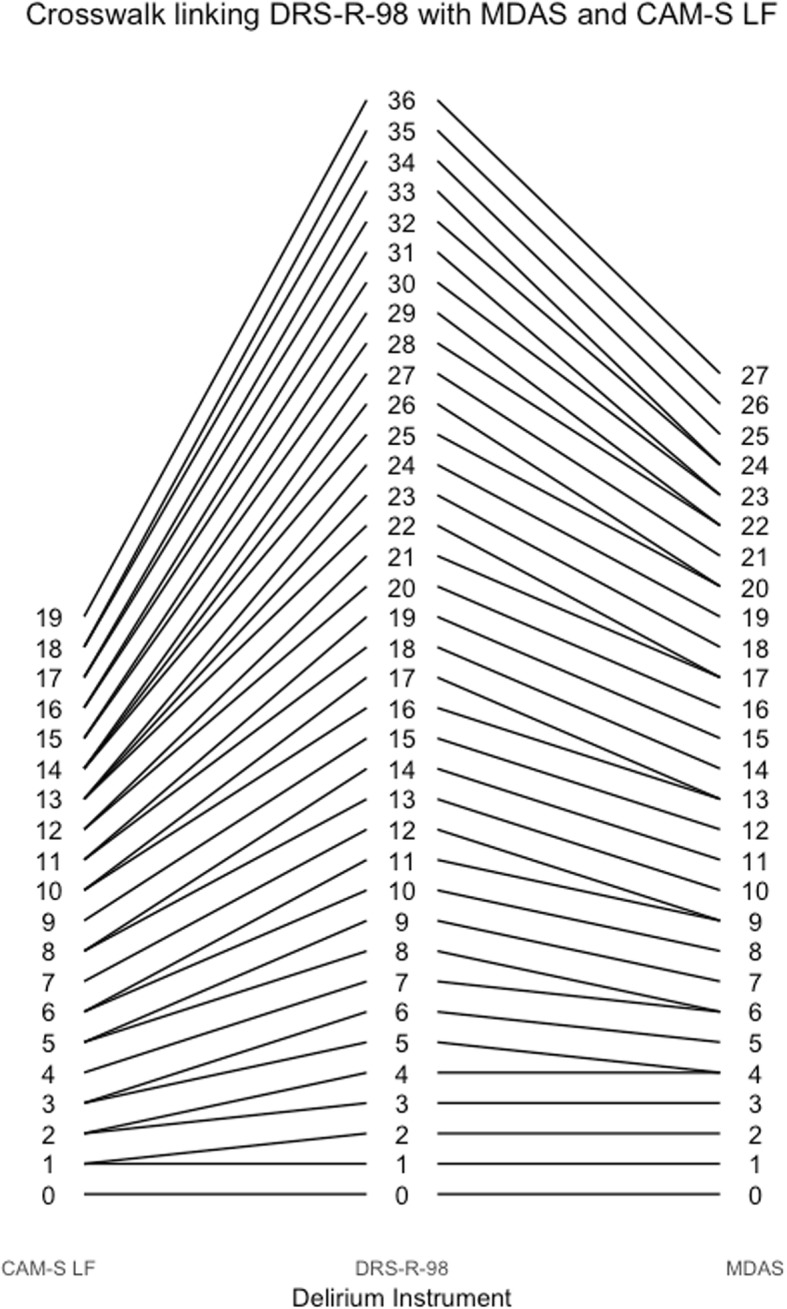
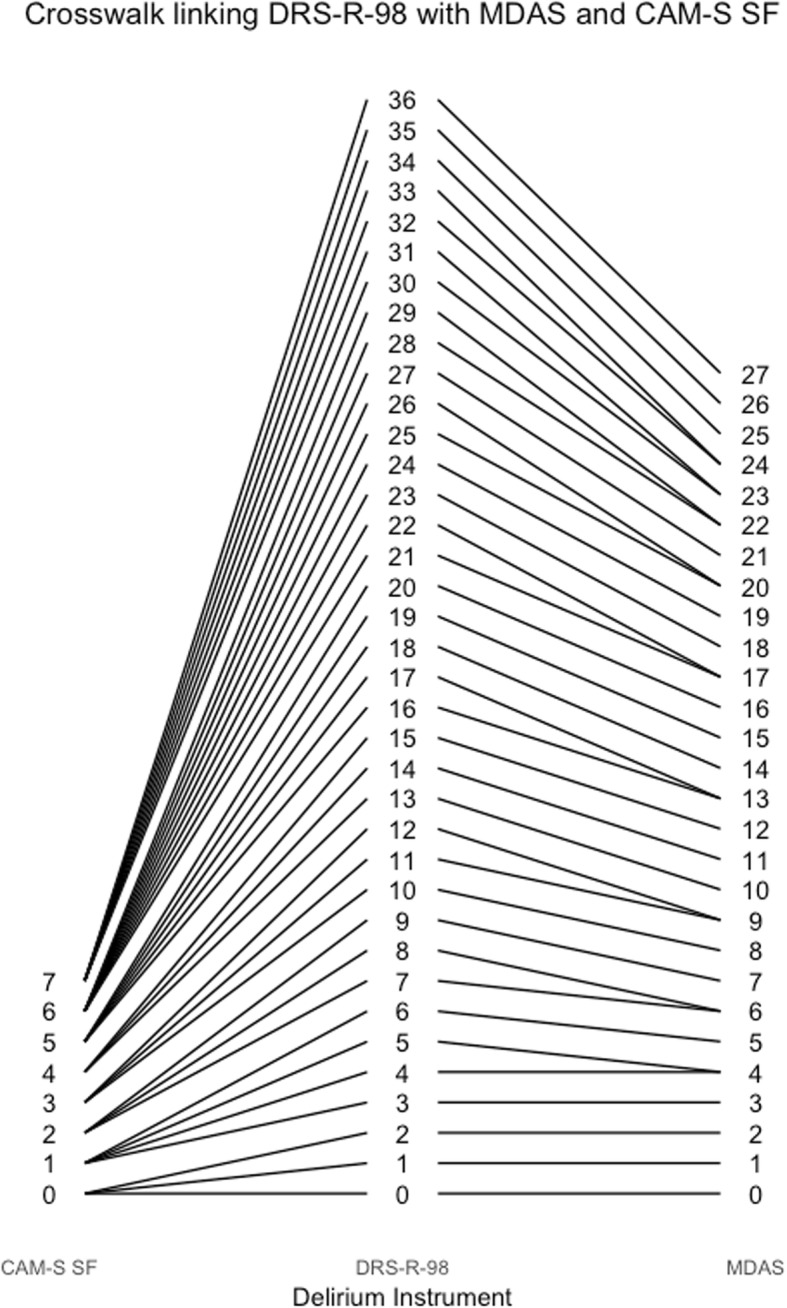
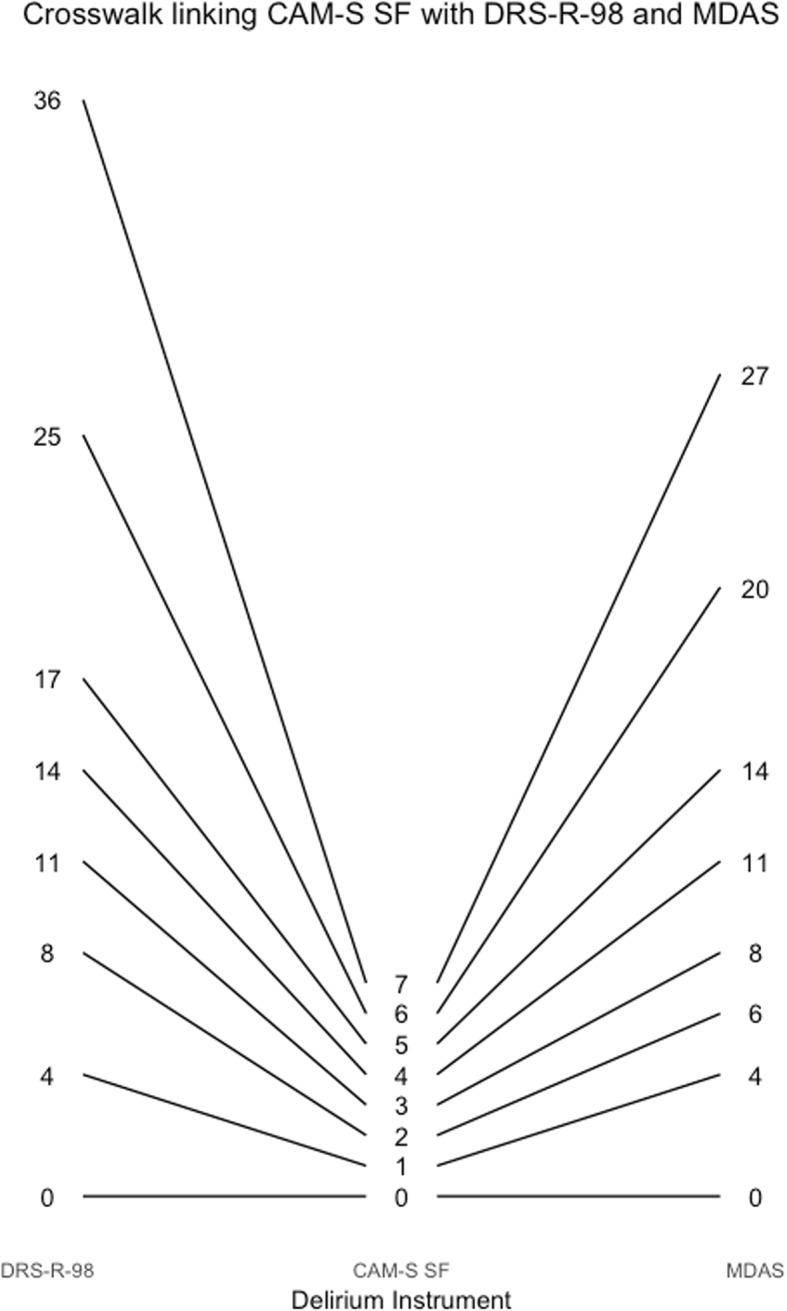
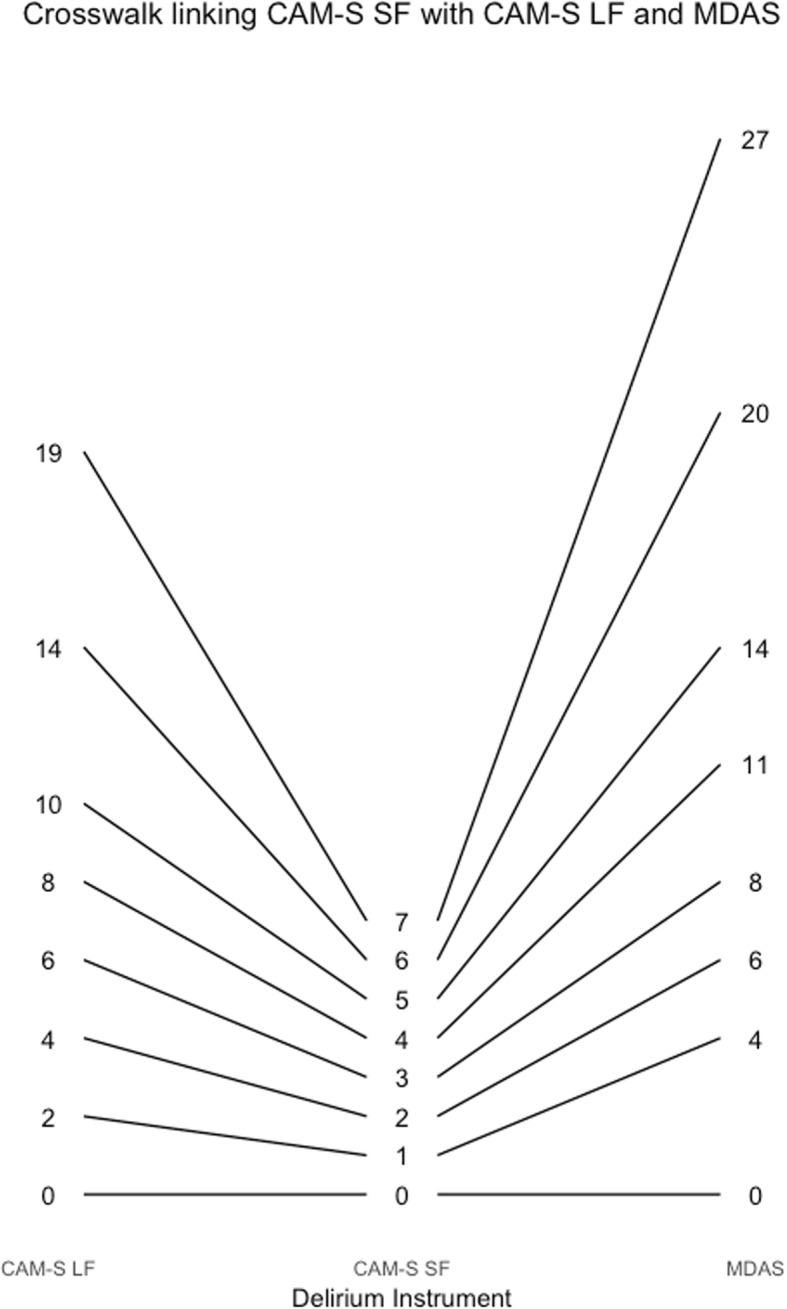
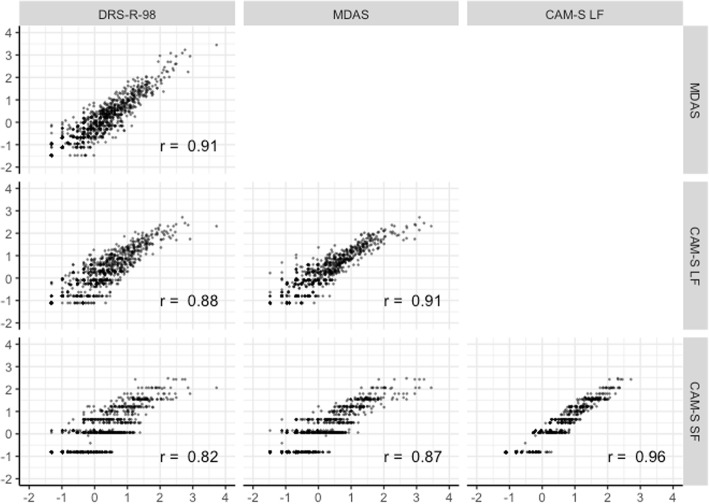
Results: The latent traits underlying the three measures, capturing the severity of a delirium assessment, had a high degree of correlation (r's > .82). Unidimensional factor models fit well, facilitating co-calibration of the instruments. Across instruments, the less intense symptoms were generally items reflecting cognitive impairment. Although the intensity of delirium severity for most in the sample was relatively low, many of the item thresholds for the delirium severity scales are high (i.e., in the more severe range of the latent ability distribution). This indicates that even people with severe delirium may have a low probability of endorsing the highest severity categories for many items. Co-calibration enabled us to derive crosswalks to map delirium severity scores among the delirium instruments.

Conclusion: These delirium instruments measure the same underlying construct of delirium severity. Relative locations of items may inform design of refined measurement instruments. Mapping of overall delirium severity scores across the delirium severity instruments enabled us to derive crosswalks, which allow scores to be translated across instruments, facilitating comparison and combination of delirium studies for integrative analysis.

Keywords: Delirium; Elderly; Item response theory; Psychometrics; Severity.


Conflict of interest statement

Ethics approval and consent to participate

Written informed consent was obtained from all participants according to protocols approved by the Institutional Review Boards of BIDMC, the study hospital, and the Institute for Aging Research - Hebrew SeniorLife, the study coordinating center.

Consent for publication

Not applicable.

Competing interests

The authors declare that they have no competing interests.

Publisher’s Note

Springer Nature remains neutral with regard to jurisdictional claims in published maps and institutional affiliations.

Figures

Fig. 1
Fig. 1
Map of instrument items, interview and rater assessments. In addition to formal interview questions, observational evidence was used to rate all domains. Orientation was assessed by questions regarding orientation to time and place. Sleep was assessed with a series of 6 questions about sleep quality in the last 24 h. The DSI (Delirium Symptom Interview) asked seven questions about distorted perceptions over the past 24 h. * Asterisked cognitive items are from the Montreal Cognitive Assessment (MoCA [23])
Fig. 2
Fig. 2
Item-person map: Results from the BASIL study (N = 1178 daily observations). Model-estimated item location parameters for each delirium instrument, grouped by rated item, are plotted along the range of delirium intensity. The distribution of delirium intensity scores in the sample is denoted on the bottom of the figure by the purple (DRS-R-98), pink (MDAS), and green (CAM-S) frequency distributions
Fig. 3
Fig. 3
Measurement precision contrasting different delirium intensity instruments: Results from the BASIL study (N = 1178 daily observations). Measurement precision or reliability for each delirium instrument is calculated using factor loadings and thresholds from the CFA models that included all rated items. The distribution of delirium intensity scores in the sample is denoted on the bottom of the figure
Fig. 4
Fig. 4
Test characteristic curves for delirium severity instruments: Results from the BASIL study (N = 1178 daily observations). These plots for each delirium instrument show the expected score a subject would have on an instrument for a given level of delirium intensity. The distribution of delirium intensity scores in the sample is denoted on the bottom of the figure
Fig. 5
Fig. 5
Crosswalk plot linking the CAM-S Long Form with the DRS-R-98 and MDAS: Results from the BASIL study (N = 1178 daily observations)
Fig. 6
Fig. 6
Crosswalk plot linking the CAM-S Long Form with the DRS-R-98 and CAM-S Short Form: Results from the BASIL study (N = 1178 daily observations)
Fig. 7
Fig. 7
Crosswalk plot linking the MDAS with the CAM-S Long Form and the DRS-R-98: Results from the BASIL study (N = 1178 daily observations)
Fig. 8
Fig. 8
Crosswalk plot linking the MDAS with the DRS-R-98 and the CAM-S Short Form: Results from the BASIL study (N = 1178 daily observations)
Fig. 9
Fig. 9
Crosswalk plot linking the DRS-R-98 with the MDAS and the CAM-S Long Form: Results from the BASIL study (N = 1178 daily observations)
Fig. 10
Fig. 10
Crosswalk plot linking the DRS-R-98 with the MDAS and the CAM-S Short Form: Results from the BASIL study (N = 1178 daily observations)
Fig. 11
Fig. 11
Crosswalk plot linking the CAM-S Short Form with the DRS-R-98 and the MDAS: Results from the BASIL study (N = 1178 daily observations)
Fig. 12
Fig. 12
Crosswalk plot linking the CAM-S Short Form with the CAM-S Long Form and the MDAS: Results from the BASIL study (N = 1178 daily observations)
Fig. 13
Fig. 13
Scatterplot matrix of factor scores from harmonized delirium severity instruments: Results from the BASIL study (N = 1178 daily observations)

References

    1. Inouye SK, Westendorp RG, Saczynski JS. Delirium in elderly people. Lancet. 2014;383(9920):911–922. doi: 10.1016/S0140-6736(13)60688-1. - DOI - PMC - PubMed
    1. Marcantonio ER. Delirium in hospitalized older adults. N Engl J Med. 2017;377(15):1456–1466. doi: 10.1056/NEJMcp1605501. - DOI - PMC - PubMed
    1. Oh ES, Fong TG, Hshieh TT, Inouye SK. Delirium in older persons: advances in diagnosis and treatment. JAMA. 2017;318(12):1161–1174. doi: 10.1001/jama.2017.12067. - DOI - PMC - PubMed
    1. Schmitt EM, Gallagher J, Albuquerque A, et al. Perspectives on the delirium experience and its burden: common themes among older patients, their family caregivers, and nurses. Gerontologist. 2017. 10.1093/geront/gnx153. - PMC - PubMed
    1. Witlox J, Eurelings LSM, de Jonghe JFM, Kalisvaart KJ, Eikelenboom P, Van Gool WA. Delirium in elderly patients and the risk of postdischarge mortality, institutionalization, and dementia. JAMA. 2010;304(4):443–451. doi: 10.1001/jama.2010.1013. - DOI - PubMed

Publication types