Review
. 2018 Sep 10;15(1):259.
doi: 10.1186/s12974-018-1288-0.

The human microglial HMC3 cell line: where do we stand? A systematic literature review

Affiliations
Review

The human microglial HMC3 cell line: where do we stand? A systematic literature review

Cinzia Dello Russo et al. J Neuroinflammation. .

Abstract

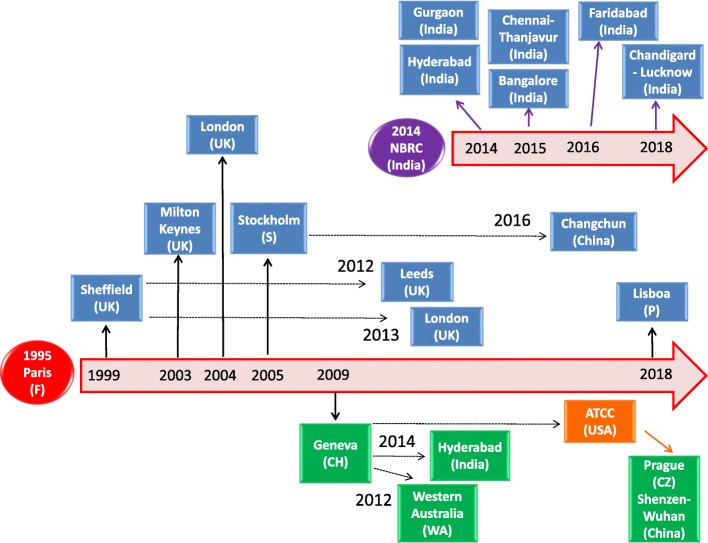
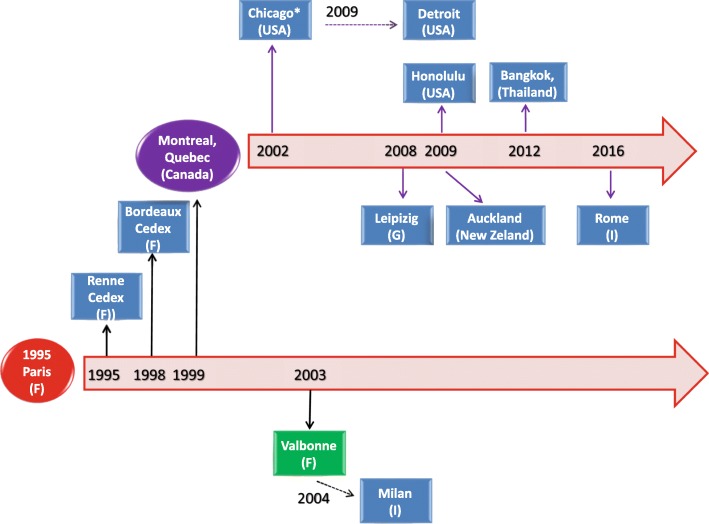
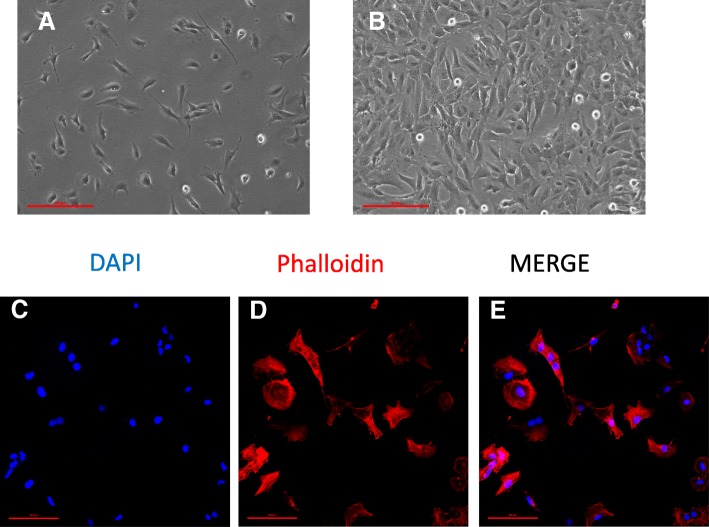
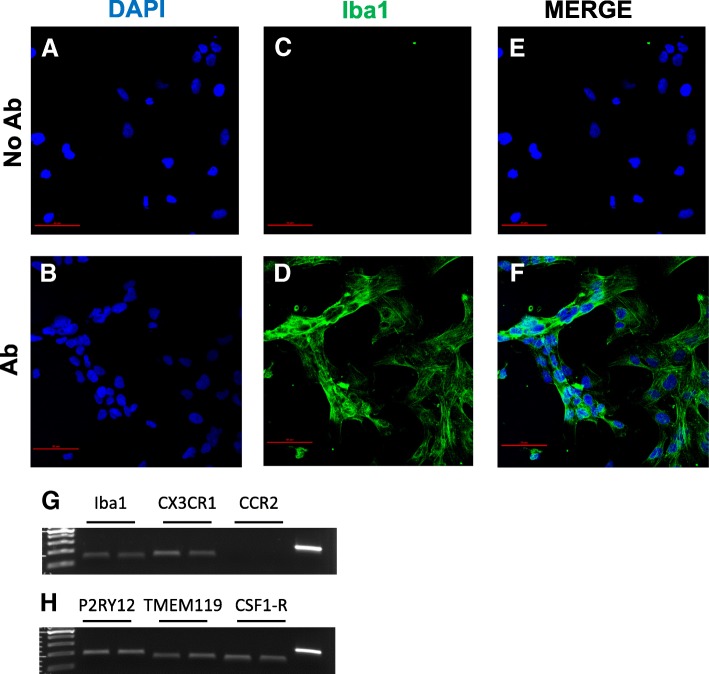
Microglia, unique myeloid cells residing in the brain parenchyma, represent the first line of immune defense within the central nervous system. In addition to their immune functions, microglial cells play an important role in other cerebral processes, including the regulation of synaptic architecture and neurogenesis. Chronic microglial activation is regarded as detrimental, and it is considered a pathogenic mechanism common to several neurological disorders. Microglial activation and function have been extensively studied in rodent experimental models, whereas the characterization of human cells has been limited due to the restricted availability of primary sources of human microglia. To overcome this problem, human immortalized microglial cell lines have been developed. The human microglial clone 3 cell line, HMC3, was established in 1995, through SV40-dependent immortalization of human embryonic microglial cells. It has been recently authenticated by the American Type Culture Collection (ATCC®) and distributed under the name of HMC3 (ATCC®CRL-3304). The HMC3 cells have been used in six research studies, two of which also indicated by ATCC® as reference articles. However, a more accurate literature revision suggests that clone 3 was initially distributed under the name of CHME3. In this regard, several studies have been published, thus contributing to a more extensive characterization of this cell line. Remarkably, the same cell line has been used in different laboratories with other denominations, i.e., CHME-5 cells and C13-NJ cells. In view of the fact that "being now authenticated by ATCC®" may imply a wider distribution of the cells, we aimed at reviewing data obtained with the human microglia cell line clone 3, making the readers aware of this complicated nomenclature. In addition, we also included original data, generated in our laboratory with the HMC3 (ATCC®CRL-3304) cells, providing information on the current state of the culture together with supplementary details on the culturing procedures to obtain and maintain viable cells.

Keywords: C13-NJ; CHME-3; CHME-5; CHME3; Chemokines; Free oxygen radicals; Functional properties; HMC-3; HMC3; Human microglial cell line; IL-6; Molecular phenotype; Molecular signature.


Conflict of interest statement

Ethics approval and consent to participate

All the experiments were carried out on the human microglial cell line, HMC3 (ATCC®CRL-3304) cells authenticated and distributed by ATCC®. The cell line has been used under the term and conditions indicated in the approved material transfer agreement. The use of a single anonymized human genomic DNA sample was authorized by ViiV Healthcare Ldt., under the terms and conditions signed by the Italian HLA-B*57:01 Virological-Clinical Network. Ethics approval was not required since the sample derived from a previous study is approved by the local Ethical Committee which comprised future use for methodological studies [112].

Consent for publication

We used a single anonymized human genomic DNA sample provided by ViiV Healthcare Ltd., for which consent for publication is not required [112].

Competing interests

The authors declare that they have no competing interests.

Publisher’s Note

Springer Nature remains neutral with regard to jurisdictional claims in published maps and institutional affiliations.

Figures

Fig. 1
Fig. 1
Historical reconstruction of the distribution process of the human microglial clone 3 cell line. The human microglial clone 3 cell line was developed in the laboratory of Prof. M Tardieu, Paris, in 1995 (red circle). As shown in the picture, clone 3 has been distributed worldwide, with the acronym of CHME3 cells (blue boxes) or HMC3 cells (green boxes). Distribution followed two main pathways, either directly from Prof. Tardieu’s laboratory (black thick arrows) or indirectly by the first recipient laboratory (black dotted arrows). A second main distributor of the CHME3 cell line is the laboratory of Prof. A Basu, National Brain Research Centre (NBRC), India (purple circle). Since 2014, this laboratory appears to be the main distributor of the CHME3 cells in India. However, we could not trace on the timeline when the cell line was transferred from the laboratory of Prof. Tardieu to NBRC. In addition, we identified several studies (not reported in the schematic), in which the CHME3 cells were used without any indication of the source, and one study in which the cell line was provided by an Academic institution without any link to published data. In 2016, the HMC3 cells were transferred to ATCC®, USA (orange box) and authenticated and distributed under the catalog designation of HMC3 (ATCC®CRL-3304)
Fig. 2
Fig. 2
Historical reconstruction of the distribution process of the human microglial CHME-5 cell line. The human microglial CHME-5 cell line was developed in the laboratory of Prof. M Tardieu, Paris, in 1995 (red circle). As shown in the picture, CHME-5 cells have been distributed worldwide (blue boxes). Same cells were used with the acronym C13-NJ cells (green box). Distribution followed two main pathways, either directly from Prof. Tardieu’s laboratory (black thick arrows) or indirectly by the first recipient laboratory (black dotted arrows). Since 2002, the laboratory of Prof. Talbot, University of Quebec, Montreal, Canada, (purple circle), appears to be the main distributor of the CHME-5 cells. In addition, we identified several studies (not reported in the schematic), in which the CHME-5 cells were used without any indication of the source. Moreover, other laboratories received the cells from academic institutions for which publication records are unavailable.* Prof. Feinstein, University of Illinois, Chicago, USA, personal communication
Fig. 3
Fig. 3
HMC3 cell morphology and labeling of cytoskeletal F-actin filaments. ab The human microglial cell line HMC3 as it was observed by phase-contrast microscopy at in vitro day 1 (a), and when cells reached the confluency (b). × 10 magnification, scale bar 100 μM. ce A representative example of confocal images (1024 × 1024 pixels) acquired at × 20 magnification with a confocal laser scanning system (A1+, Nikon). Cells were grown on glass coverslips for 24 h, and their morphology was evaluated by labeling the cytoskeletal F-actin filaments with tetramethylrhodamine (TRITC)-conjugated phalloidin (red fluorescence). Cells were counterstained with the nuclear probe, 4′,6-damidino-2-phenylindole dihydrochloride (DAPI, blue fluorescence). The merged image is shown in (e). Scale bar 50 μM
Fig. 4
Fig. 4
HMC3 cell expression of microglial lineage markers. af Representative example of confocal images (1024 × 1024 pixels) acquired at × 20 magnification with a confocal laser scanning system (A1+, Nikon). HMC-3 cells immuno-labeled for IBA1 (green fluorescence, d, f) and DAPI stained (blue fluorescence, a, b) are shown. Merged images are shown in (e, f). Control experiments performed by omitting the primary antibody are shown in (a, c, e). No green fluorescence was present (c, e), indicating neither spontaneous fluorescence nor non-specificity of the secondary antibody. Scale bar 50 μM. gh Total RNA was prepared from human microglial HMC3 cells 24 h after incubation in complete growth medium and retrotranscribed using random hexamers. Real time (Q)-PCR analysis for the mRNA levels of IBA1, CX3CR1, CCR2, P2RY12, TMEM119, and CSF1-R was carried out according to our standard protocols [109]. g, h panels show a representative gel image of PCR products obtained at the end of the analysis from two different RNA samples for each condition. In the last line is shown the actin amplification, as positive control
Fig. 5
Fig. 5
Phenotypical characterization of HMC3 cells under basal conditions and in response to IFNγ. HMC3 cells were plated at the density of 30,000 cells/cm2 in T25 flasks, and grown for 3 days when cells were almost confluent. In the experiments in which INFγ was used, cells were stimulated for the last 36 h. Controls did not receive any stimulus for the same time period (“resting” HMC3 cells). For detection of intracellular antigens, aliquots of 1 × 106 cells in 100 μl were fixed using BD cytofix (BD Pharmingen) at 4 °C for 30 min, and permeabilized with BD FACS permeabilizing solution at 4 °C for 30 min. Cells were then stained using the following antibodies: PE-conjugated anti Human GFAP mouse Mab, BD Bioscience (a), and PE-CF594-conjugated anti Human CD68 mouse Mab, BD Bioscience (e), according to the manufacturer’s instructions. For the evaluation of surface antigens, aliquots of 5 × 105 cells in 100 μl were directly incubated in PBS buffer containing the following antibodies: PE-CF594-conjugated anti Human HLA-DR mouse Mab, BD Bioscience (b); FITC-conjugated anti Human CD14 mouse Mab, BD Pharmingen (c); and PE-conjugated anti Human CD11b mouse Mab, E-Bioscience (d). Cells were analyzed by the 6-parameter (2 scatter and 4 fluorescence signals) Coulter Epics XL flow cytometer (Beckman-Coulter). Control histograms (white histograms) indicate level of cell autofluorescence in the emission wavelength that pertains the fluorochrome-conjugated Mab. Panel (a) shows expression of GFAP on HMC3 cells at passage 4 (dark gray), and on the human glioblastoma U373 cell line (light gray) that constitutively expresses GFAP. As autofluorescence signal in the two cell lines was similar, only one representative histogram is plotted in panel (a) (white histogram). As shown in this panel, the HMC3 cells stain negatively for GFAP (the dark gray histogram completely overlaps the background histogram), whereas the U373 cells express the target antigen. Two different populations expressing GFAP at different levels were identified (light gray plot): 68% of the U373 cells express GFAP at low level (GFAP-dim), whereas 32% of the cells express GFAP at higher level (GFAP-high). Panels (be) show results from HMC3 cells obtained at passage 7. In these panels, white histograms indicate cell autofluorescence, light gray histograms and dark gray histograms are representative of control (“resting”) HMC3 cells and IFNγ-treated HMC3 cells, respectively. Gating strategy: all analyses were obtained after gating according to morphological characteristics (not shown). As levels of autofluorescence did not change according to cell treatment, one representative example is plotted for each emission wavelength. Linear regions are used for calculating percentage of positive cells (plots A–B). Central tendency of CD68 expression on HMC3 cells in the different experimental conditions is represented by the mean fluorescence intensity (MFI, see text)
Fig. 6
Fig. 6
Expression of the human class I MHC antigens on HMC3 cells. a HMC3 were plated at the density 30,000 cells/cm2 in T25 flasks, and grown for 3 days when cells were almost confluent. For the detection of class I MHC surface antigens, aliquots of 5 × 105 cells in 100 μl were directly incubated with FITC-conjugated anti human HLA-ABC mouse Mab, BD Bioscience. This antibody is specific for human MHCI antigens, and does not cross react with rat MHCI antigens. Cells were analyzed by the 6-parameter (2 scatter and 4 fluorescence signals) Coulter Epics XL flow cytometer (Beckman-Coulter). Results from HMC3 cells at passage 8 are shown. Gating strategy: the analysis was obtained after gating according to morphological characteristics (not shown). Background histogram (white) indicates level of cell autofluorescence. A linear region was used for calculating percentage of positive cells. b Gel image of PCR products obtained at the end of a HLA Locus B specific amplification protocol. The 922 bp amplicons were separated by electrophoresis through 1.5% agarose gels containing 0.1 μg/ml ethidium bromide. Lines 2–3 amplification products from genomic DNA extracted by HMC3 (ATCC®CRL-3304) cells; lines 4–5 amplification products from a positive control, i.e., an anonymous human genomic DNA sample provided by ViiV Healthcare Ldt

References

    1. Butovsky O, Jedrychowski MP, Moore CS, Cialic R, Lanser AJ, Gabriely G, Koeglsperger T, Dake B, Wu PM, Doykan CE, Fanek Z, Liu L, Chen Z, Rothstein JD, Ransohoff RM, Gygi SP, Antel JP, Weiner HL. Identification of a unique TGF-β-dependent molecular and functional signature in microglia. Nat Neurosci. 2014;17:131–143. doi: 10.1038/nn.3599. - DOI - PMC - PubMed
    1. Gosselin D, Skola D, Coufal NG, Holtman IR, Schlachetzki JCM, Sajti E, Jaeger BN, O'Connor C, Fitzpatrick C, Pasillas MP, Pena M, Adair A, Gonda DD, Levy ML, Ransohoff RM, Gage FH, Glass CK. An environment-dependent transcriptional network specifies human microglia identity. Science. 2017;356 10.1126/science.aal3222. - PMC - PubMed
    1. Sousa C, Biber K, Michelucci A. Cellular and molecular characterization of microglia: a unique immune cell population. Front Immunol. 2017;8:198. 10.3389/fimmu.2017.00198. - PMC - PubMed
    1. Salter MW, Stevens B. Microglia emerge as central players in brain disease. Nat Med. 2017;23:1018–1027. doi: 10.1038/nm.4397. - DOI - PubMed
    1. Wake H, Moorhouse AJ, Jinno S, Kohsaka S, Nabekura J. Resting microglia directly monitor the functional state of synapses in vivo and determine the fate of ischemic terminals. J Neurosci. 2009;29:3974–3980. doi: 10.1523/JNEUROSCI.4363-08.2009. - DOI - PMC - PubMed

MeSH terms