. 2018 Sep 11:7:e37125.
doi: 10.7554/eLife.37125.

The influence of the descending pain modulatory system on infant pain-related brain activity

Affiliations

The influence of the descending pain modulatory system on infant pain-related brain activity

Sezgi Goksan et al. Elife. .

Abstract

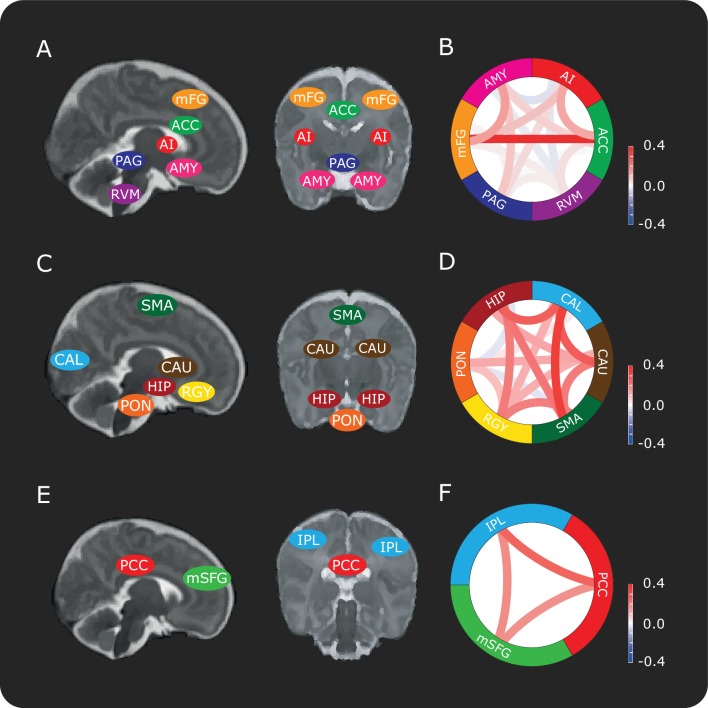
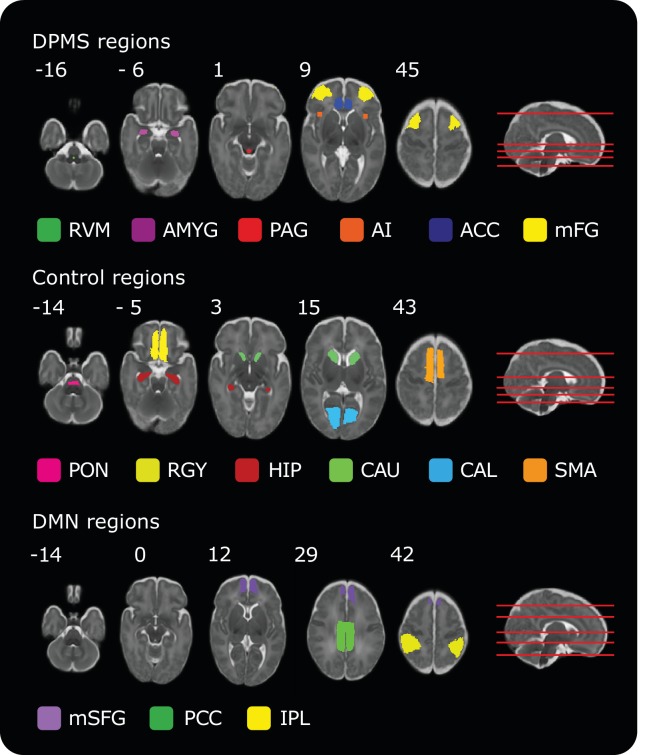
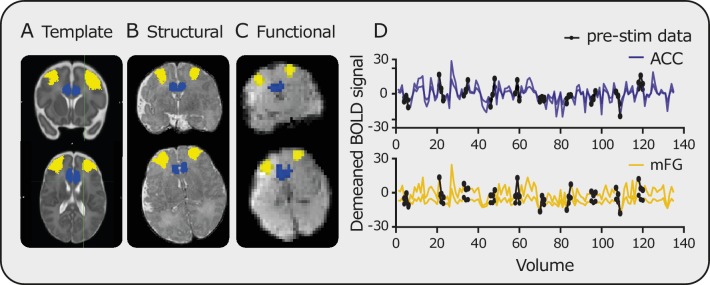
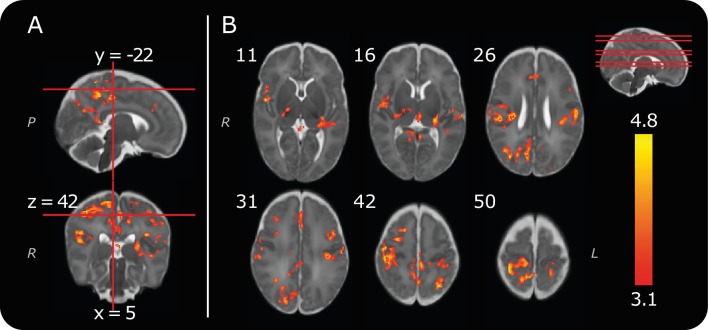
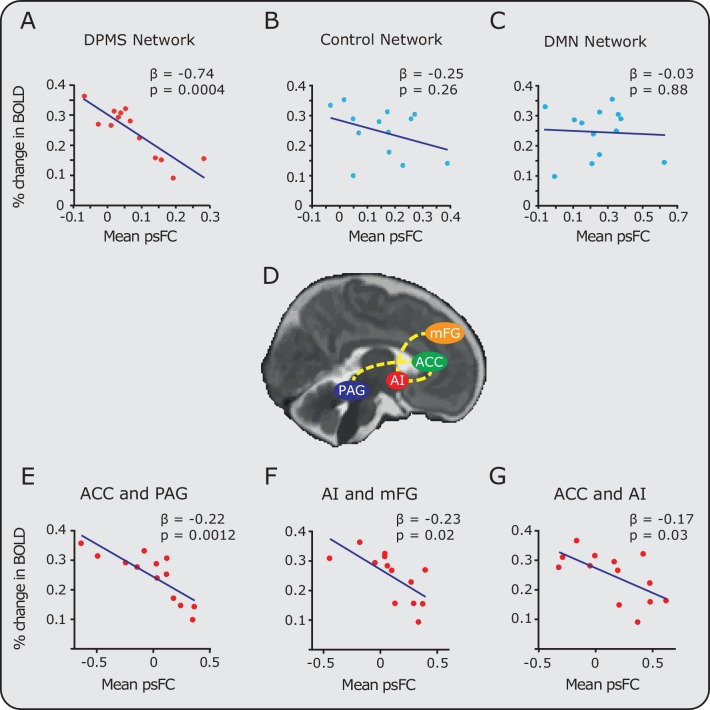
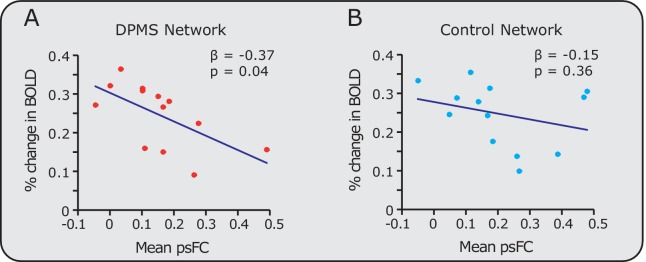
The descending pain modulatory system (DPMS) constitutes a network of widely distributed brain regions whose integrated function is essential for effective modulation of sensory input to the central nervous system and behavioural responses to pain. Animal studies demonstrate that young rodents have an immature DPMS, but comparable studies have not been conducted in human infants. In Goksan et al. (2015) we used functional MRI (fMRI) to show that pain-related brain activity in newborn infants is similar to that observed in adults. Here, we investigated whether the functional network connectivity strength across the infant DPMS influences the magnitude of this brain activity. FMRI scans were collected while mild mechanical noxious stimulation was applied to the infant's foot. Greater pre-stimulus functional network connectivity across the DPMS was significantly associated with lower noxious-evoked brain activity (p = 0.0004, r = -0.86, n = 13), suggesting that in newborn infants the DPMS may regulate the magnitude of noxious-evoked brain activity.

Keywords: brain; descending pain modulation; human; infant; neuroscience; pain.


Conflict of interest statement

SG, LB, FM, ED, GH, CH, IT, RS No competing interests declared

Figures

Figure 1.
Figure 1.. Connectivity between brain regions in the DPMS and control networks.
Schematic representation showing approximate locations of brain regions in sagittal and coronal slices in the (A) DPMS Network, (C) Control Network and (E) Default Mode Network. Each anatomical region of interest is identified in Figure 1—figure supplement 1 and the source data is provided in Figure 1—source data 1. Figure 1—figure supplement 2 shows the registration of two example masks from template to functional space and example time series. Network schematics of the mean pre-stimulus functional connectivity between pairs of regions in the (B) DPMS Network, (D) Control Network and (F) Default Mode Network. For abbreviations see main text.
Figure 1—figure supplement 1.
Figure 1—figure supplement 1.. Masks of regions included in the DPMS, Control Network and Default Mode Network.
Numbers by the top left of each transverse image represent coordinate locations in infant template space. The location of each transverse slice is demonstrated (red lines) on the sagittal template brain on the right. The source data (Figure 1—source data 1) contains all the brain regions in standard space for all networks.
Figure 1—figure supplement 2.
Figure 1—figure supplement 2.. Registration and time series data.
Registration of masks from (A) template to (B) structural and finally to (C) functional space (blue mask = ACC, yellow mask = mFG). (D) Examples of the resulting time series within the ACC (blue) and mFG (yellow). Black circles highlight the pre-stimulus data points.
Figure 1—figure supplement 3.
Figure 1—figure supplement 3.. Pre-stimulus connectivity is stable.
Average pre-stimulus connectivity in the DPMS Network across infants prior to each of the 10 stimuli. Error bars indicate mean and standard deviation.
Figure 2.
Figure 2.. Group noxious-evoked brain activity.
(A) Sagittal and coronal views of the significant group activity from the 13 infants. Red lines indicate how the two images (and the transverse image at z = 42, in B) relate to one another. (B) Transverse images showing significant group activity. The source data is provided in Figure 2—source data 1). Numbers by the top left of each image represent coordinate locations in infant template space. The location of each transverse slice is demonstrated (red lines) on the sagittal template brain in the top right. The activity map is overlaid on a standard template of an infant brain at 40 weeks’ gestational age (Serag et al., 2012). Letters in italics depict axis labels: L = left, R = right, = posterior. Statistical maps are of cluster thresholded z-statistics (z > 3.1, cluster significance threshold p < 0.05).
Figure 3.
Figure 3.. Relationship between noxious-evoked brain activity and pre-stimulus functional connectivity in the DPMS and control networks.
Linear regression models (blue lines) were used to compare pre-stimulus functional connectivity (psFC) with the percentage change in BOLD activity in the (A) DPMS Network, (B) Control Network and (C) the Default Mode Network (DMN). Noxious-evoked brain activity for each infant (calculated within a mask of the group activity, see Figure 2) was adjusted for gestational age (in weeks) at the time of study. Coloured circles represent data from individual infants within the DPMS (red) and control networks (light blue). Figure 3—source data 1 provides the individual PAG and RVM functional masks for each infant. Figure 3—figure supplement 1 shows the relationship between the percentage change in BOLD activity and the psFC in the DPMS Network and Control Network with the brainstem regions removed. (D) The brain schematic highlights the pairs of brain regions where psFC was significantly correlated with percentage change in the BOLD response (dashed yellow lines). (E,F,G) The three pairs of regions within the DPMS Network which demonstrated strong correlations between mean psFC and noxious-evoked brain activity.
Figure 3—figure supplement 1.
Figure 3—figure supplement 1.. Relationship between percentage change in noxious-evoked brain activity and pre-stimulus functional connectivity in the DPMS Network and Control Network with the brainstem regions removed.
Linear regression model (blue lines) comparison of the pre-stimulus functional connectivity (psFC) with the percentage change in BOLD activity in the (A) DPMS Network and (B) Control Network with the brainstem regions removed. The DPMS psFC was calculated between the AI, ACC, amygdala and middle frontal gyri, and the Control Network psFC was calculated in the bilateral calcarine cortices, caudate, hippocampus, recti gyri and the supplementary motor areas. Coloured circles represent data from individual infants within the DPMS Network (red) and Control Network (light blue) .
Figure 3—figure supplement 2.
Figure 3—figure supplement 2.. Example data from individual infants.
Data from an individual infant showing (A) the mean time series within all DPMS brain regions and (B) the resulting connectivity matrix. Black circles overlaid on the time series indicate pre-stimulus points. Vertical blue lines indicate the point of stimulation. The minimum inter-stimulus interval was 25 s. (C) Examples of statistical COPE values related to the magnitude of noxious-evoked brain activity and (D) the change in BOLD signal within a single voxel (red) plotted over the expected model fit (black). The statistical COPE map has been masked with the group activity mask (see Figure 2); therefore, coloured regions represent voxels that survive cluster thresholding at the group level. The baseline (light blue) is the temporal mean used to calculate percentage change in BOLD.

References

    1. Andrews K, Fitzgerald M. The cutaneous withdrawal reflex in human neonates: sensitization, receptive fields, and the effects of contralateral stimulation. Pain. 1994;56:95–101. doi: 10.1016/0304-3959(94)90154-6. - DOI - PubMed
    1. Arichi T, Fagiolo G, Varela M, Melendez-Calderon A, Allievi A, Merchant N, Tusor N, Counsell SJ, Burdet E, Beckmann CF, Edwards AD. Development of BOLD signal hemodynamic responses in the human brain. NeuroImage. 2012;63:663–673. doi: 10.1016/j.neuroimage.2012.06.054. - DOI - PMC - PubMed
    1. Baliki MN, Mansour AR, Baria AT, Apkarian AV. Functional reorganization of the default mode network across chronic pain conditions. PLoS ONE. 2014;9:e106133. doi: 10.1371/journal.pone.0106133. - DOI - PMC - PubMed
    1. Baumgärtner U, Iannetti GD, Zambreanu L, Stoeter P, Treede RD, Tracey I. Multiple somatotopic representations of heat and mechanical pain in the operculo-insular cortex: a high-resolution fMRI study. Journal of Neurophysiology. 2010;104:2863–2872. doi: 10.1152/jn.00253.2010. - DOI - PMC - PubMed
    1. Boly M, Balteau E, Schnakers C, Degueldre C, Moonen G, Luxen A, Phillips C, Peigneux P, Maquet P, Laureys S. Baseline brain activity fluctuations predict somatosensory perception in humans. PNAS. 2007;104:12187–12192. doi: 10.1073/pnas.0611404104. - DOI - PMC - PubMed

Publication types