. 2018 Sep 6;71(5):802-815.e7.
doi: 10.1016/j.molcel.2018.05.017. Epub 2018 Jun 28.

Lamins Organize the Global Three-Dimensional Genome from the Nuclear Periphery

Affiliations

Lamins Organize the Global Three-Dimensional Genome from the Nuclear Periphery

Xiaobin Zheng et al. Mol Cell. .

Abstract

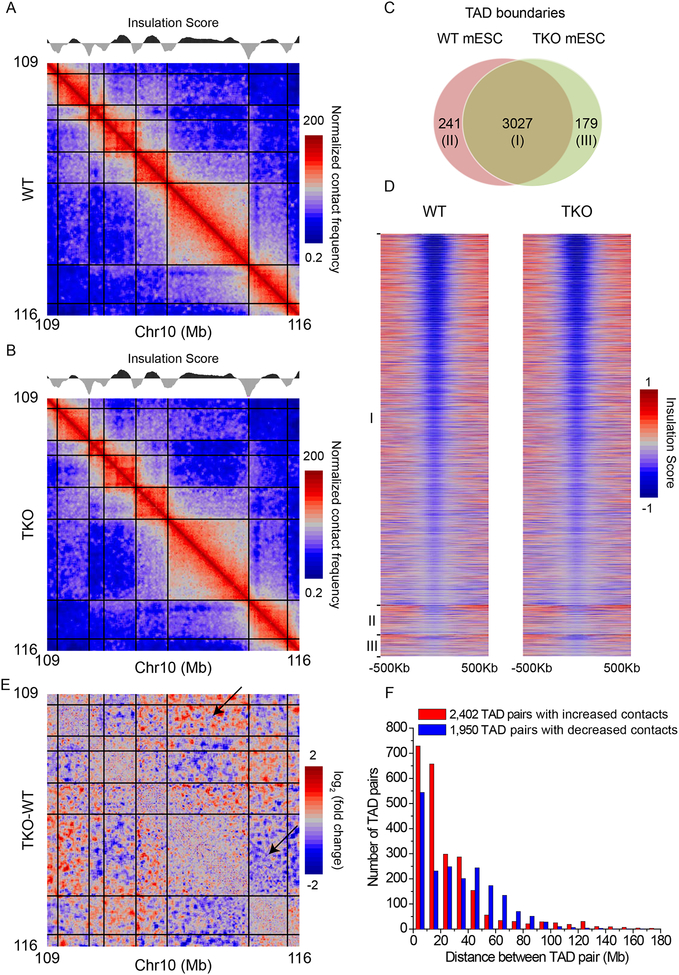
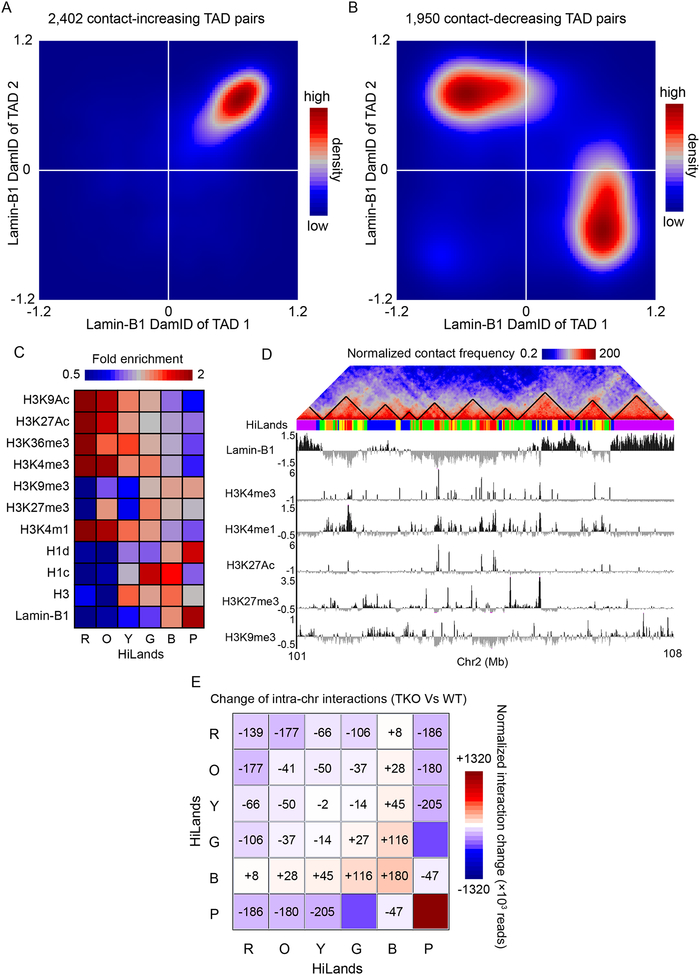
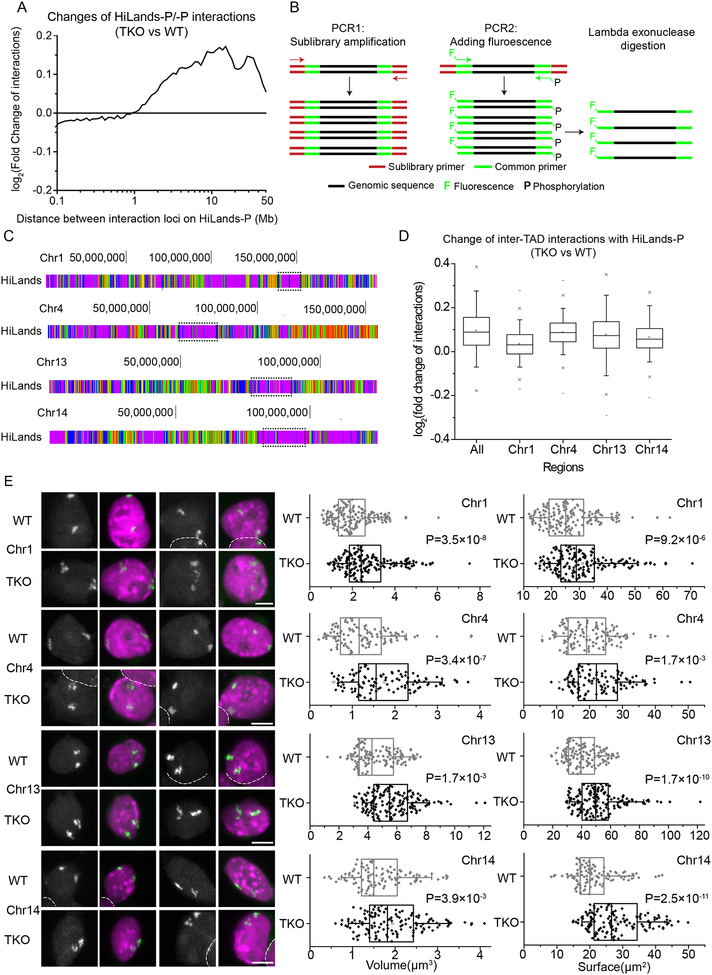
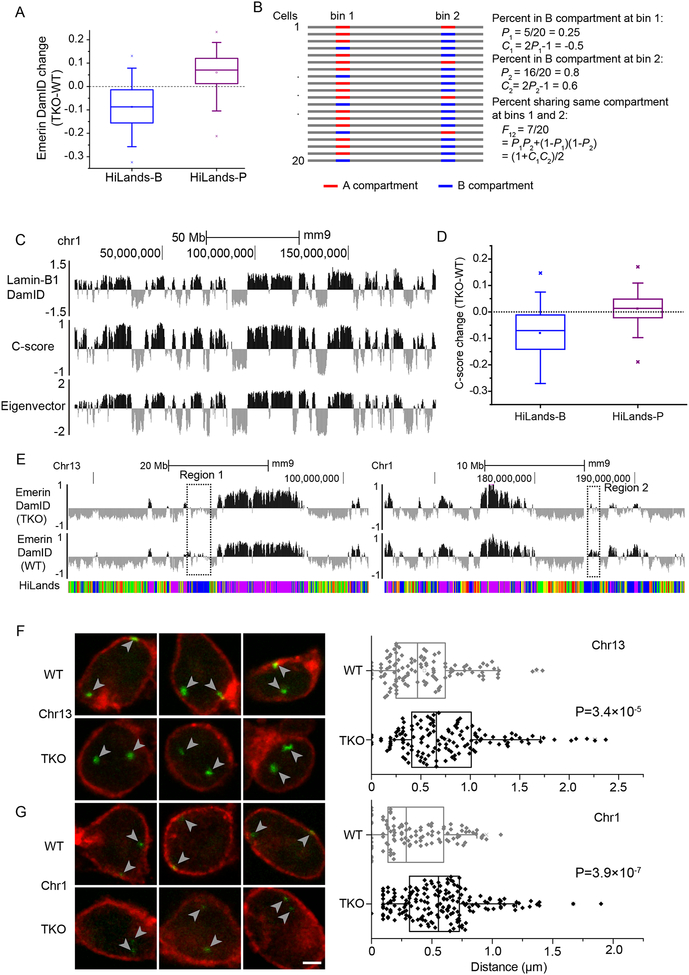
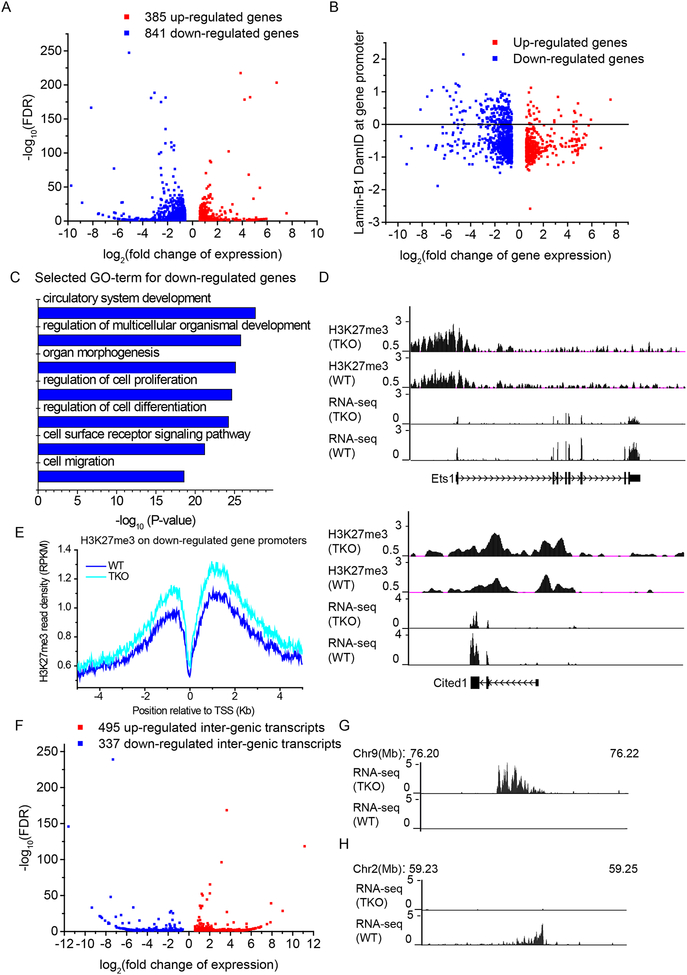
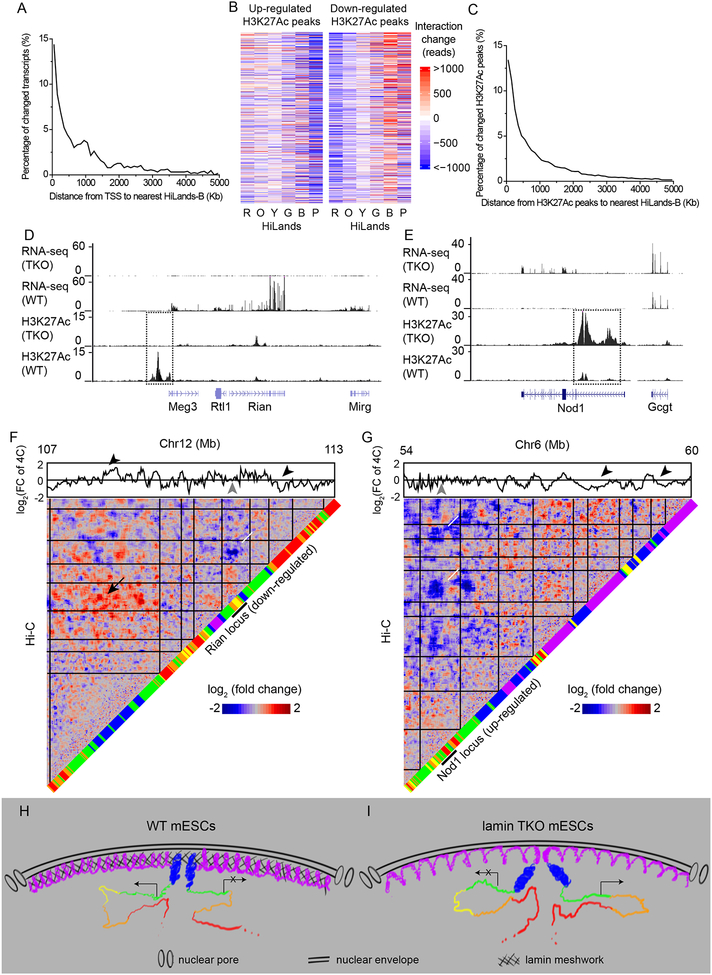
Lamins are structural components of the nuclear lamina (NL) that regulate genome organization and gene expression, but the mechanism remains unclear. Using Hi-C, we show that lamins maintain proper interactions among the topologically associated chromatin domains (TADs) but not their overall architecture. Combining Hi-C with fluorescence in situ hybridization (FISH) and analyses of lamina-associated domains (LADs), we reveal that lamin loss causes expansion or detachment of specific LADs in mouse ESCs. The detached LADs disrupt 3D interactions of both LADs and interior chromatin. 4C and epigenome analyses further demonstrate that lamins maintain the active and repressive chromatin domains among different TADs. By combining these studies with transcriptome analyses, we found a significant correlation between transcription changes and the interaction changes of active and inactive chromatin domains These findings provide a foundation to further study how the nuclear periphery impacts genome organization and transcription in development and NL-associated diseases.

Keywords: 3D genome; Hi-C; HiLands; LADs; TADs; histone and lamina landscape; lamin; lamina-associated chromatin domains; nuclear lamina; transcription.


Conflict of interest statement

Declaration of Interests

The authors declare no competing interests.

Figures

Figure 1.
Figure 1.. Effects of lamin deletion on TADs in mESCs
A-B. Dynamic-binned heatmaps showing the normalized contact frequencies and TAD structures in a representative region on chr10 in WT (A) and lamin TKO (B) mESCs at 20-Kb resolution. Each bin is expanded to contain a minimum of 20 reads. Normalized contact frequency is calculated using the Iterative Correction and Eigenvector decomposition (ICE) method. The total sequencing depth in TKO is normalized to the same sequencing depth as the WT. The plots of Insulation Score along the same region are shown above the heatmaps. Local minimum values of Insulation Score indicate TAD boundaries, which are delineated by black lines in the heatmaps. C. Venn diagram showing the TAD boundary overlap between WT and lamin TKO mESCs. D. Heatmaps showing the insulation scores in ±500 Kb around TAD boundaries at 20-Kb resolution. I, II, and III indicate the three groups of TAD boundaries shown in C in WT and TKO mESCs. E. Dynamic-binned heatmaps showing the log2 fold change of interactions between TADs in the same representative chromosome 10 region shown in A and B at 20 Kb resolution. Each bin is expanded to contain a minimum of 20 reads. Black lines delineate TAD boundaries. The black arrows indicate examples of TAD pairs showing increased or decreased interactions. F. Histogram showing the distributions of inter-TAD distances of TAD pairs exhibiting altered interactions upon lamin loss.
Figure 2.
Figure 2.. Lamins regulate global 3D genome interactions among chromatin domains with different features
A-B. Contour plots showing the number of TAD pairs having increased (A) or decreased (B) interactions upon lamin loss as a function of the lamin-B1 DamID values of the two TADs. C. Heatmap showing the enrichment of different histone modifications, histone H1 and H3, and lamin-B1 DamID reads on the six different HiLands in mESCs. H3, H1c, and H1d shown are fold enrichment normalized against input. Histone modifications shown are fold enrichment against H3. D. An example region on chromosome 2 showing Hi-C heatmap with TADs delineated by black lines, color coded HiLands, lamin-B1 DamID, and histone modifications. The Hi-C heatmap is dynamic-binned and normalized as in Figure 1. Histone modifications shown are log2 fold enrichment against H3. E. Heatmaps showing the normalized interaction change of total intra-chromosome interactions within each HiLands and between HiLands pairs upon lamin loss in mESC. The numbers of total intra-chromosome interactions in TKO were first normalized to the same as those in WT. Then the normalized numbers of total intra-chromosome interactions within and between HiLands in TKO were subtracted by the corresponding numbers of interactions in WT to get the changes. The numbers of increased (+) or decreased (−) interaction changes are shown.
Figure 3.
Figure 3.. Expansion of HiLands-P upon lamin loss
A. A plot of log2 fold increased or decreased total interactions between two HiLands-P regions upon lamin loss as a function of the distance between the regions. B. FISH probe production. PCR1 amplifies the probes for a specific sub-library using the indicated sub-library primers. PCR2 produces the labeled sub-library probes using the fluorescently labeled and phosphorylated common primers. Lambda exonuclease digests the phosphorylated DNA strand to produce the single stranded DNA probes for FISH. C. Four regions (dashed boxes) on Chromosome 1, 4, 13, and 14 consisting of mostly HiLands-P were selected for FISH. HiLands are shown in corresponding colors. D. Box plot showing the log2 fold change of inter-TAD interactions for 20-Kb windows in the whole genome (All) or in selected chromosome regions shown in C. Only HiLands-P interactions are included. E. Two representative 3D-projection FISH images for each of the four selected regions in C. Purple: DAPI staining for DNA. White: FISH signal. The white dashed lines demarcate the boundaries of nuclei that are next to one another. Scale bars, 5 μm. The volume and surface areas of the four chromatin regions are quantified to the right. P-values, Wilcoxon rank-sum test.
Figure 4.
Figure 4.. Lamin loss causes HiLands-B detachment from the NL
A. Box plot showing the changes of emerin-DamID values on HiLands-B and -P throughout the genome upon lamin loss in mESCs. B. Definition of C-score. P1 or P2 represents the percentage of cells in which genomic windows 1 or 2 (bin 1 or 2), respectively, is in the B compartment. C1 and C2 represent the C-scores of bins 1 and 2 and they have a linear relationship to P1 and P2, respectively. F12 is the percentage of cells with both bin 1 and 2 in the same compartment. C. Genome-browser views showing a good consistency of lamin-B1 DamID values, C-scores, and eigenvector values along chromosome 1 in WT mESCs. The eigenvector is calculated using the Homer software at 20-Kb resolution. For the C-score and eigenvector, positive and negative values indicate B and A compartment, respectively. D. Box plot showing the changes of C-scores in HiLands-B and -P throughout the genome upon lamin loss in mESCs. E. Genome browser views of emerin-DamID in WT and lamin-TKO mESCs on Chr 1 (right) and 13 (left). The dashed boxes highlight the regions 1 and 2 used for producing FISH probes, which correspond to the HiLands-B enriched chromatin with reduced emerin-DamID values upon lamin loss in mESCs. Grey arrowheads point to the FISH signals. F-G. Three sets of representative images of emerin immunostaining (red) and FISH (green) of region 1 (Chr13, F) and region 2 (Chr1, G) are shown to the left. Each image is a plane from a confocal stack. The shorter length of the region 2 compared to 1 resulted in weaker FISH signals seen in G. Scale bars, 2 m. Quantification of the distances from each FISH signal to the nuclear membrane (emerin) are shown to the right. P-values, Wilcoxon rank-sum test.
Figure 5.
Figure 5.. The effect of lamin loss on transcription in mESCs
A. Volcano plot of RNA-seq data showing the gene expression change and the statistical significance. Threshold of differential expression: fold change>1.5, FDR<0.05. B. Scatter plot showing a lack of enrichment of altered genes in LADs (based on lamin-B1 DamID in WT mESCs. P=0.9, hypergeometric test) upon lamin loss in mESCs. C. The top significant GO terms of the down-regulated genes upon lamin loss in mESCs. D. The genome browser views showing the H3K27me3 and RNA-seq tracks on two down-regulated genes upon lamin loss in mESCs that are required for development. E. Distribution of H3K27me3 reads within 5 Kb up- and down-stream of the down-regulated gene promoters. H3K27me3 showed a significant increase upon lamin loss on these promoters (P<2×10⁻¹⁶, Wilcoxon signed-rank test). F. Volcano plot of RNA-seq data showing the expression change of unannotated intergenic transcripts and the statistical significance. Threshold of differential expression, fold change>1.5, FDR<0.05. G-H. The genome browser views showing the up- (G) or down-regulated (H) non-genic transcripts upon lamin loss. Genomic positions of the loci in mm9 are shown at the top.
Figure 6.
Figure 6.. Effects of 3D chromatin interaction changes on transcription upon lamin loss
A. A plot showing the distance distribution of transcription start sites (TSS) of altered transcripts upon lamin loss to the border of the nearest HiLands-B. Only the TSS in HiLands-R, -O, -Y and -G are plotted. B. Heatmaps showing that H3K27Ac increased peaks have decreased interactions with HiLands-P (P<2×10⁻¹⁶, Wilcoxon signed-rank test), whereas H3K27Ac decreased peaks have decreased interaction with HiLands-R (P<2×10⁻¹⁶, Wilcoxon signed-rank test) and increased interaction with HiLands-B (P<2×10⁻¹⁶, Wilcoxon signed-rank test) in the 100-Kb genomic windows surrounding each peak upon lamin loss. C. A plot showing the distance distribution of the up- or down-regulated H3K27Ac peaks to the nearest HiLands-B upon lamin loss in mESCs. D-E. The down- (D) and up-regulated (E) expressions at Rian and Nod1 loci upon lamin loss (top two tracks), which correlate with the changes of enhancer activities (marked by dashed boxes) as indicated by the H3K27Ac (bottom two tracks). F-G. 3D genome interaction changes around the Rian (F) and Nod1 (G) loci. The heatmaps show the change of Hi-C interactions using the same setting as in Figure 1E with the black lines marking TADs. HiLands are shown along the diagonal with the loci indicated by the short black lines. Change of 4C interactions are shown above the heatmaps (grey arrowheads indicate the 4C baits). The white and black arrows in F indicate the decreased and increased interactions of the Rian locus with Hilands-R and HiLands-B, respectively, in different TADs. The white arrows in G indicate the decreased interactions of the Nod1 locus with HiLands-B and -P in different TADs. The black arrowheads indicate the corresponding regions showing increased or decreased interactions with the bait region. The Hi-C and 4C interaction changes show significant linear correlation: Rian, P<2×10⁻¹⁶; Nod1, P=5×10⁻¹³, t-test. H-I. A lamin meshwork-cage model. Loss of the lamin meshwork in the WT mESC nucleus (H) leads to the expansion of HiLands-P, which dislodges HiLands-B from the NL in lamin TKO mESCs (I). The detachment of HiLands-B in turn disrupts the active and inactive chromatin neighborhoods, thereby leading to global transcriptional changes. The six HiLands are color coded. The expression and repression of genes are indicated.

Similar articles

Cited by

References

    1. Amendola M, and van Steensel B (2015). Nuclear lamins are not required for lamina-associated domain organization in mouse embryonic stem cells. EMBO Rep. 16, 610–617. - PMC - PubMed
    1. Anders S, Pyl PT, and Huber W (2015). HTSeq--a Python framework to work with high-throughput sequencing data. Bioinformatics 31, 166–169. - PMC - PubMed
    1. Barton LJ, Lovander KE, Pinto BS, and Geyer PK (2016). Drosophila male and female germline stem cell niches require the nuclear lamina protein Otefin. Dev. Biol 415, 75–86. - PMC - PubMed
    1. Beliveau BJ, Joyce EF, Apostolopoulos N, Yilmaz F, Fonseka CY, McCole RB, Chang Y, Li JB, Senaratne TN, Williams BR, et al. (2012). Versatile design and synthesis platform for visualizing genomes with Oligopaint FISH probes. Proc. Natl. Acad. Sci. U. S. A 109, 21301–21306. - PMC - PubMed
    1. Boettiger AN, Bintu B, Moffitt JR, Wang S, Beliveau BJ, Fudenberg G, Imakaev M, Mirny LA, Wu CT, and Zhuang X (2016). Super-resolution imaging reveals distinct chromatin folding for different epigenetic states. Nature 529, 418–422. - PMC - PubMed

Publication types

LinkOut - more resources