

Simultaneous Passive Acoustic Mapping and Magnetic Resonance Thermometry for Monitoring of Cavitation-Enhanced Tumor Ablation in Rabbits Using Focused Ultrasound and Phase-Shift Nanoemulsions
- PMID: 30201425
- PMCID: PMC6215518
- DOI: 10.1016/j.ultrasmedbio.2018.07.023
Simultaneous Passive Acoustic Mapping and Magnetic Resonance Thermometry for Monitoring of Cavitation-Enhanced Tumor Ablation in Rabbits Using Focused Ultrasound and Phase-Shift Nanoemulsions
Abstract
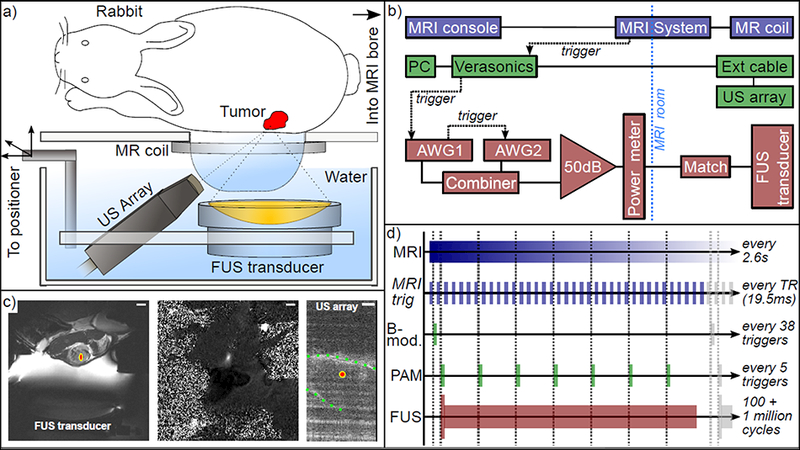
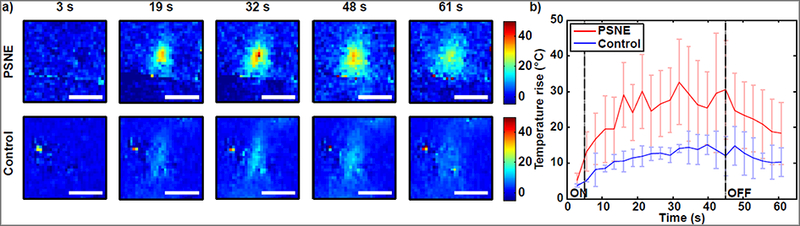
Thermal ablation of solid tumors via focused ultrasound (FUS) is a non-invasive image-guided alternative to conventional surgical resection. However, the usefulness of the technique is limited in vascularized organs because of convection of heat, resulting in long sonication times and unpredictable thermal lesion formation. Acoustic cavitation has been found to enhance heating but requires use of exogenous nuclei and sufficient acoustic monitoring. In this study, we employed phase-shift nanoemulsions (PSNEs) to promote cavitation and incorporated passive acoustic mapping (PAM) alongside conventional magnetic resonance imaging (MRI) thermometry within the bore of a clinical MRI scanner. Simultaneous PAM and MRI thermometry were performed in an in vivo rabbit tumor model, with and without PSNE to promote cavitation. Vaporization and cavitation of the nanoemulsion could be detected using PAM, which led to accelerated heating, monitored with MRI thermometry. The maximum heating assessed from MRI was well correlated with the integrated acoustic emissions, illustrating cavitation-enhanced heating. Examination of tissue revealed thermal lesions that were larger in the presence of PSNE, in agreement with the thermometry data. Using fixed exposure conditions over 94 sonications in multiple animals revealed an increase in the mean amplitude of acoustic emissions and resulting temperature rise, but with significant variability between sonications, further illustrating the need for real-time monitoring. The results indicate the utility of combined PAM and MRI for monitoring of tumor ablation and provide further evidence for the ability of PSNEs to promote cavitation-enhanced lesioning.
Keywords: Cavitation; Focused ultrasound; Magnetic resonance imaging; Passive acoustic mapping; Phase-shift nanoemulsion; Rabbit; Thermal ablation; Tumor ablation; VX2.
Copyright © 2018 World Federation for Ultrasound in Medicine 8 Biology. Published by Elsevier Inc. All rights reserved.
Figures


Similar articles
-
Combined passive acoustic mapping and magnetic resonance thermometry for monitoring phase-shift nanoemulsion enhanced focused ultrasound therapy.Phys Med Biol. 2017 Jul 13;62(15):6144-6163. doi: 10.1088/1361-6560/aa77df. Phys Med Biol. 2017. PMID: 28590938 Free PMC article.
-
Cavitation-enhanced MR-guided focused ultrasound ablation of rabbit tumors in vivo using phase shift nanoemulsions.Phys Med Biol. 2014 Jul 7;59(13):3465-81. doi: 10.1088/0031-9155/59/13/3465. Epub 2014 Jun 5. Phys Med Biol. 2014. PMID: 24899634 Free PMC article.
-
Magnetic resonance imaging for the exploitation of bubble-enhanced heating by high-intensity focused ultrasound: a feasibility study in ex vivo liver.Ultrasound Med Biol. 2014 May;40(5):956-64. doi: 10.1016/j.ultrasmedbio.2013.11.019. Epub 2014 Jan 22. Ultrasound Med Biol. 2014. PMID: 24462160
-
MR techniques for guiding high-intensity focused ultrasound (HIFU) treatments.J Magn Reson Imaging. 2018 Feb;47(2):316-331. doi: 10.1002/jmri.25770. Epub 2017 Jun 5. J Magn Reson Imaging. 2018. PMID: 28580706 Review.
-
Noninvasive Thermometry in High-Intensity Focused Ultrasound Ablation.Ultrasound Q. 2017 Dec;33(4):253-260. doi: 10.1097/RUQ.0000000000000300. Ultrasound Q. 2017. PMID: 28549003 Review.
Cited by
-
Comprehensive review on ultrasound-responsive theranostic nanomaterials: mechanisms, structures and medical applications.Beilstein J Nanotechnol. 2021 Aug 11;12:808-862. doi: 10.3762/bjnano.12.64. eCollection 2021. Beilstein J Nanotechnol. 2021. PMID: 34476167 Free PMC article. Review.
-
Contactless Thermometry by MRI and MRS: Advanced Methods for Thermotherapy and Biomaterials.iScience. 2020 Oct 23;23(10):101561. doi: 10.1016/j.isci.2020.101561. Epub 2020 Sep 14. iScience. 2020. PMID: 32954229 Free PMC article. Review.
-
Diffuse Midline Gliomas: Challenges and New Strategies in a Changing Clinical Landscape.Cancers (Basel). 2024 Jan 2;16(1):219. doi: 10.3390/cancers16010219. Cancers (Basel). 2024. PMID: 38201646 Free PMC article. Review.
-
Time-Resolved Passive Cavitation Mapping Using the Transient Angular Spectrum Approach.IEEE Trans Ultrason Ferroelectr Freq Control. 2021 Jul;68(7):2361-2369. doi: 10.1109/TUFFC.2021.3062357. Epub 2021 Jun 29. IEEE Trans Ultrason Ferroelectr Freq Control. 2021. PMID: 33635787 Free PMC article.
References
-
- Chen W-S, Brayman AA, Matula TJ, Crum LA, Miller MW. The pulse length-dependence of inertial cavitation dose and hemolysis. Ultrasound Med Biol 2003;29:739–48. - PubMed
Publication types
MeSH terms
Grants and funding
LinkOut - more resources
Full Text Sources
Other Literature Sources
Medical
Miscellaneous
