. 2018 Oct 1;145(19):dev162644.
doi: 10.1242/dev.162644.

Regulation of energy metabolism during early mammalian development: TEAD4 controls mitochondrial transcription

Affiliations

Regulation of energy metabolism during early mammalian development: TEAD4 controls mitochondrial transcription

Ram P Kumar et al. Development. .

Abstract

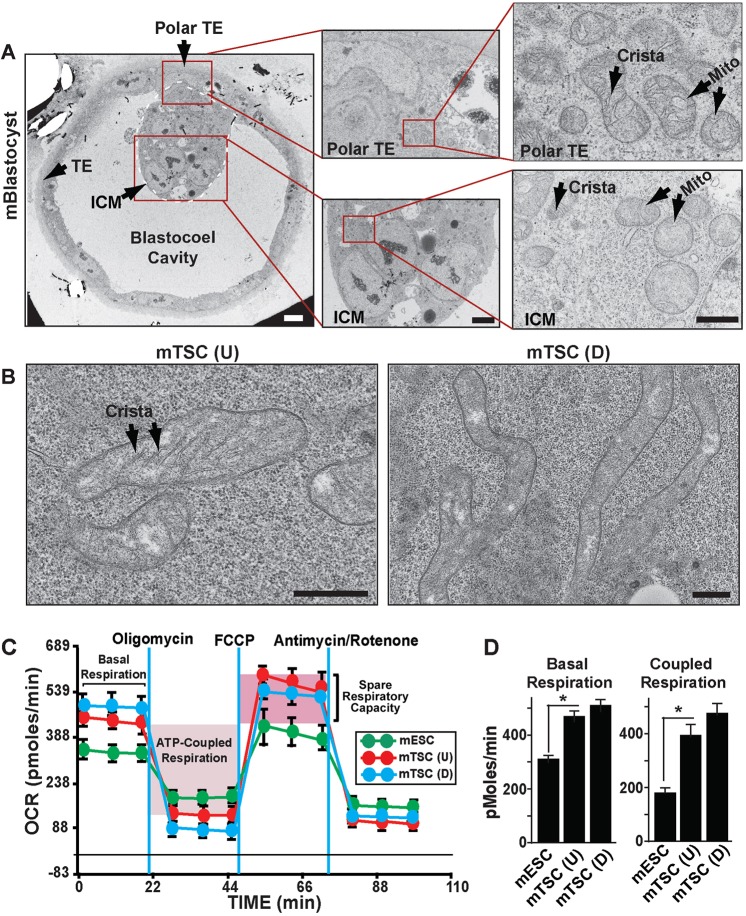
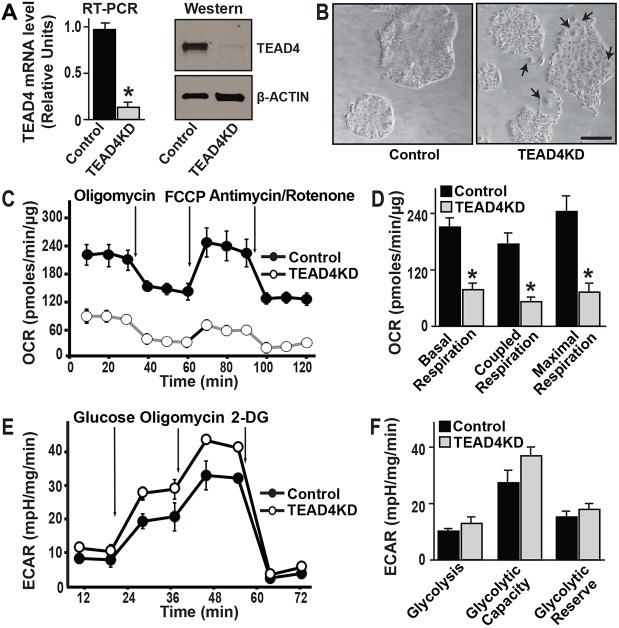
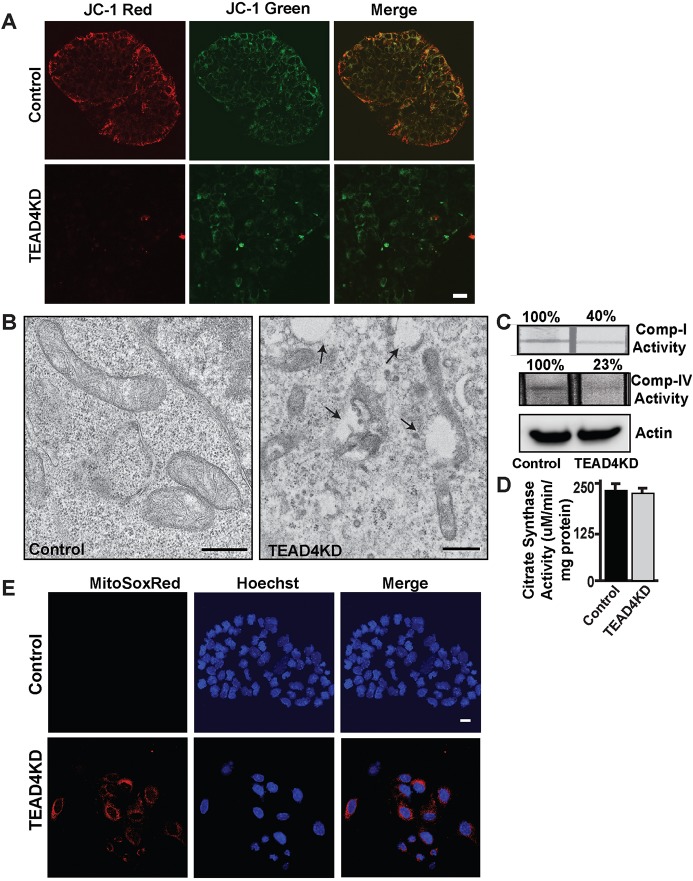
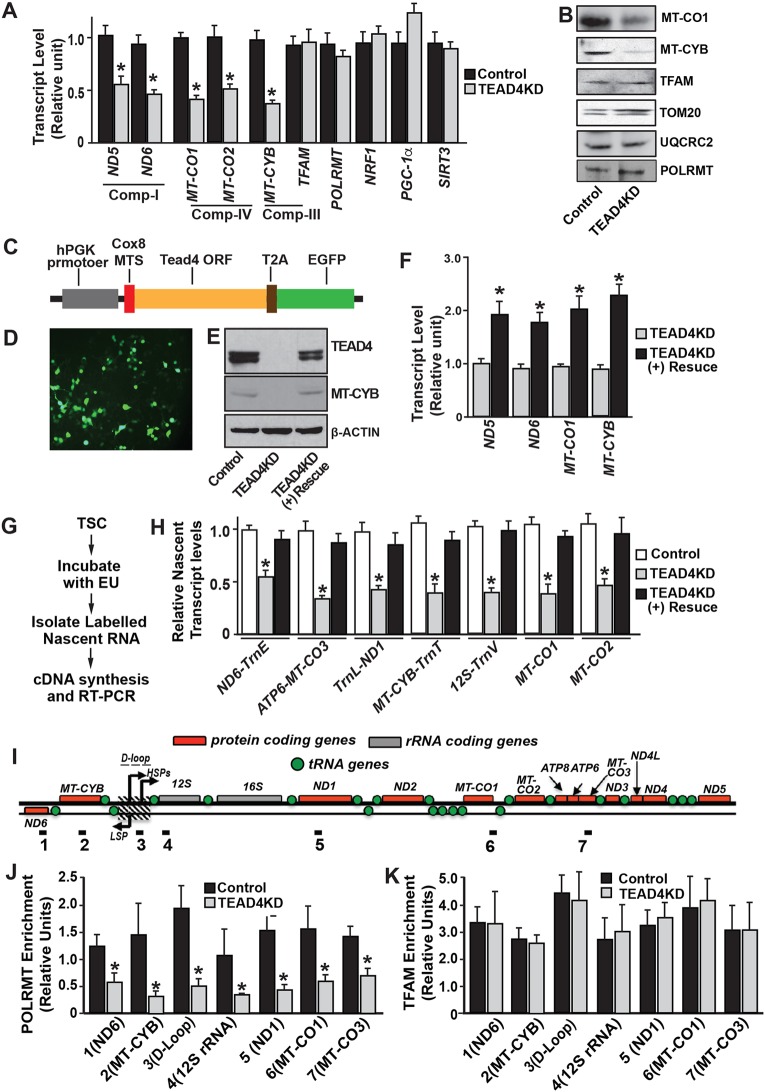
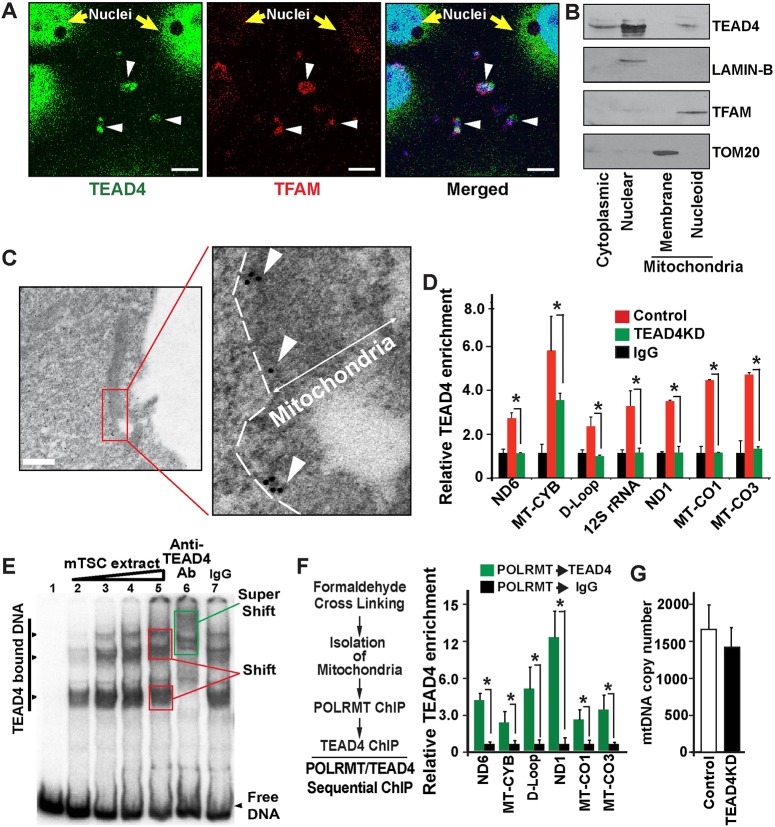
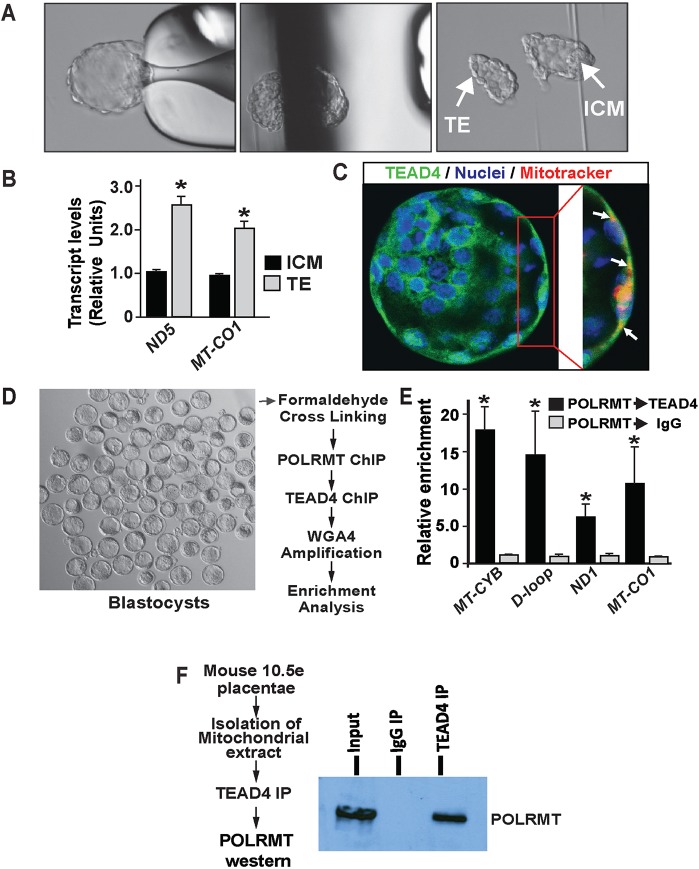
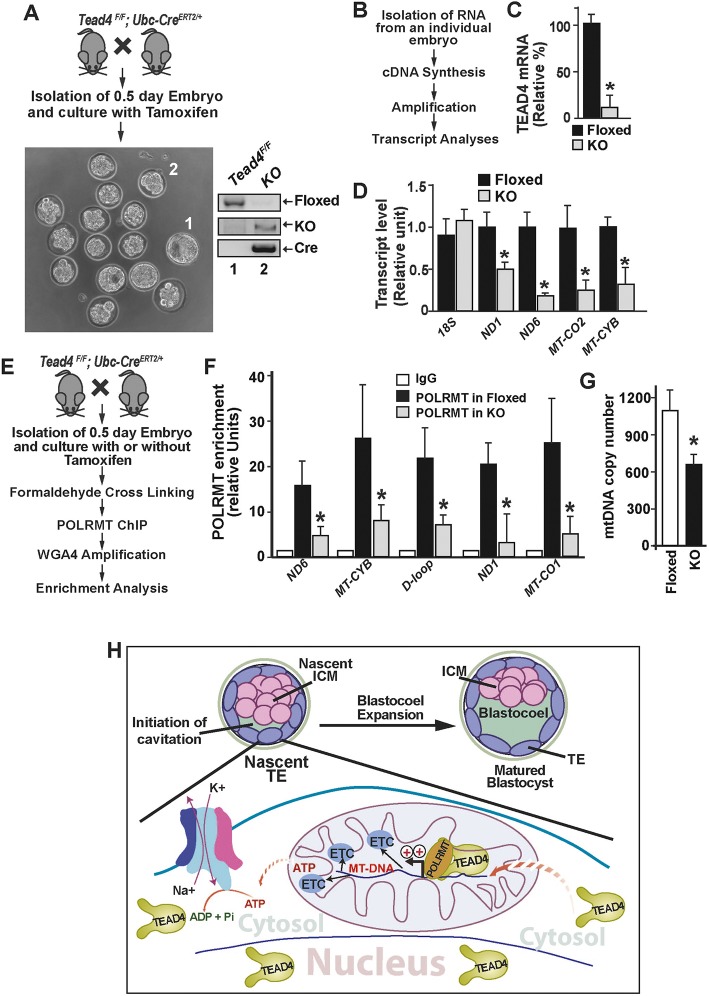
Early mammalian development is crucially dependent on the establishment of oxidative energy metabolism within the trophectoderm (TE) lineage. Unlike the inner cell mass, TE cells enhance ATP production via mitochondrial oxidative phosphorylation (OXPHOS) and this metabolic preference is essential for blastocyst maturation. However, molecular mechanisms that regulate establishment of oxidative energy metabolism in TE cells are incompletely understood. Here, we show that conserved transcription factor TEAD4, which is essential for pre-implantation mammalian development, regulates this process by promoting mitochondrial transcription. In developing mouse TE and TE-derived trophoblast stem cells (TSCs), TEAD4 localizes to mitochondria, binds to mitochondrial DNA (mtDNA) and facilitates its transcription by recruiting mitochondrial RNA polymerase (POLRMT). Loss of TEAD4 impairs recruitment of POLRMT, resulting in reduced expression of mtDNA-encoded electron transport chain components, thereby inhibiting oxidative energy metabolism. Our studies identify a novel TEAD4-dependent molecular mechanism that regulates energy metabolism in the TE lineage to ensure mammalian development.

Keywords: Electron Transport Chain; Mammalian development; Mitochondrial transcription; POLRMT; TEAD4; Trophoblast stem cell.


Conflict of interest statement

Competing interestsThe authors declare no competing or financial interests.

Figures

Fig. 1.
Fig. 1.
Trophectoderm (TE) and TE-derived TSCs contain mature mitochondria for oxidative energy metabolism. (A) Electron microscopy (EM) showing ultrastructural differences in mitochondria (Mito) between the ICM and TE in a mouse blastocyst. Scale bars: 10 µm. (B) EM showing mitochondria in undifferentiated [mTSC(U)] and differentiated [mTSC(D)] mouse TSCs. Scale bars: 500 nm. (C) Undifferentiated and differentiated mouse TSCs and mouse ESCs were subjected to a mitochondrial stress test by adding oligomycin, FCCP and AntimycinA/Rotenone at different time intervals, and changes in oxygen consumption rates (OCRs) were measured. Basal respiration, mitochondrial ATP synthesis-coupled respiration (light-pink shade) and spare respiratory capacity (deep-pink shade) are indicated. (D) Undifferentiated mouse TSCs maintain significantly (*P<0.001, three independent experiments) higher oxidative respiration compared with undifferentiated ESCs, and oxidative respiration does not significantly alter upon TSC differentiation. Data are mean±s.e.m.
Fig. 2.
Fig. 2.
TEAD4 is important for oxidative respiration in mouse TSC. (A) Quantitative RT-PCR and western blot analyses showing depletion of TEAD4 mRNA and protein expression in TSCs upon shRNA-mediated RNAi (TEAD4KD). (B) Micrographs of control and TEAD4-depleted TSC colonies (passage 2 after RNAi) in TSC culture conditions. The TEAD4KD TSCs are characterized with more visible cellular boundaries in cell colonies and the presence of higher numbers of differentiated trophoblast giant cells (TGCs, arrows), indicating propensity toward differentiation. Scale bar: 100 µm. (C) A mitochondrial stress test was performed to measure oxygen consumption rates (OCRs) in control and TEAD4KD TSCs. (D) Quantitative analyses of OCR in control versus TEAD4KD TSCs. Plots show strong reduction in oxidative respiration in TEAD4KD TSCs. (E) Control and TEAD4KD TSCs were subjected to a glycolysis stress test by adding glucose, oligomycin and 2-deoxy glucose (2-DG) at different time intervals and changes in the extracellular acidification rate (ECAR) were measured. The graphs show representative ECAR profiles. (F) Plots show only modest changes in glycolysis rate and maximal glycolytic capacity in TSCs upon TEAD4 depletion. *P<0.001. Data are mean±s.e.m.
Fig. 3.
Fig. 3.
Loss of TEAD4 results in impaired mitochondrial function in mouse TSCs. (A) Control and TEAD4KD TSCs were stained with a mitochondrial membrane potential probe, JC-1, and excited simultaneously for observing hypo-polarized membrane potential (monomeric form excited by 488 nm laser, green) and hyper-polarized membrane potential (J-aggregate form excited using the 568 nm argon-krypton laser, red). Scale bar: 20 µm. (B) TEM pictures showing mitochondrial ultrastructural differences in control and TEAD4KD TSCs. Micrographs show the presence of an increased number of vacuoles and mitochondrial structural abnormalities in TEAD4KD TSCs. Scale bars: 500 nm. (C,D) Activities of mitochondrial electron-transport chain (ETC) complex I, ETC complex IV, and actin and citrate synthase were measured in control and TEAD4KD TSCs. Data show reduced ETC complex I and IV activities in TEAD4KD TSCs without any significant change in citrate synthase activity. Data are mean±s.e.m. (E) Control and TEAD4KD TSCs were stained with the mitochondrial ROS indicator MitoSox Red (red) and Hoechst (blue) to monitor mitochondrial distribution of reactive oxygen species accumulation. Scale bar: 20 µm.
Fig. 4.
Fig. 4.
TEAD4 promotes mtDNA transcription and POLRMT recruitment. (A) RT-PCR analysis of mtDNA-encoded transcript in control and TEAD4KD TSCs (*P<0.01, three independent experiments). (B) Western blot analyses showing expressions of mtDNA-encoded ETC complex members, MT-CO1 and MT-CYB, and nuclear DNA-encoded mitochondrial proteins, TFAM, TOM20 and UQCRC2, in control and TEAD4KD TSCs. (C) Schematic representation of the ectopic TEAD4-expressing lentiviral construct. A mitochondrial transport signal was added to the N-terminal end of the Tead4-coding sequence to ensure efficient mitochondrial localization of the ectopically expressed TEAD4 protein. A reporter EGFP was attached to the C-terminal end of Tead4 along with a self-cleaving T2A peptide. (D) Protein expression from the ectopic TEAD4-expressing construct in TEAD4KD mTSCs was monitored via EGFP expression. (E) Western blot analyses showing rescue of TEAD4 and MTCYB expression in TEAD4KD TSCs after transduction with ectopic TEAD4-expressing lentiviral construct. (F) RT-PCR analysis of mtDNA-encoded transcripts in TEAD4KD TSCs without and with the rescue of TEAD4 expression (*P<0.01, three independent experiments). (G) Schematic of the method for measurement of nascent mtDNA transcripts in TSCs. (H) Plots show reduction of nascent mtDNA transcripts in TEAD4KD TSCs (*P<0.01, three independent experiments) and rescue of nascent transcripts upon expression of ectopic TEAD4. Primers were designed to amplify polycistronic cDNA [e.g. ND6-TrnE, a primer pair amplifying NADH dehydrogenase subunit 6 and the adjacent transfer RNA (Glu) (tRNA)]. (I) Schematic diagram showing mtDNA-encoded genes and localization of primer pairs (1-7), which are used for the quantitative ChIP assay. (J,K) Quantitative ChIP assays in control and TEAD4KD TSCs were performed to determine POLRMT and TFAM occupancy at different regions of the mtDNA. Plots show a significant reduction in POLRMT occupancy (J) but maintenance of TFAM occupancy at different regions of mitochondrial genome upon TEAD4 depletion in mTSCs (*P<0.01, three independent experiments). Data are mean±s.e.m.
Fig. 5.
Fig. 5.
TEAD4 localizes to mitochondria and occupies mtDNA along with POLRMT. (A) Mouse TSCs were co-stained with TEAD4 (green) and TFAM (red). Confocal images show both TEAD4 and TFAM localization in mitochondria (arrowheads). Scale bars: 10 µm. TEAD4 also localizes at high levels in the nuclei, whereas TFAM localization in the nuclei is at a much reduced level. (B) Purified mitochondria from mTSCs were sub-fractionated and western blot analyses were performed to determine localizations of TEAD4 and other mitochondrial proteins. The cytoplasmic and nuclear fractions of mTSCs were used as controls. (C) Immuno-TEM showing TEAD4 within mitochondria (arrowheads). Dotted line shows the boundary of the mitochondrial membrane. Scale bar: 500 nm. (D) Quantitative ChIP analysis showing TEAD4 occupancy along mitochondrial genome (*P<0.001, three independent experiments). For simplicity, only one IgG is shown, although IgG was used for both control and TEAD4KD chromatin. (E) EMSA to test TEAD4 binding at TEA motifs of mtDNA. A ∼200 bp mtND1 fragment, containing TEA motifs, was incubated without (lane 1) or with (lanes 2-5) increasing amounts of mTSC extract. TEAD4-containing DNA-protein complexes were tested by monitoring mobility super shifts with anti-TEAD4 antibody (lane 6) or IgG (lane 7). (F) Sequential ChIP showing co-occupancy of TEAD4 and POLRMT in different mtDNA regions (*P<0.001, three independent experiments). (G) mtDNA copy numbers in mouse TSCs with or without TEAD4 depletion. Data are mean±s.e.m.
Fig. 6.
Fig. 6.
Endogenous TEAD4 localizes to mitochondria and occupies mtDNA within the TE lineage of a pre-implantation mammalian embryo. (A) Micrographs showing isolation of TE via microsurgery from a mouse blastocyst. (B) Plots show induction of mtDNA-encoded transcripts (ND5 and MT-CO1) in TE lineage cells during blastocyst development (*P<0.05, three independent experiments). (C) Mouse blastocyst stained with TEAD4 (green), mitotracker (red) and DAPI (blue). Higher magnification of the TE cell shows TEAD4 colocalization with mitotracker (arrows). (D-F) Quantitative assessment method for TEAD4 and POLRMT co-occupancy at mtDNA-encoded genes within mouse blastocysts. (D) Method for sequential ChIP-WGA with mouse blastocysts to test TEAD4-POLRMT co-occupancy at mtDNA. (E) Induction of mtDNA-encoded transcripts (ND5 and MT-CO1) in TE lineage cells during blastocyst (*P<0.01, three independent experiments). (F) Western blot showing co-IP between TEAD4 and POLRMT in trophoblast progenitor/stem cells isolated from mouse placenta (E10.5). Data are mean±s.e.m.
Fig. 7.
Fig. 7.
TEAD4 directly regulates POLRMT recruitment to promote mtDNA transcription during pre-implantation mammalian development. (A) Conditional deletion of Tead4 in pre-implantation mouse embryos. Loss of Tead4 expression abrogated blastocyst maturation in ex vivo culture conditions. Deletion of Tead4 alleles was confirmed by genotyping. (B) Strategy for quantitative RT-PCR analyses in Tead4-deleted embryos. (C) RT-PCR analyses showing loss of Tead4 mRNA expression upon Cre-mediated excision of Tead4F/F alleles (*P<0.001, ten individual embryos). (D) Loss of mtDNA-encoded transcripts in Tead4-deleted pre-implantation embryos (*P<0.01, ten individual embryos). (E) Schematic of POLRMT recruitment analysis in pre-implantation embryos. (F) Significant reduction in POLRMT recruitment at mtDNA-encoded genes in Tead4-deleted embryos (*P<0.001, three individual experiments with up to 25 embryos in each experiment). Data are mean±s.e.m. (G) Reduced mtDNA copy numbers in Tead4-deleted pre-implantation embryos (*P<0.01, 12 individual embryos). (H) Model illustrating the significance of mitochondrial TEAD4. In nascent TE cells of an early blastula, TEAD4 promotes expression of mtDNA-encoded ETC components by facilitating POLRMT recruitment. This promotes oxidative phosphorylation and ATP synthesis. The induced ATP production facilitates cellular processes, including the activity of the Na+, K+-ATPase pump, thereby ensuring blastocyst maturation.

Similar articles

Cited by

References

    1. Alarcon V. B. (2010). Cell polarity regulator PARD6B is essential for trophectoderm formation in the preimplantation mouse embryo. Biol. Reprod. 83, 347-358. 10.1095/biolreprod.110.084400 - DOI - PMC - PubMed
    1. Bogenhagen D. F. (2012). Mitochondrial DNA nucleoid structure. Biochim. Biophys. Acta 1819, 914-920. 10.1016/j.bbagrm.2011.11.005 - DOI - PubMed
    1. Bürglin T. R. (1991). The TEA domain: a novel, highly conserved DNA-binding motif. Cell 66, 11-12. 10.1016/0092-8674(91)90132-I - DOI - PubMed
    1. Carbognin E., Betto R. M., Soriano M. E., Smith A. G. and Martello G. (2016). Stat3 promotes mitochondrial transcription and oxidative respiration during maintenance and induction of naive pluripotency. EMBO J. 35, 618-634. 10.15252/embj.201592629 - DOI - PMC - PubMed
    1. Chen H., Detmer S. A., Ewald A. J., Griffin E. E., Fraser S. E. and Chan D. C. (2003). Mitofusins Mfn1 and Mfn2 coordinately regulate mitochondrial fusion and are essential for embryonic development. J. Cell Biol. 160, 189-200. 10.1083/jcb.200211046 - DOI - PMC - PubMed

Publication types

MeSH terms

LinkOut - more resources