. 2018 Sep 25;115(39):9726-9731.
doi: 10.1073/pnas.1806447115. Epub 2018 Sep 10.

Improving nanopore read accuracy with the R2C2 method enables the sequencing of highly multiplexed full-length single-cell cDNA

Affiliations

Improving nanopore read accuracy with the R2C2 method enables the sequencing of highly multiplexed full-length single-cell cDNA

Roger Volden et al. Proc Natl Acad Sci U S A. .

Abstract

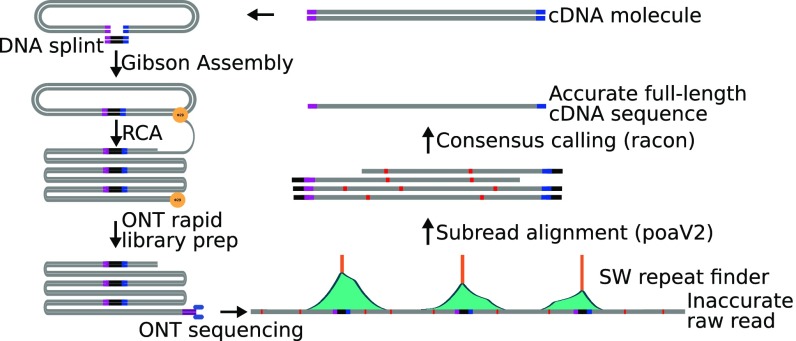
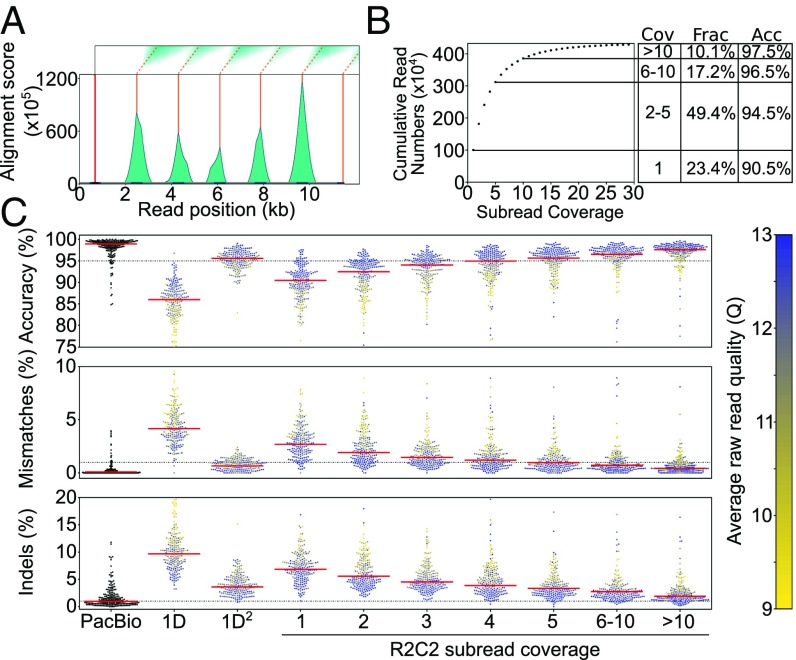
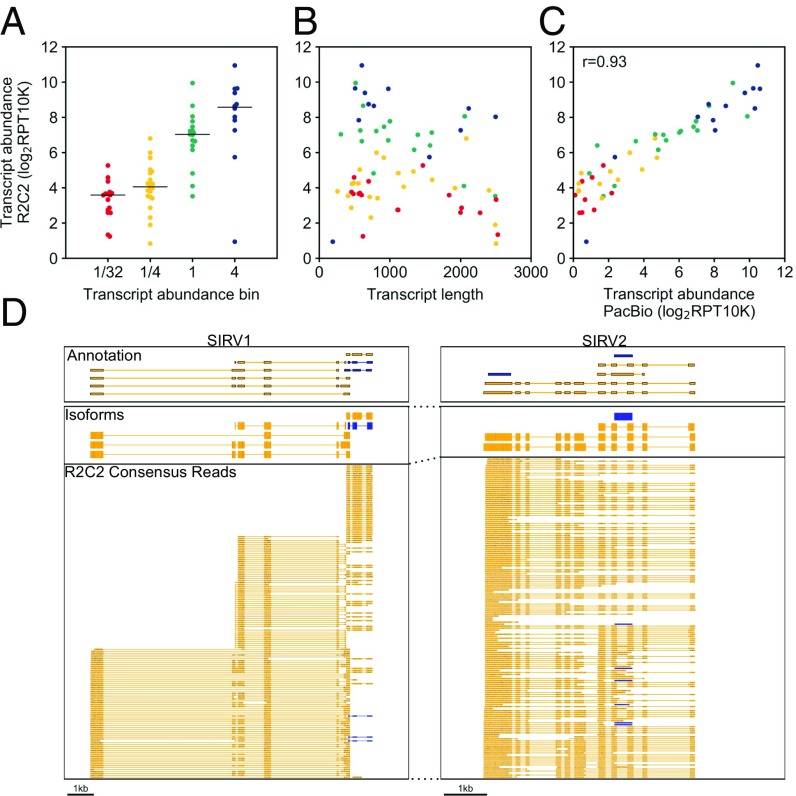
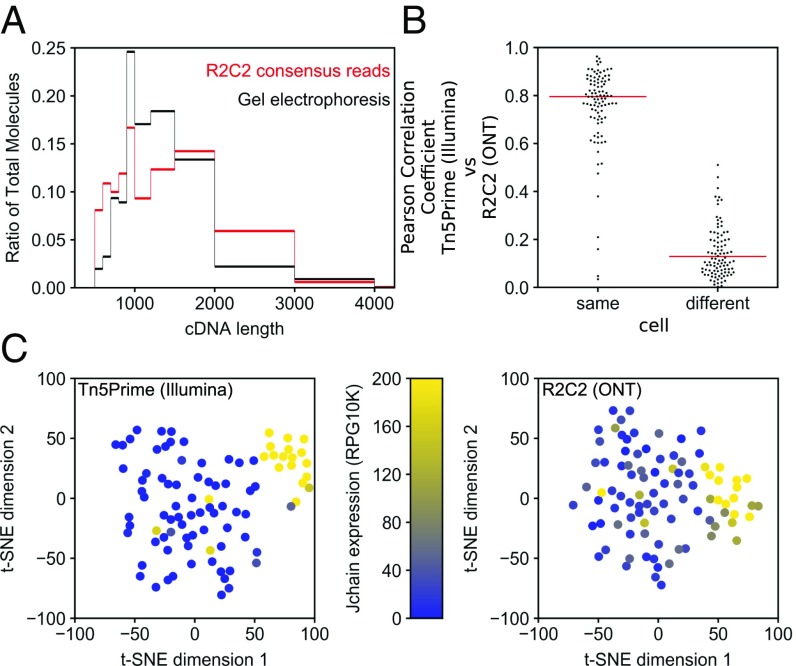
High-throughput short-read sequencing has revolutionized how transcriptomes are quantified and annotated. However, while Illumina short-read sequencers can be used to analyze entire transcriptomes down to the level of individual splicing events with great accuracy, they fall short of analyzing how these individual events are combined into complete RNA transcript isoforms. Because of this shortfall, long-distance information is required to complement short-read sequencing to analyze transcriptomes on the level of full-length RNA transcript isoforms. While long-read sequencing technology can provide this long-distance information, there are issues with both Pacific Biosciences (PacBio) and Oxford Nanopore Technologies (ONT) long-read sequencing technologies that prevent their widespread adoption. Briefly, PacBio sequencers produce low numbers of reads with high accuracy, while ONT sequencers produce higher numbers of reads with lower accuracy. Here, we introduce and validate a long-read ONT-based sequencing method. At the same cost, our Rolling Circle Amplification to Concatemeric Consensus (R2C2) method generates more accurate reads of full-length RNA transcript isoforms than any other available long-read sequencing method. These reads can then be used to generate isoform-level transcriptomes for both genome annotation and differential expression analysis in bulk or single-cell samples.

Keywords: B cells; full-length cDNA sequencing; isoforms; nanopore sequencing; single-cell transcriptomics.


Conflict of interest statement

Conflict of interest statement: C.V., R.E.G., T.P., and R.V. have filed a provisional patent on the methodology described in the paper. The other authors have nothing to declare.

Figures

Fig. 1.
Fig. 1.
R2C2 method overview. cDNA is circularized using Gibson Assembly, amplified using RCA, and sequenced using the ONT MinION. The resulting raw reads are split into subreads containing full-length or partial cDNA sequences, which are combined into an accurate consensus sequence using our C3POa workflow, which relies on a custom algorithm to detect DNA splints as well as poaV2 and racon.
Fig. 2.
Fig. 2.
Raw reads are processed into consensus reads of varying subread coverage. (A) Example of an 11.5-kb raw ONT read that was analyzed by our custom Smith–Waterman repeat finder. One initial splint (red line) is identified using the BLAT aligner, and then modified Smith–Waterman self-to-self alignments are performed starting from the location of the initial splint. The score matrices (Top) are then processed to generate alignment score histograms (teal). We then call peaks (orange) on these histograms. Complete subreads are then defined as the sequences between two peaks. (B) Cumulative number of SIRV E2 R2C2 consensus reads is plotted against their subread coverage. To the Right, coverage (Cov), fraction of all consensus reads (Frac), and accuracy (Acc) are given for four read bins. (C) PacBio Isoseq, standard ONT 1D, and 1D2 are compared with R2C2 at different subread coverages. Read accuracy is determined by minimap2 alignments to SIRV transcripts (see Methods). Median accuracy is shown as a red line. Accuracy distribution is shown as a swarm plot of 250 randomly subsampled reads. Average raw read quality of ONT reads is indicated by the color of the individual points.
Fig. 3.
Fig. 3.
R2C2 reads can quantify SIRV transcripts. R2C2 reads were aligned to SIRV transcripts using minimap2, and expression values’ transcript abundance was determined as Reads Per Transcript Per 10,000 reads (RPT10K). The transcript count ratio was plotted on the y axis against the (A) nominal transcript abundance bin reported by the SIRV transcript manufacturer (Lexogen), (B) transcript length, and (C) transcript count ratio calculated from PacBio Isoseq reads. Pearson correlation coefficient (r) is reported in C. Each point represents a transcript and is colored according to its transcript abundance bin in all panels. (D) Genome browser view of Transcriptome annotation, isoforms identified by Mandalorion, and R2C2 consensus reads is shown of the indicated synthetic SIRV gene loci. Transcript and read direction are shown by colors (blue: +strand; yellow, −strand).
Fig. 4.
Fig. 4.
R2C2 length bias and gene expression quantification. (A) B cell cDNA molecule length distribution as determined by electrophoresis on 2% agarose gel is compared with R2C2 consensus read length distribution. (B) Pearson correlation coefficient (r) is shown for R2C2 and Illumina-based gene expression quantification of the same or different cells. Red lines indicate medians. All 96 correlation coefficients from same cell comparisons and 96 subsampled correlation coefficients from different cell comparisons are shown as a swarm plot to display their distributions. (C) t-SNE dimensional reduction plots of the same 96 B cells whose transcriptomes were quantified with either the Tn5Prime Illumina-based method or the R2C2 ONT-based method. Cells are colored based on the J chain expression, which is strongly associated with plasmablast cell identity.
Fig. 5.
Fig. 5.
R2C2 reads identify isoforms in B cell surface receptor genes. (AC) Genome browser views of Transcriptome annotation, isoforms (Iso) identified by Mandalorion, and R2C2 consensus reads (Reads) (C only, downsampled to 20 reads) are shown for CD79B (A), CD37 (B), and CD19 (C) gene loci. Transcript and read direction is shown by colors (blue, +strand; yellow, −strand). Cell IDs are indicated by combinations of A and TSO (T) indexes. (C) CD19 exon numbers are indicated on the transcript annotation in white.

Comment in

  • Improving long-read accuracy.
    Tang L. Tang L. Nat Methods. 2018 Nov;15(11):860. doi: 10.1038/s41592-018-0204-y. Nat Methods. 2018. PMID: 30377358 No abstract available.

Similar articles

Cited by

References

    1. Mortazavi A, Williams BA, McCue K, Schaeffer L, Wold B. Mapping and quantifying mammalian transcriptomes by RNA-seq. Nat Methods. 2008;5:621–628. - PubMed
    1. Tilgner H, et al. Comprehensive transcriptome analysis using synthetic long-read sequencing reveals molecular co-association of distant splicing events. Nat Biotechnol. 2015;33:736–742. - PMC - PubMed
    1. Tilgner H, et al. Microfluidic isoform sequencing shows widespread splicing coordination in the human transcriptome. Genome Res. 2017;28:231–242. - PMC - PubMed
    1. Sharon D, Tilgner H, Grubert F, Snyder M. A single-molecule long-read survey of the human transcriptome. Nat Biotechnol. 2013;31:1009–1014. - PMC - PubMed
    1. Shi L, et al. Long-read sequencing and de novo assembly of a Chinese genome. Nat Commun. 2016;7:12065. - PMC - PubMed

Publication types

MeSH terms