

Partial maintenance of organ-specific epigenetic marks during plant asexual reproduction leads to heritable phenotypic variation
- PMID: 30201727
- PMCID: PMC6166847
- DOI: 10.1073/pnas.1805371115
Partial maintenance of organ-specific epigenetic marks during plant asexual reproduction leads to heritable phenotypic variation
Abstract
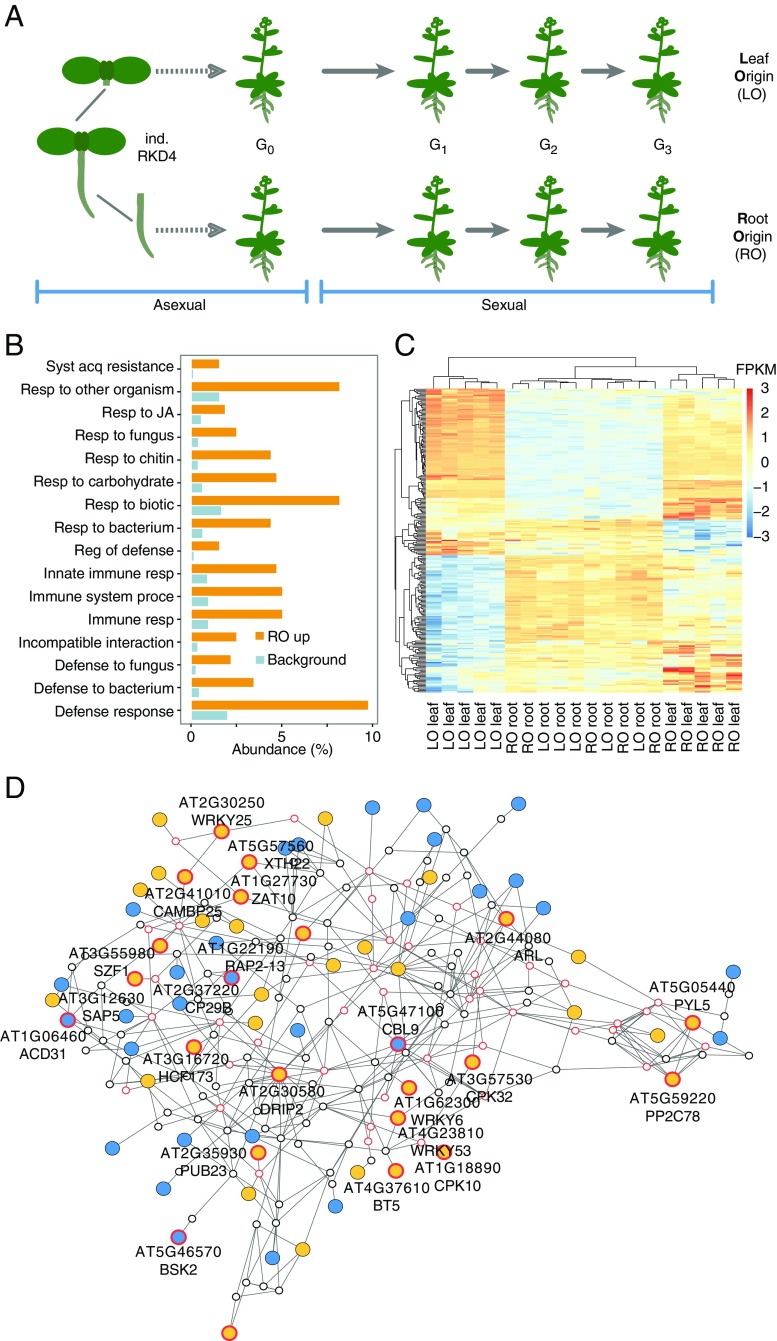
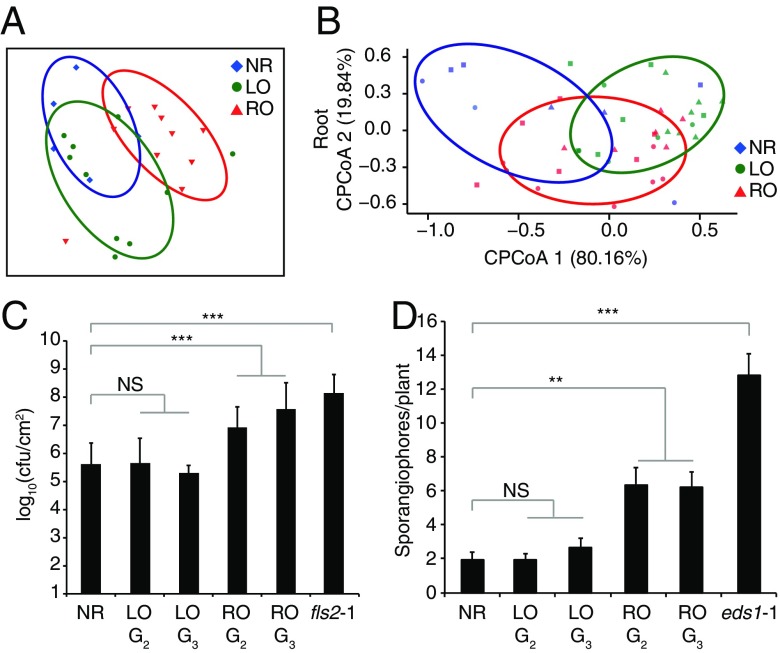
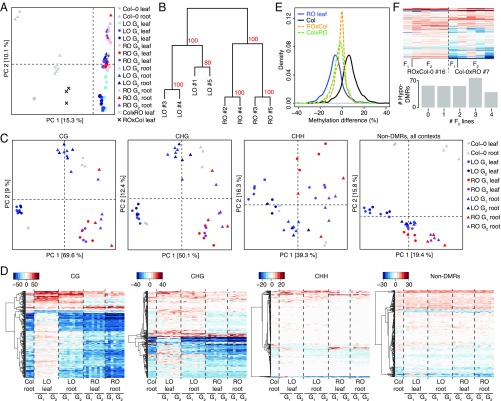
Plants differ from animals in their capability to easily regenerate fertile adult individuals from terminally differentiated cells. This unique developmental plasticity is commonly observed in nature, where many species can reproduce asexually through the ectopic initiation of organogenic or embryogenic developmental programs. While organ-specific epigenetic marks are not passed on during sexual reproduction, the fate of epigenetic marks during asexual reproduction and the implications for clonal progeny remain unclear. Here we report that organ-specific epigenetic imprints in Arabidopsis thaliana can be partially maintained during asexual propagation from somatic cells in which a zygotic program is artificially induced. The altered marks are inherited even over multiple rounds of sexual reproduction, becoming fixed in hybrids and resulting in heritable molecular and physiological phenotypes that depend on the identity of the founder tissue. Consequently, clonal plants display distinct interactions with beneficial and pathogenic microorganisms. Our results demonstrate how novel phenotypic variation in plants can be unlocked through altered inheritance of epigenetic marks upon asexual propagation.
Keywords: Arabidopsis thaliana; DNA methylation; asexual reproduction; epigenetics; transgenerational inheritance.
Copyright © 2018 the Author(s). Published by PNAS.
Conflict of interest statement
A.W., C.B., D.W., and J.G.-M. are inventors on patent application “Stable epigenetic plant variants” (PCT/EP2016/055377 and WO2016146552A1) filed by University of Warwick and Max Planck Society.
Figures

Similar articles
-
Epigenetic variation in asexually reproducing organisms.Evolution. 2014 Mar;68(3):644-55. doi: 10.1111/evo.12320. Epub 2013 Dec 13. Evolution. 2014. PMID: 24274255 Review.
-
Transgenerational Transmission of Epigenetic Marks During Reproduction in Arabidopsis.Yale J Biol Med. 2025 Jun 30;98(2):245-251. doi: 10.59249/EWLZ5537. eCollection 2025 Jun. Yale J Biol Med. 2025. PMID: 40589939 Free PMC article. Review.
-
Natural epigenetic variation contributes to heritable flowering divergence in a widespread asexual dandelion lineage.Mol Ecol. 2016 Apr;25(8):1759-68. doi: 10.1111/mec.13502. Epub 2016 Jan 21. Mol Ecol. 2016. PMID: 26615058
-
A Comparison of In Vitro and In Vivo Asexual Embryogenesis.Methods Mol Biol. 2016;1359:3-23. doi: 10.1007/978-1-4939-3061-6_1. Methods Mol Biol. 2016. PMID: 26619856 Review.
-
Age-dependent plasticity in reproductive investment, regeneration capacity and survival in a partially clonal animal (Hydra oligactis).J Anim Ecol. 2020 Oct;89(10):2246-2257. doi: 10.1111/1365-2656.13287. Epub 2020 Jul 13. J Anim Ecol. 2020. PMID: 32596821
Cited by
-
Plant DNA Methylation Responds to Nutrient Stress.Genes (Basel). 2022 May 31;13(6):992. doi: 10.3390/genes13060992. Genes (Basel). 2022. PMID: 35741754 Free PMC article. Review.
-
Breeding for Beneficial Microbial Communities Using Epigenomics.Front Microbiol. 2020 May 15;11:937. doi: 10.3389/fmicb.2020.00937. eCollection 2020. Front Microbiol. 2020. PMID: 32477316 Free PMC article. No abstract available.
-
Predictable and stable epimutations induced during clonal plant propagation with embryonic transcription factor.PLoS Genet. 2022 Nov 16;18(11):e1010479. doi: 10.1371/journal.pgen.1010479. eCollection 2022 Nov. PLoS Genet. 2022. PMID: 36383565 Free PMC article.
-
Canalization of genome-wide transcriptional activity in Arabidopsis thaliana accessions by MET1-dependent CG methylation.Genome Biol. 2022 Dec 20;23(1):263. doi: 10.1186/s13059-022-02833-5. Genome Biol. 2022. PMID: 36539836 Free PMC article.
-
Epigenetics for Crop Improvement in Times of Global Change.Biology (Basel). 2021 Aug 11;10(8):766. doi: 10.3390/biology10080766. Biology (Basel). 2021. PMID: 34439998 Free PMC article. Review.
References
-
- Sugimoto K, Gordon SP, Meyerowitz EM. Regeneration in plants and animals: Dedifferentiation, transdifferentiation, or just differentiation? Trends Cell Biol. 2011;21:212–218. - PubMed
-
- Ikeuchi M, Ogawa Y, Iwase A, Sugimoto K. Plant regeneration: Cellular origins and molecular mechanisms. Development. 2016;143:1442–1451. - PubMed
-
- Sugimoto K, Jiao Y, Meyerowitz EM. Arabidopsis regeneration from multiple tissues occurs via a root development pathway. Dev Cell. 2010;18:463–471. - PubMed
-
- McKey D, Elias M, Pujol B, Duputié A. The evolutionary ecology of clonally propagated domesticated plants. New Phytol. 2010;186:318–332. - PubMed
Publication types
MeSH terms
Grants and funding
- BB/L025892/1/Biotechnology and Biological Sciences Research Council/United Kingdom
- BB/L003023/1/Biotechnology and Biological Sciences Research Council/United Kingdom
- BB/N005279/1/Biotechnology and Biological Sciences Research Council/United Kingdom
- BB/N00194X/1/Biotechnology and Biological Sciences Research Council/United Kingdom
- BB/P02601X/1/Biotechnology and Biological Sciences Research Council/United Kingdom
LinkOut - more resources
Full Text Sources
Other Literature Sources
