. 2018 Nov;6(11):1364-1374.
doi: 10.1158/2326-6066.CIR-18-0243. Epub 2018 Sep 10.

TLR Stimulation during T-cell Activation Lowers PD-1 Expression on CD8+ T Cells

Affiliations

TLR Stimulation during T-cell Activation Lowers PD-1 Expression on CD8+ T Cells

Christopher D Zahm et al. Cancer Immunol Res. 2018 Nov.

Abstract

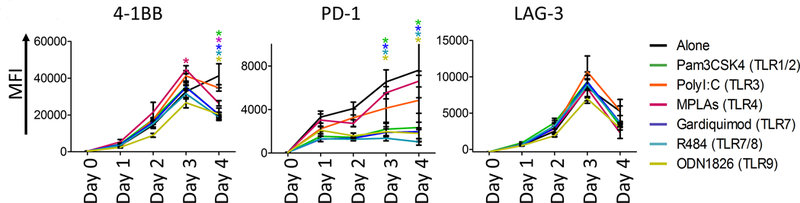
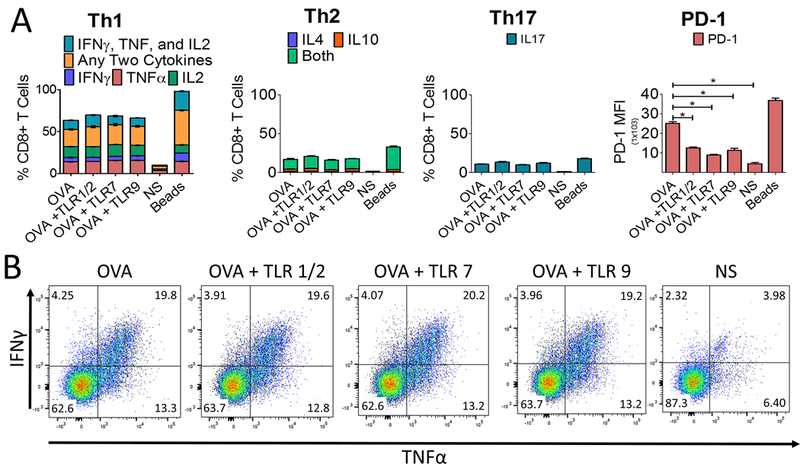
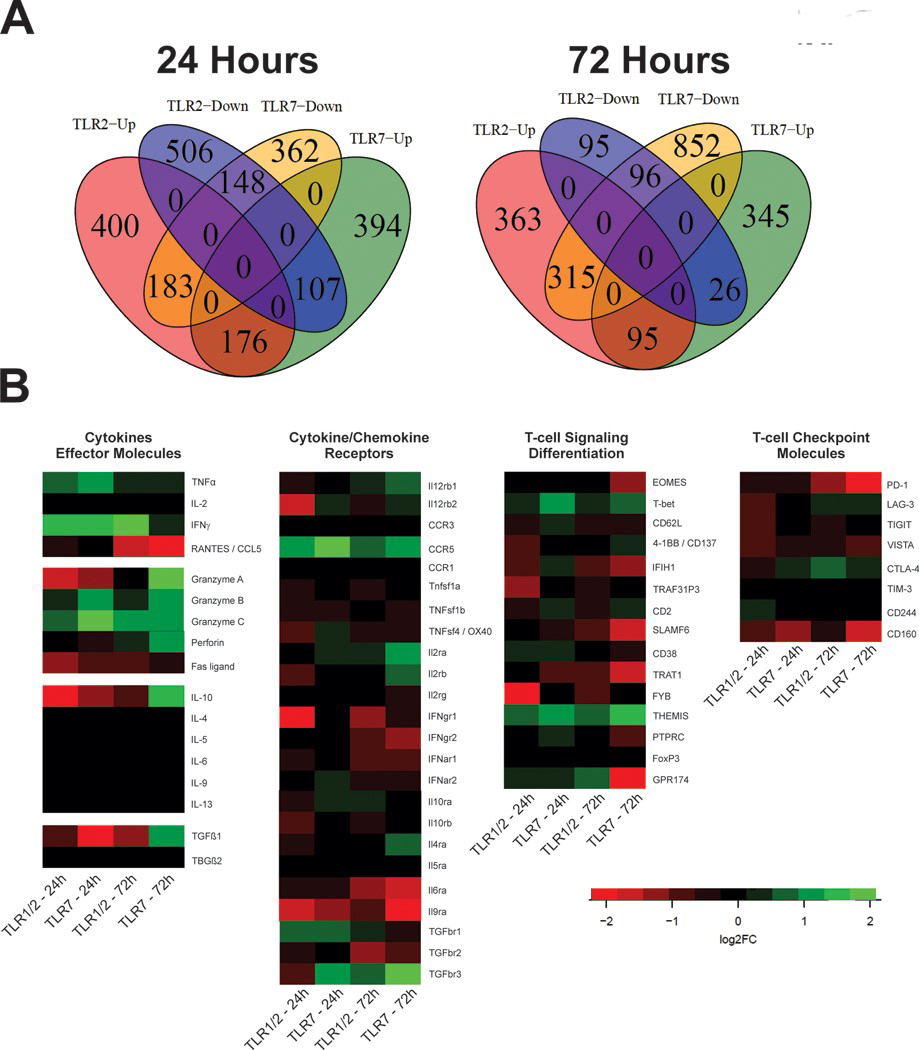
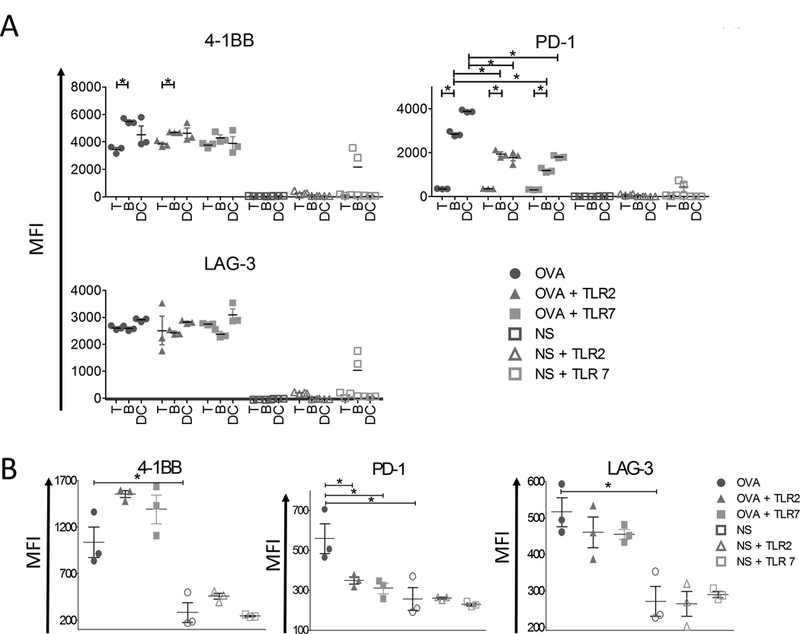
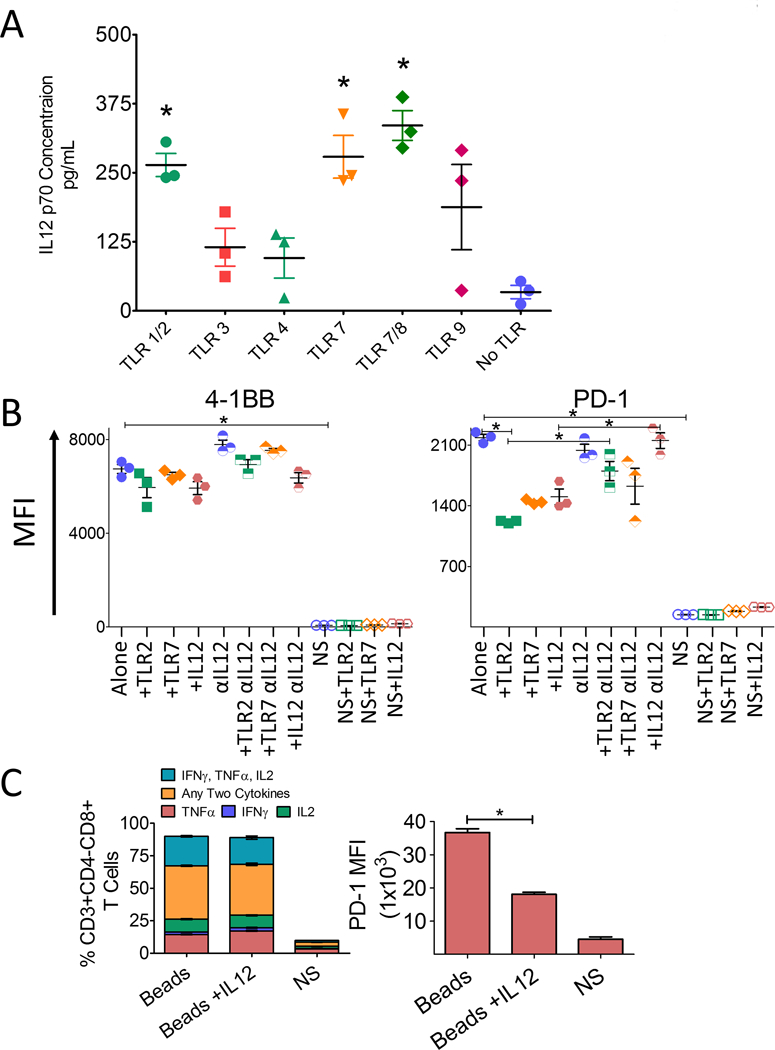
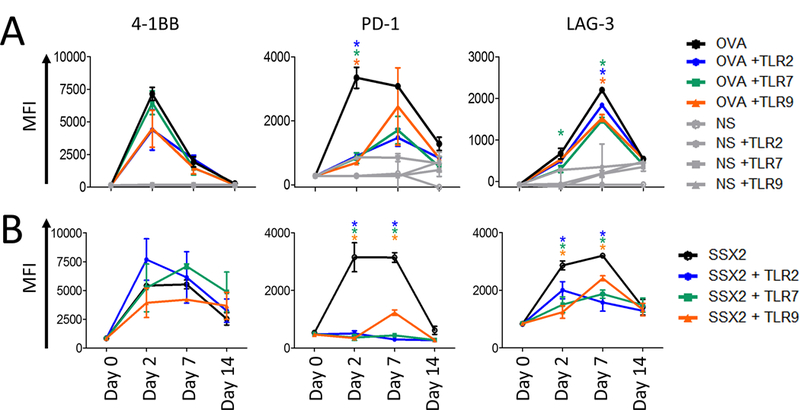
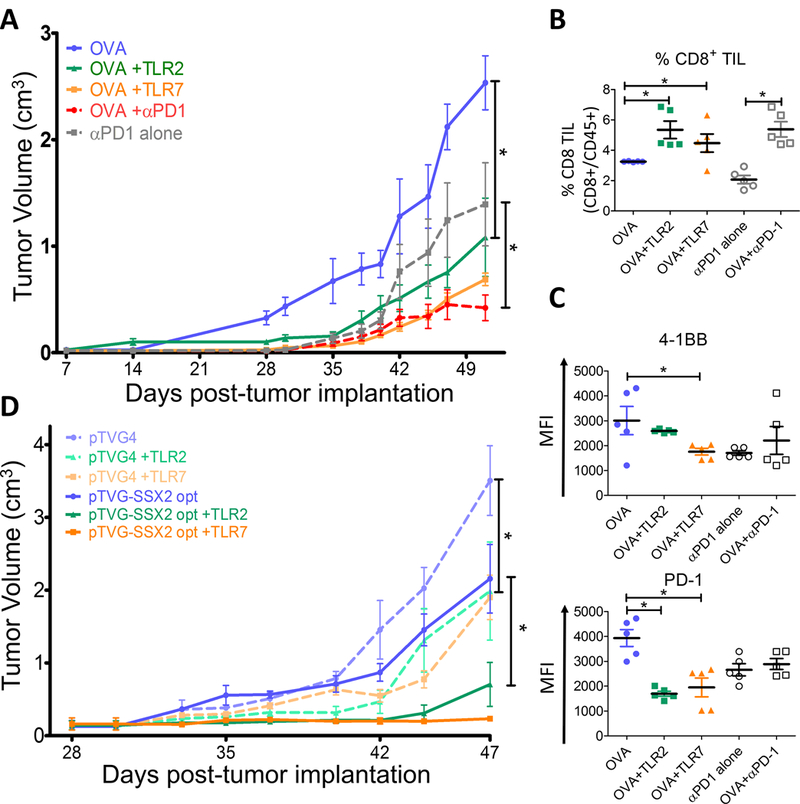
Expression of T-cell checkpoint receptors can compromise antitumor immunity. Blockade of these receptors, notably PD-1 and LAG-3, which become expressed during T-cell activation with vaccination, can improve antitumor immunity. We evaluated whether T-cell checkpoint expression could be separated from T-cell activation in the context of innate immune stimulation with TLR agonists. We found that ligands for TLR1/2, TLR7, and TLR9 led to a decrease in expression of PD-1 on antigen-activated CD8+ T cells. These effects were mediated by IL12 released by professional antigen-presenting cells. In two separate tumor models, treatment with antitumor vaccines combined with TLR1/2 or TLR7 ligands induced antigen-specific CD8+ T cells with lower PD-1 expression and improved antitumor immunity. These findings highlight the role of innate immune activation during effector T-cell development and suggest that at least one mechanism by which specific TLR agonists can be strategically used as vaccine adjuvants is by modulating the expression of PD-1 during CD8+ T-cell activation. Cancer Immunol Res; 6(11); 1364-74. ©2018 AACR.


Conflict of interest statement

Conflicts of Interest: DGM has ownership interest, has received research support, and serves as consultant to Madison Vaccines, Inc. The other authors have no relevant potential conflicts of interest.

Competing interests: DGM has ownership interest, has received research support, and serves as a consultant to Madison Vaccines, Inc. which has licensed technologies related to those described in this report.

Figures

Figure 1.
Figure 1.. TLR stimulation at the time of T-cell activation in vitro affects expression of PD-1.
Splenocytes were prepared from the spleens of OT-1 mice and stimulated in vitro with the high-affinity SIINFEKL peptide in the presence or absence of specific TLR agonists [TLR 1/2 (Pam3CSK4), TLR 3 (Poly I:C), TLR 4 (MPLAs), TLR 7 (Gardiquimod), TLR 7/8 (R848), or TLR 9 (ODN1826)]. Shown are the mean fluorescence intensity (MFI) of 4–1BB, PD-1 and LAG-3 on CD8+ T cells collected daily for 4 days. Asterisks indicate p<0.01, with each comparison made to stimulation with SIINFEKL peptide alone, and color corresponding to the agent compared. Results are from one experiment, with samples assessed in triplicate, and are representative of four similar, independent experiments.
Figure 2.
Figure 2.. The effect of TLR1/2, TLR7 and TLR9 agonists is greatest on PD-1 following T-cell activation.
OT-1 splenocytes were stimulated with either the SIINFEKL (OVA) peptide or a non-specific peptide control (NS), alone or in combination with the designated TLR agonists, for 3 days. The expression of PD-1 and intracellular cytokines, as a percent of total CD8+ T cells, were assessed by flow cytometry (panel A). Representative flow cytometry plots showing IFNγ and TNFα expression with each stimulation condition are shown in panel B. Asterisks indicate p<0.01, with each comparison made to stimulation with OVA peptide alone. Beads = stimulation of OT-1 cells with beads coated with anti-CD3 and anti-CD28. Results are from one experiment, with samples assessed in triplicate, and are representative of two similar experiments.
Figure 3.
Figure 3.. CD8+ T cells activated in the presence of TLR1/2 or TLR7 ligands exhibit a gene expression profile consistent with enhanced effector function:
OT-1 splenocytes were activated for 24 or 72 hours in the presence of SIINFEKL peptide (OVA) alone, or with TLR1/2 or 7 ligands. CD8+ OT-1 T cells were then purified and evaluated for gene expression changes by RNAseq. All samples were evaluated in six replicates from a single experiment. Panel A: Venn diagrams showing the number of enriched GO-term expression with significantly increased (up) or decreased (down) expression following treatment with TLR1/2 (TLR2) or TLR7 relative to SIINFEKL treatment alone. Results are from GSEA with an FDR of <0.25. Panel B: Shown are gene expression changes for CD8+ T cells stimulated with OVA in the presence of TLR agonists versus CD8+ T cells stimulated with OVA alone (green = increased expression, red = reduced expression).
Figure 4.
Figure 4.. Changes in PD-1 expression following TLR stimulation are mediated by factors secreted from professional APC.
Panel A: Purified OT-1 T cells (T), B cells (B), or dendritic cells (DC) were activated with SIINFEKL peptide (OVA) or with a non-specific peptide (NS) and in the presence of TLR1/2 (TLR1/2) agonist, TLR7 agonist (TLR7), or media alone. After 24 hours, cells were washed and cocultured with naïve purified OT-1 CD8+ T cells for an additional 24 hours and then assessed for the expression of the indicated surface receptors (4–1BB, PD-1, and LAG3) by flow cytometry. Shown is the MFI for each marker on CD8+ T cells, with samples assessed in triplicate. Panel B: Purified DCs were stimulated in the presence of TLR1/2 agonist, TLR7 agonist, or media alone. After 24 hours, media was collected and used for culture of purified OT-1 CD8+ T cells with naïve DCs in the presence of OVA or NS peptide. After 24 hours, CD8+ T cells were assessed for the expression of the indicated surface receptors (4–1BB, PD-1, and LAG3) by flow cytometry. Shown is mean and standard error of the MFI for each marker, with samples assessed in triplicate. Results shown are from one experiment, and are representative of two similar experiments. Asterisks indicate p<0.01.
Figure 5.
Figure 5.. Changes in PD-1 expression following TLR stimulation can be mediated by IL12:
Panel A: Purified DCs were stimulated in the presence of TLR1/2 agonist (Pam3CSK4), TLR3 agonist (HMW PolyI:C), TLR4 agonist (MPLA), TLR7 agonist (Gardiquimod), TLR 7/8 agonist (R848, resiquimod), TLR9 agonist (ODN 1826), or media only (no TLR) for 24 hours. Culture supernatant was then evaluated for the presence of IL12 p70 by ELISA. Asterisks indicate significant (p<0.05) IL12 release compared to media alone. Panel B: Purified DCs were stimulated in the presence of TLR1/2 agonist, TLR7 agonist, or media alone. After 24 hours, media was collected and used for culture of purified OT-1 CD8+ T cells with naïve DCs in the presence of SIINFEKL peptide (OVA) and, where indicated, 1.0 ng/mL recombinant IL12 or 0.06 µg/mL anti-IL12 blocking antibody. After 24 hours, CD8+ T cells were assessed for the expression of the indicated surface receptors (4–1BB or PD-1) by flow cytometry. Shown is mean and standard error of the MFI for each marker, with samples assessed in triplicate, and are representative of two independent experiments. Asterisks indicate p<0.01. Panel C: Purified OT-1 CD8+ T cells were stimulated with anti-CD3- and anti-CD28-coated latex beads and in the presence or absence of recombinant IL12, or left untreated (NS). After 24 hours, cells were assessed for the expression of Th1 cytokines or PD-1 by flow cytometry. Results shown are from one experiment, and are representative of two similar experiments.
Figure 6.
Figure 6.. TLR stimulation at the time of CD8+ T-cell activation reduces the expression of PD-1 in vivo.
Panel A: OT-1 T cells were adoptively transferred to naïve C57BL/6 mice and one day later immunized once with 100 µg OVA peptide (or non-specific peptide, NS) in the presence or absence of TLR 1/2, TLR7, or TLR9 ligands. CD8+ T cells were collected from the spleens of mice up to 14 days after immunization and evaluated for expression of 4–1BB, PD-1 and LAG-3 by flow cytometry. Shown are the MFI of 4–1BB, PD-1 and LAG-3 on OT-1 CD8+ T cells collected. Asterisks indicate p<0.01, with each comparison made to peptide alone, and color corresponding to the treatment group compared. Panel B: HLA-A2 transgenic (HHD-II-DR1) mice were immunized once with 100 µg FLQGISPKI (SSX2) peptide in the presence or absence of TLR ligands, as above. Splenocytes were collected from groups up to 14 days after immunization, and the expression of 4–1BB, PD-1 and LAG-3 was evaluated on CD3+CD4- CD8+SSX2tetramer+ T cells by flow cytometry. Results are from one experiment, with N=5 mice/group, and are representative of two similar experiments.
Figure 7.
Figure 7.. Immunization in the presence of TLR1/2 or TLR7 ligands, codelivered as vaccine adjuvants, elicits greater antitumor immunity in vivo:
Panel A: Ovalbumin-expressing E.G7 cells were implanted in C57BL/6 mice and permitted to grow until tumors were palpable (~14 days). OT-1 T cells were then adoptively transferred and mice were immunized subcutaneously the following day with SIINFEKL (OVA) peptide alone, or in combination with TLR1/2 or TLR7 agonist, or with 100 µg anti-PD-1 delivered the day following immunization. Shown are the tumor growth curves (median +/− standard error, n=5 animals per group). Results are from one experiment and are representative of two independent experiments. Panel B: Tumors obtained at necropsy were evaluated for the % of infiltrating CD8+ T cells among CD45+ T cells. Panel C Tumor-infiltrating CD8+ T cells were evaluated for 4–1BB and PD-1 expression by flow cytometry. Panel D: HLA-A2-expressing transgenic mice (HHD-II-DR1) were implanted with SSX-2-expressing tumor cells. After 2 days mice were immunized intradermally weekly with control vector (pTVG4) or DNA encoding SSX2 protein encoding epitopes with high affinity for HLA-A2 (pTVG-SSX2 opt), and delivered alone or codelivered with TLR1/2 or TLR7 agonist. Shown are the growth curves for each group (n=6 animals per group). Asterisk indicates p<0.05. Results are representative of two independent experiments with 12 total mice per group.

Similar articles

Cited by

References

    1. Day CL, Kaufmann DE, Kiepiela P, Brown JA, Moodley ES, Reddy S, et al. PD-1 expression on HIV-specific T cells is associated with T-cell exhaustion and disease progression. Nature 2006;443:350–4. - PubMed
    1. Tian X, Zhang A, Qiu C, Wang W, Yang Y, Qiu C, et al. The upregulation of LAG-3 on T cells defines a subpopulation with functional exhaustion and correlates with disease progression in HIV-infected subjects. J Immunol 2015;194:3873–82. - PubMed
    1. Jin HT, Anderson AC, Tan WG, West EE, Ha SJ, Araki K, et al. Cooperation of Tim-3 and PD-1 in CD8 T-cell exhaustion during chronic viral infection. Proc Natl Acad Sci U S A 2010;107:14733–8. - PMC - PubMed
    1. Ferris RL, Lu B, Kane LP. Too much of a good thing? Tim-3 and TCR signaling in T cell exhaustion. J Immunol 2014;193:1525–30. - PMC - PubMed
    1. Riley JL. PD-1 signaling in primary T cells. Immunological reviews 2009;229:114–25. - PMC - PubMed

Publication types

MeSH terms