

Cortical Potentials Evoked by Subthalamic Stimulation Demonstrate a Short Latency Hyperdirect Pathway in Humans
- PMID: 30201770
- PMCID: PMC6199405
- DOI: 10.1523/JNEUROSCI.1327-18.2018
Cortical Potentials Evoked by Subthalamic Stimulation Demonstrate a Short Latency Hyperdirect Pathway in Humans
Abstract
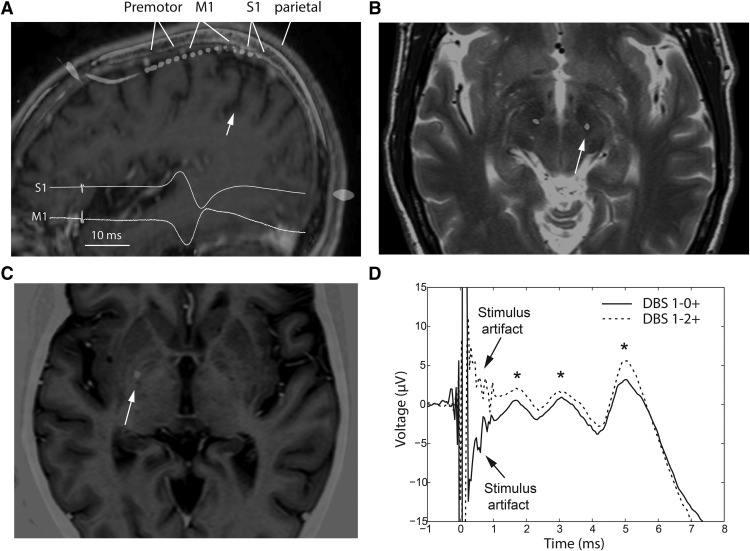
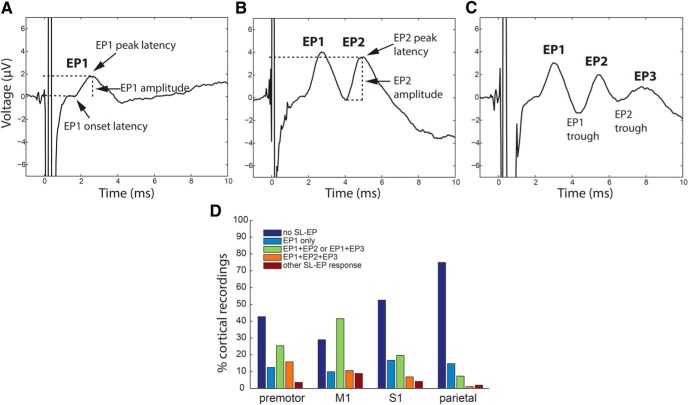
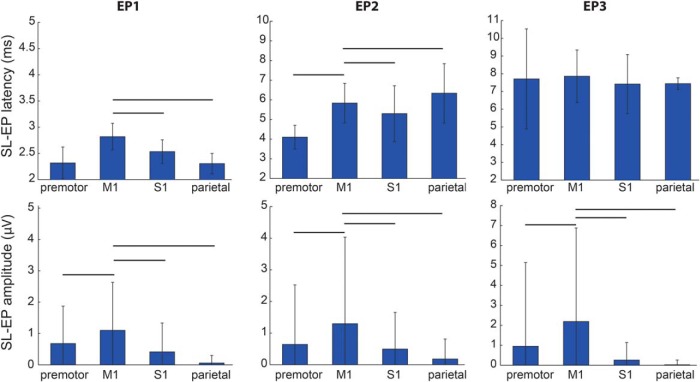
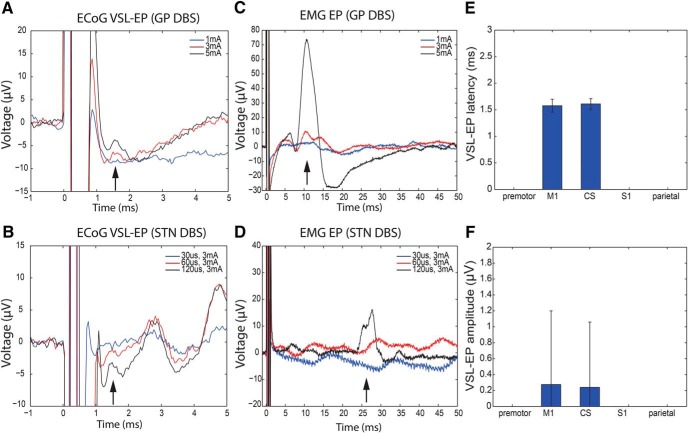
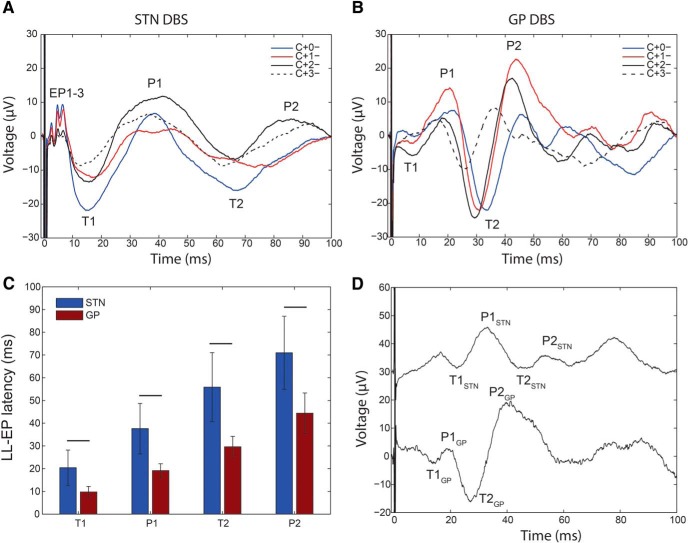
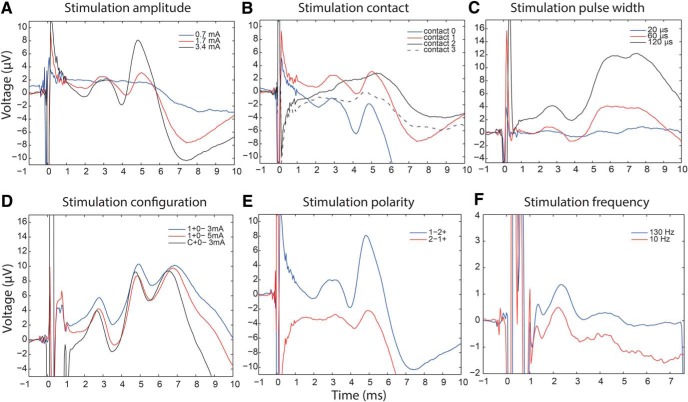
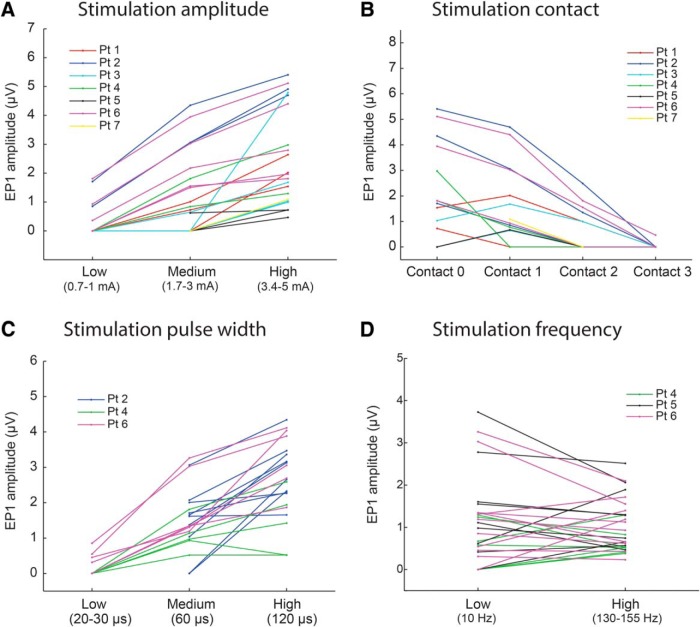
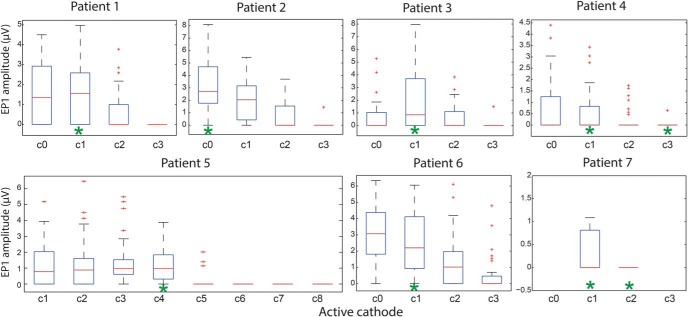
A monosynaptic projection from the cortex to the subthalamic nucleus is thought to have an important role in basal ganglia function and in the mechanism of therapeutic subthalamic deep-brain stimulation, but in humans the evidence for its existence is limited. We sought physiological confirmation of the cortico-subthalamic hyperdirect pathway using invasive recording techniques in patients with Parkinson's disease (9 men, 1 woman). We measured sensorimotor cortical evoked potentials using a temporary subdural strip electrode in response to low-frequency deep-brain stimulation in patients undergoing awake subthalamic or pallidal lead implantations. Evoked potentials were grouped into very short latency (<2 ms), short latency (2-10 ms), and long latency (10-100 ms) from the onset of the stimulus pulse. Subthalamic and pallidal stimulation resulted in very short-latency evoked potentials at 1.5 ms in the primary motor cortex accompanied by EMG-evoked potentials consistent with corticospinal tract activation. Subthalamic, but not pallidal stimulation, resulted in three short-latency evoked potentials at 2.8, 5.8, and 7.7 ms in a widespread cortical distribution, consistent with antidromic activation of the hyperdirect pathway. Long-latency potentials were evoked by both targets, with subthalamic responses lagging pallidal responses by 10-20 ms, consistent with orthodromic activation of the thalamocortical pathway. The amplitude of the first short-latency evoked potential was predictive of the chronic therapeutic stimulation contact.SIGNIFICANCE STATEMENT This is the first physiological demonstration of the corticosubthalamic hyperdirect pathway and its topography at high spatial resolution in humans. We studied cortical potentials evoked by deep-brain stimulation in patients with Parkinson's disease undergoing awake lead implantation surgery. Subthalamic stimulation resulted in multiple short-latency responses consistent with activation of hyperdirect pathway, whereas no such response was present during pallidal stimulation. We contrast these findings with very short latency, direct corticospinal tract activations, and long-latency responses evoked through polysynaptic orthodromic projections. These findings underscore the importance of incorporating the hyperdirect pathway into models of human basal ganglia function.
Keywords: DBS; cortical projections; deep-brain stimulation; electrocorticography; globus pallidus; hyperdirect pathway.
Copyright © 2018 the authors 0270-6474/18/389129-13$15.00/0.
Figures
Similar articles
-
Model-based deconstruction of cortical evoked potentials generated by subthalamic nucleus deep brain stimulation.J Neurophysiol. 2018 Aug 1;120(2):662-680. doi: 10.1152/jn.00862.2017. Epub 2018 Apr 25. J Neurophysiol. 2018. PMID: 29694280 Free PMC article.
-
Pallidal Deep-Brain Stimulation Disrupts Pallidal Beta Oscillations and Coherence with Primary Motor Cortex in Parkinson's Disease.J Neurosci. 2018 May 9;38(19):4556-4568. doi: 10.1523/JNEUROSCI.0431-18.2018. Epub 2018 Apr 16. J Neurosci. 2018. PMID: 29661966 Free PMC article.
-
The nature and time course of cortical activation following subthalamic stimulation in Parkinson's disease.Cereb Cortex. 2010 Aug;20(8):1926-36. doi: 10.1093/cercor/bhp269. Epub 2009 Dec 17. Cereb Cortex. 2010. PMID: 20019146
-
Electrophysiological characterization of the hyperdirect pathway and its functional relevance for subthalamic deep brain stimulation.Exp Neurol. 2022 Jun;352:114031. doi: 10.1016/j.expneurol.2022.114031. Epub 2022 Mar 2. Exp Neurol. 2022. PMID: 35247373 Review.
-
Functional significance of the cortico-subthalamo-pallidal 'hyperdirect' pathway.Neurosci Res. 2002 Jun;43(2):111-7. doi: 10.1016/s0168-0102(02)00027-5. Neurosci Res. 2002. PMID: 12067746 Review.
Cited by
-
Thalamo-cortical evoked potentials during stimulation of the dentato-rubro-thalamic tract demonstrate synaptic filtering.Neurotherapeutics. 2024 Jan;21(1):e00295. doi: 10.1016/j.neurot.2023.10.005. Epub 2023 Dec 19. Neurotherapeutics. 2024. PMID: 38237402 Free PMC article.
-
Intraoperative Characterization of Subthalamic Nucleus-to-Cortex Evoked Potentials in Parkinson's Disease Deep Brain Stimulation.Front Hum Neurosci. 2021 Mar 11;15:590251. doi: 10.3389/fnhum.2021.590251. eCollection 2021. Front Hum Neurosci. 2021. PMID: 33776665 Free PMC article.
-
Neural Circuit and Clinical Insights from Intraoperative Recordings During Deep Brain Stimulation Surgery.Brain Sci. 2019 Jul 20;9(7):173. doi: 10.3390/brainsci9070173. Brain Sci. 2019. PMID: 31330813 Free PMC article.
-
Neurophysiological mechanisms of deep brain stimulation across spatiotemporal resolutions.Brain. 2023 Nov 2;146(11):4456-4468. doi: 10.1093/brain/awad239. Brain. 2023. PMID: 37450573 Free PMC article. Review.
-
Programming of subthalamic nucleus deep brain stimulation with hyperdirect pathway and corticospinal tract-guided parameter suggestions.Hum Brain Mapp. 2023 Aug 15;44(12):4439-4451. doi: 10.1002/hbm.26390. Epub 2023 Jun 15. Hum Brain Mapp. 2023. PMID: 37318767 Free PMC article.
References
Publication types
MeSH terms
Grants and funding
LinkOut - more resources
Full Text Sources
Other Literature Sources
Medical