

Synthetic circuits reveal how mechanisms of gene regulatory networks constrain evolution
- PMID: 30201776
- PMCID: PMC6129954
- DOI: 10.15252/msb.20178102
Synthetic circuits reveal how mechanisms of gene regulatory networks constrain evolution
Abstract
Phenotypic variation is the raw material of adaptive Darwinian evolution. The phenotypic variation found in organismal development is biased towards certain phenotypes, but the molecular mechanisms behind such biases are still poorly understood. Gene regulatory networks have been proposed as one cause of constrained phenotypic variation. However, most pertinent evidence is theoretical rather than experimental. Here, we study evolutionary biases in two synthetic gene regulatory circuits expressed in Escherichia coli that produce a gene expression stripe-a pivotal pattern in embryonic development. The two parental circuits produce the same phenotype, but create it through different regulatory mechanisms. We show that mutations cause distinct novel phenotypes in the two networks and use a combination of experimental measurements, mathematical modelling and DNA sequencing to understand why mutations bring forth only some but not other novel gene expression phenotypes. Our results reveal that the regulatory mechanisms of networks restrict the possible phenotypic variation upon mutation. Consequently, seemingly equivalent networks can indeed be distinct in how they constrain the outcome of further evolution.
Keywords: constrained evolution; epistasis; gene regulatory networks; regulatory mechanisms; synthetic circuits.
© 2018 The Authors. Published under the terms of the CC BY 4.0 license.
Figures
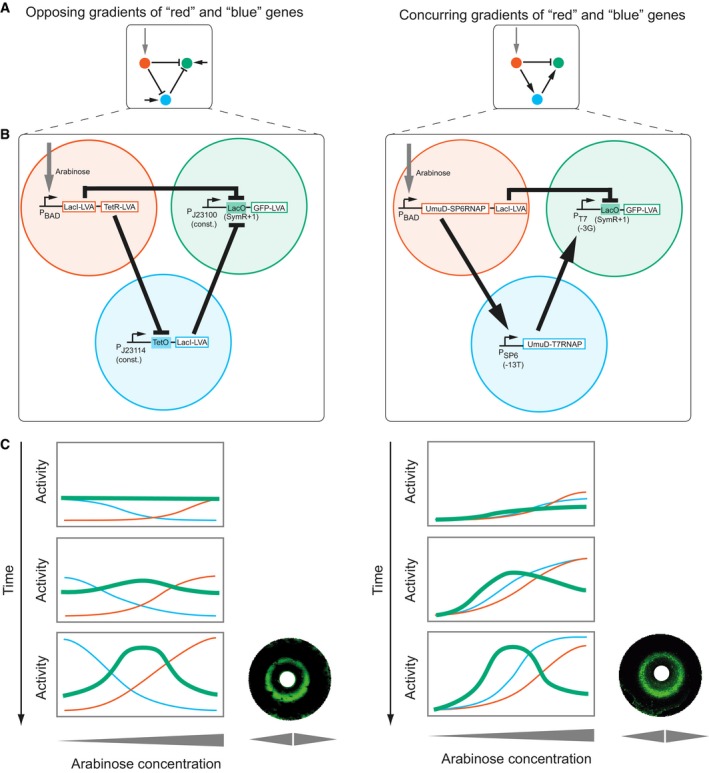
Topologies of the networks using the opposing gradients (left) and concurring gradients (right) mechanisms. Arrow: activation; small horizontal arrow: constitutive promoter; bar: repression; red: morphogen input receiver gene; blue: intermediate loop gene; green: stripe output gene.
Synthetic implementations of the circuits (Schaerli et al, 2014). Open rectangle: open reading frame; filled rectangle: operator; bent arrow: promoter. All genes carry a degradation tag [LVA (Andersen et al, 1998) or UmuD (Gonzalez et al, 1998)]. Indicated variants of T7 promoter, SP6 promoter and LacO were used (Schaerli et al, 2014). J23114 and J23100 are constitutive promoters (
http://partsregistry.org/Promoters/Catalog/Anderson ).Rectangles: Schematic drawings of spatiotemporal course of gene expression (colour‐coded) as in (A) for the two networks (see Box 1). The expression level of the “green” gene is the phenotypic “output” of the network. Corresponding simulations (Code EV1) are shown in Appendix Fig S7. Circles: bacterial lawns display green fluorescent rings as a function of radial arabinose gradients from central paper discs (white). Images were taken 6 h after addition of arabinose. Figure adapted from Schaerli et al (2014).
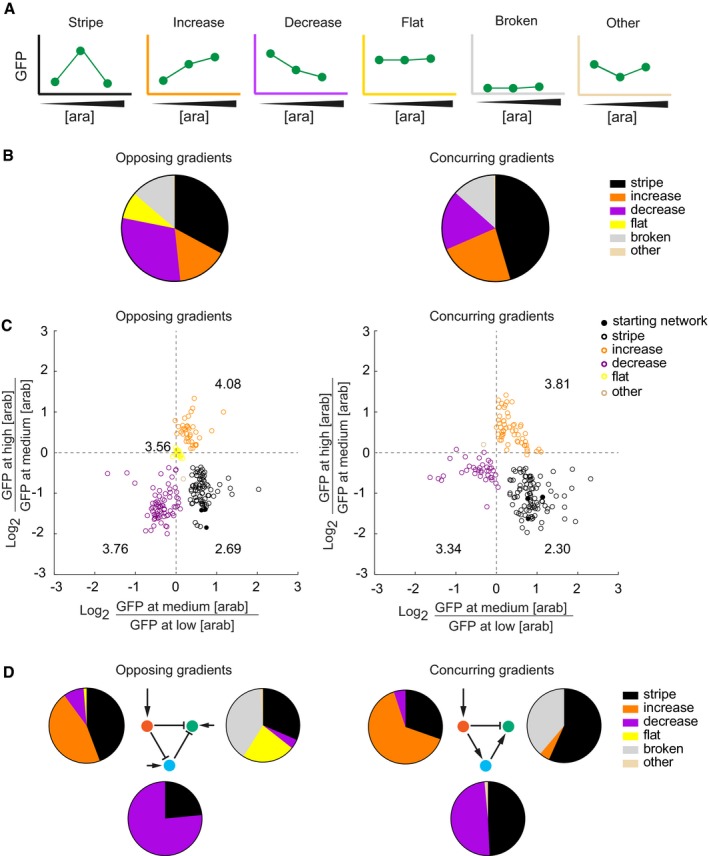
Phenotype categories used in this study. See Materials and Methods for exact definitions. [ara], arabinose concentration. The colours of the axes are used throughout the paper to colour‐code the phenotypes.
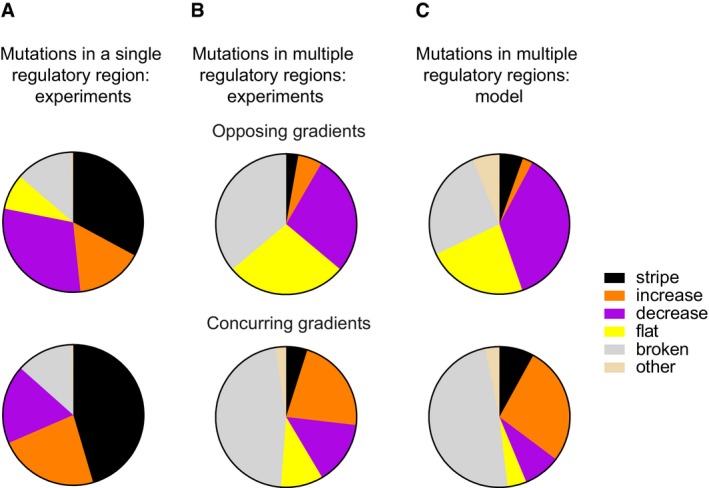
Experimentally observed phenotype distributions when mutating one regulatory region at a time for the opposing (left) and concurring (right) gradients networks. The pie charts summarise the spectrum of all mutant phenotypes observed in a network. The data are based on 234 and 215 mutants of the opposing and concurring gradients networks, respectively.
The GFP expression level (fluorescence normalised by the absorbance) of each individual mutant at medium arabinose concentration is compared to the GFP expression levels at low (x‐axis) and high arabinose (y‐axis) concentrations. The numbers written close to each phenotype group are the average mutation rates for that group. We omitted the “broken” phenotype from this analysis, as the networks with this phenotype do not show any significant GFP expression.
Experimentally observed phenotype distributions as displayed in (B and C), grouped according to the mutated gene.
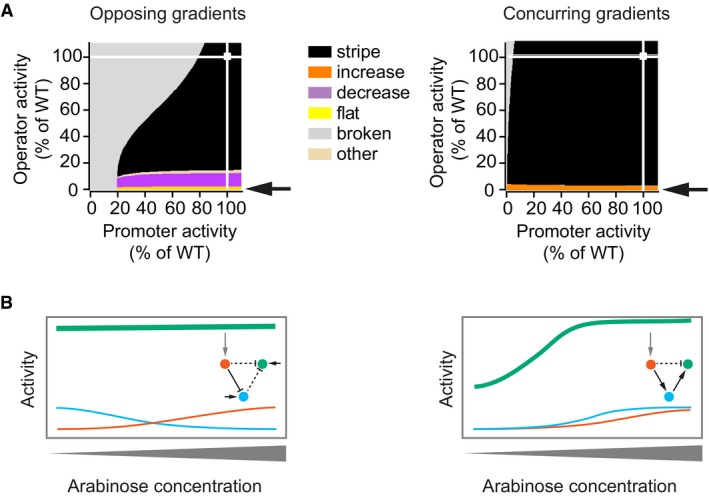
Phenotype diagrams for parameters that describe the activity of the “green” gene. Horizontal and vertical axes indicate promoter and operator activities of the “green” gene relative to the wild‐type value (WT, 100%). All parameters affecting the promoter or operator were varied jointly and to the same extent. Colours indicate phenotypes predicted by the model over the whole range of promoter and operator activity values. White squares indicate the parameter combination of the unmutated circuit, which produces the “stripe” phenotype, and white lines are visual guides that project these values onto the two parameter axes. Arrows point to the phenotype observed when operator activity decreases to a value near zero per cent.
Schematic drawing of how a strong reduction in operator activity of the “green” gene affects gene expression patterns differently in the two types of networks. Insets: topologies of the networks, with dashed lines indicating interactions affected by mutations in the operator.

Distribution of observed phenotypes of mutant circuits with mutations in the regulatory region of the “green” gene. Phenotypes are colour‐coded (legend). Smaller graphs to the right indicate the subset of networks that have mutations only in the promoter or only in the operator. The data are based on 73 and 67 mutants of the opposing and concurring gradients networks, respectively.
Wild‐type sequences of regulatory regions (top of each panel, important elements labelled and coloured) together with the number of mutations at each site of a regulatory region that produce phenotypes of a given kind (bar‐charts below sequence, phenotypes labelled and colour‐coded). The height of each bar corresponds to the number of mutant networks with a mutation at a given position, where these mutations produced the indicated phenotype. Only phenotypes produced by at least three mutant circuits are shown. Red arrows indicate genotypes that can produce a novel phenotype with a single mutation at the indicated position.
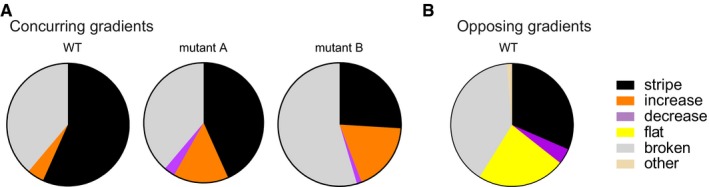
Mutations were introduced into the “green” genes of three concurring gradients networks with different biochemical parameters. The pie charts display the observed phenotype distributions. The data are based on 68 (WT, Fig 2D), 67 (mutant A) and 77 (mutant B) variants.
For comparison, we show again the phenotype distribution of the “green” gene of the opposing gradients network (Fig 2D).
Experimentally observed phenotype distributions when mutating one regulatory region at a time for the opposing (top) and concurring (bottom) gradients networks. Data redisplayed from Fig 2B to facilitate comparison with Fig 6B.
Experimentally observed phenotypes of networks with at least two mutated regulatory regions. The data are based on 36 and 41 mutant networks for the opposing (top) and concurring (bottom) gradients mechanisms, respectively.
Phenotype distributions produced by the model when simultaneously mutating multiple regulatory regions.
References
-
- Alon U (2007) Network motifs: theory and experimental approaches. Nat Rev Genet 8: 450‐461 - PubMed
-
- Arnold SJ (1992) Constraints on phenotypic evolution. Am Nat 140(Suppl 1): S85–S107 - PubMed
-
- Beldade P, Brakefield PM (2002) The genetics and evo‐devo of butterfly wing patterns. Nat Rev Genet 3: 442–452 - PubMed
Publication types
MeSH terms
Substances
Grants and funding
LinkOut - more resources
Full Text Sources
Other Literature Sources
