

c302: a multiscale framework for modelling the nervous system of Caenorhabditis elegans
- PMID: 30201842
- PMCID: PMC6158223
- DOI: 10.1098/rstb.2017.0379
c302: a multiscale framework for modelling the nervous system of Caenorhabditis elegans
Abstract
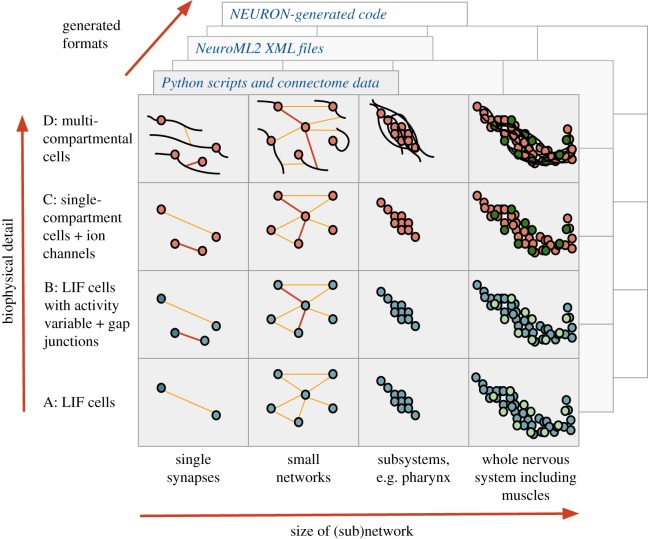
The OpenWorm project has the ambitious goal of producing a highly detailed in silico model of the nematode Caenorhabditis elegans A crucial part of this work will be a model of the nervous system encompassing all known cell types and connections. The appropriate level of biophysical detail required in the neuronal model to reproduce observed high-level behaviours in the worm has yet to be determined. For this reason, we have developed a framework, c302, that allows different instances of neuronal networks to be generated incorporating varying levels of anatomical and physiological detail, which can be investigated and refined independently or linked to other tools developed in the OpenWorm modelling toolchain.This article is part of a discussion meeting issue 'Connectome to behaviour: modelling C. elegans at cellular resolution'.
Keywords: C. elegans; computational neuroscience; open source; simulation; standardization.
© 2018 The Authors.
Conflict of interest statement
We declare we have no competing interests.
Figures
Similar articles
-
Connectome to behaviour: modelling Caenorhabditis elegans at cellular resolution.Philos Trans R Soc Lond B Biol Sci. 2018 Sep 10;373(1758):20170366. doi: 10.1098/rstb.2017.0366. Philos Trans R Soc Lond B Biol Sci. 2018. PMID: 30201832 Free PMC article.
-
OpenWorm: overview and recent advances in integrative biological simulation of Caenorhabditis elegans.Philos Trans R Soc Lond B Biol Sci. 2018 Sep 10;373(1758):20170382. doi: 10.1098/rstb.2017.0382. Philos Trans R Soc Lond B Biol Sci. 2018. PMID: 30201845 Free PMC article. Review.
-
Towards systematic, data-driven validation of a collaborative, multi-scale model of Caenorhabditis elegans.Philos Trans R Soc Lond B Biol Sci. 2018 Sep 10;373(1758):20170381. doi: 10.1098/rstb.2017.0381. Philos Trans R Soc Lond B Biol Sci. 2018. PMID: 30201844 Free PMC article.
-
Functional connectomics from neural dynamics: probabilistic graphical models for neuronal network of Caenorhabditis elegans.Philos Trans R Soc Lond B Biol Sci. 2018 Sep 10;373(1758):20170377. doi: 10.1098/rstb.2017.0377. Philos Trans R Soc Lond B Biol Sci. 2018. PMID: 30201841 Free PMC article.
-
C. elegans wired and wireless connectome: insights into principles of nervous system structure and function.J Biosci. 2025;50:16. J Biosci. 2025. PMID: 40135746 Review.
Cited by
-
A complete biomechanical model of Hydra contractile behaviors, from neural drive to muscle to movement.Proc Natl Acad Sci U S A. 2023 Mar 14;120(11):e2210439120. doi: 10.1073/pnas.2210439120. Epub 2023 Mar 10. Proc Natl Acad Sci U S A. 2023. PMID: 36897982 Free PMC article.
-
Biophysical modeling of the whole-cell dynamics of C. elegans motor and interneurons families.PLoS One. 2024 Mar 29;19(3):e0298105. doi: 10.1371/journal.pone.0298105. eCollection 2024. PLoS One. 2024. PMID: 38551921 Free PMC article.
-
The Conscious Nematode: Exploring Hallmarks of Minimal Phenomenal Consciousness in Caenorhabditis Elegans.Int J Psychol Res (Medellin). 2023 Oct 10;16(2):87-104. doi: 10.21500/20112084.6487. eCollection 2023 Jul-Dec. Int J Psychol Res (Medellin). 2023. PMID: 38106963 Free PMC article.
-
The NeuroML ecosystem for standardized multi-scale modeling in neuroscience.Elife. 2025 Jan 10;13:RP95135. doi: 10.7554/eLife.95135. Elife. 2025. PMID: 39792574 Free PMC article.
-
Unsupervised learning of control signals and their encodings in Caenorhabditis elegans whole-brain recordings.J R Soc Interface. 2020 Dec;17(173):20200459. doi: 10.1098/rsif.2020.0459. Epub 2020 Dec 9. J R Soc Interface. 2020. PMID: 33292096 Free PMC article.
References
-
- Dayan P, Abbott LF. 2001. Theoretical neuroscience. Cambridge, MA: MIT Press.
Publication types
MeSH terms
Grants and funding
LinkOut - more resources
Full Text Sources
Other Literature Sources
