. 2018 Sep 10;373(1758):20170381.
doi: 10.1098/rstb.2017.0381.

Towards systematic, data-driven validation of a collaborative, multi-scale model of Caenorhabditis elegans

Affiliations

Towards systematic, data-driven validation of a collaborative, multi-scale model of Caenorhabditis elegans

Richard C Gerkin et al. Philos Trans R Soc Lond B Biol Sci. .

Abstract

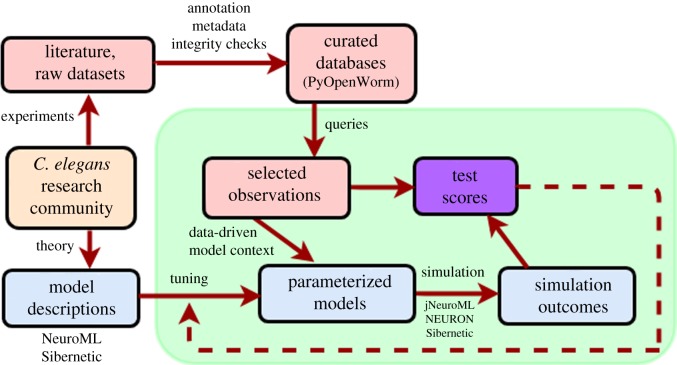
The OpenWorm Project is an international open-source collaboration to create a multi-scale model of the organism Caenorhabditis elegans At each scale, including subcellular, cellular, network and behaviour, this project employs one or more computational models that aim to recapitulate the corresponding biological system at that scale. This requires that the simulated behaviour of each model be compared with experimental data both as the model is continuously refined and as new experimental data become available. Here we report the use of SciUnit, a software framework for model validation, to attempt to achieve these goals. During project development, each model is continuously subjected to data-driven 'unit tests' that quantitatively summarize model-data agreement, identifying modelling progress and highlighting particular aspects of each model that fail to adequately reproduce known features of the biological organism and its components. This workflow is publicly visible via both GitHub and a web application and accepts community contributions to ensure that modelling goals are transparent and well-informed.This article is part of a discussion meeting issue 'Connectome to behaviour: modelling C. elegans at cellular resolution'.

Keywords: Python; informatics; modelling; unit-testing.


Conflict of interest statement

The authors declare that they have no competing interests.

Figures

Figure 1.
Figure 1.
Testing overview. The C. elegans research community, including members of OpenWorm, produce models using standards such as NeuroML and optionally tune their parameters. The community also produces abundant experimental data, which OpenWorm has taken the lead in annotating and curating into easily accessible databases. The testing procedure (green box) invokes SciUnit and related packages to query these databases for observations that parameterize tests, to simulate these models and judge their output according to its correspondence with these empirical observations, and to generate test scores summarizing this correspondence.
Figure 2.
Figure 2.
Layers of testing for the OpenWorm Project. In the first, outer-most layer, the Python unittest module is invoked from the command line or a continuous integration script, where it can run elements in the second, middle layer. This layer consists of simple blocks of code that can test models, or any project components more generally, but also can run Jupyter notebooks that contain the configuration and execution of most of the SciUnit tests. The notebooks can be explored locally or interactively or simply viewed remotely on GitHub. SciUnit test execution represents the third, inner-most layer and relies on code in the sciunit package or a variety of SciUnit-based packages such as neuronunit. Test metadata and test results, including scores, optionally can be uploaded to http://dash.scidash.org to add to a public record of the history of model performance on the tests.
Figure 3.
Figure 3.
The SciDash web dashboard for test scores. Each time a test is run, the results are optionally programatically uploaded to http://dash.scidash.org, where they can be viewed. In this example, the scores shown represent Z-Scores, the normalized deviation between the model output and the experimental data distribution. Test scores are colour coded from green (good) to red (bad), to visualize comparison of models on a given test (but not necessarily across tests). Additional metadata (not shown) is also viewable by clicking on links associated with a score's entry. This dashboard can be filtered, sorted and searched to allow anyone to check the progress of the various models, or to compare different versions of the model on their test performance.
Figure 4.
Figure 4.
Data-driven validation testing of a C. elegans ion channel model: ChannelWorm. The black and red current-voltage relationships (IV curves) were produced by the real and simulated worm EGL-19 ion channels, respectively. The model is judged to fail this test due to the deviation between the two. This output is also displayed in the corresponding Jupyter notebook for this test.
Figure 5.
Figure 5.
Data-driven validation testing of a C. elegans muscle cell and the motor neuron that drives it: c302. (a) Results on a suite of four tests, two that compare the distributions of inter-spike-intervals (ISIs) and two that compare the shapes of the action potentials. This exact output is also displayed in the corresponding Jupyter notebook for this test suite. (b) A segment of the experimental membrane potential traces. (c) A segment of the simulated model membrane potential trace. (d) Normalized ISI histogram observed in the experiment and a fit to a theoretical gamma distribution. The test computes and uses parameters from such a fit to assess agreement to a similarly fit model ISI histogram.
Figure 6.
Figure 6.
Data-driven validation testing of a C. elegans motor behaviour model: Sibernetic. (a) Scores for each of eight tests representing core movement and posture features are shown. In some cases, test results are unavailable because the corresponding features cannot be computed for simulation output in the current state of the model. In all other cases, scores indicate that model output is within two standard deviations of the experimental data distribution. (b) Graphical depiction of the contents of a WCON file constructed from segmentation of a video of C. elegans locomotor behaviour. One frame is shown, with the body orientation in blue, the head location in red and head locations from previous frames shown in grey.

Similar articles

Cited by

  • OpenWorm: overview and recent advances in integrative biological simulation of Caenorhabditis elegans.
    Sarma GP, Lee CW, Portegys T, Ghayoomie V, Jacobs T, Alicea B, Cantarelli M, Currie M, Gerkin RC, Gingell S, Gleeson P, Gordon R, Hasani RM, Idili G, Khayrulin S, Lung D, Palyanov A, Watts M, Larson SD. Sarma GP, et al. Philos Trans R Soc Lond B Biol Sci. 2018 Sep 10;373(1758):20170382. doi: 10.1098/rstb.2017.0382. Philos Trans R Soc Lond B Biol Sci. 2018. PMID: 30201845 Free PMC article. Review.
  • Connectome to behaviour: modelling Caenorhabditis elegans at cellular resolution.
    Larson SD, Gleeson P, Brown AEX. Larson SD, et al. Philos Trans R Soc Lond B Biol Sci. 2018 Sep 10;373(1758):20170366. doi: 10.1098/rstb.2017.0366. Philos Trans R Soc Lond B Biol Sci. 2018. PMID: 30201832 Free PMC article.
  • Community-based reconstruction and simulation of a full-scale model of the rat hippocampus CA1 region.
    Romani A, Antonietti A, Bella D, Budd J, Giacalone E, Kurban K, Sáray S, Abdellah M, Arnaudon A, Boci E, Colangelo C, Courcol JD, Delemontex T, Ecker A, Falck J, Favreau C, Gevaert M, Hernando JB, Herttuainen J, Ivaska G, Kanari L, Kaufmann AK, King JG, Kumbhar P, Lange S, Lu H, Lupascu CA, Migliore R, Petitjean F, Planas J, Rai P, Ramaswamy S, Reimann MW, Riquelme JL, Román Guerrero N, Shi Y, Sood V, Sy MF, Van Geit W, Vanherpe L, Freund TF, Mercer A, Muller E, Schürmann F, Thomson AM, Migliore M, Káli S, Markram H. Romani A, et al. PLoS Biol. 2024 Nov 5;22(11):e3002861. doi: 10.1371/journal.pbio.3002861. eCollection 2024 Nov. PLoS Biol. 2024. PMID: 39499732 Free PMC article.
  • On the Role of Theory and Modeling in Neuroscience.
    Levenstein D, Alvarez VA, Amarasingham A, Azab H, Chen ZS, Gerkin RC, Hasenstaub A, Iyer R, Jolivet RB, Marzen S, Monaco JD, Prinz AA, Quraishi S, Santamaria F, Shivkumar S, Singh MF, Traub R, Nadim F, Rotstein HG, Redish AD. Levenstein D, et al. J Neurosci. 2023 Feb 15;43(7):1074-1088. doi: 10.1523/JNEUROSCI.1179-22.2022. J Neurosci. 2023. PMID: 36796842 Free PMC article.
  • Combining hypothesis- and data-driven neuroscience modeling in FAIR workflows.
    Eriksson O, Bhalla US, Blackwell KT, Crook SM, Keller D, Kramer A, Linne ML, Saudargienė A, Wade RC, Hellgren Kotaleski J. Eriksson O, et al. Elife. 2022 Jul 6;11:e69013. doi: 10.7554/eLife.69013. Elife. 2022. PMID: 35792600 Free PMC article.

References

    1. Beck K. 2003. Test-driven development: by example. Boston, MA: Addison-Wesley Professional.
    1. Omar C, Aldrich J, Gerkin RC. 2014. Collaborative Infrastructure for Test-driven Scientific Model Validation. In Companion Proc. of the 36th International Conf. on Software Engineering, ICSE Companion 2014, pp. 524–527, New York, NY, USA: ACM; http://doi.acm.org/10.1145/2591062.2591129.
    1. Sarma GP, Jacobs TW, Watts MD, Ghayoomie SV, Larson SD, Gerkin RC. 2016. Unit testing, model validation, and biological simulation. F1000Research 5, 1946 (10.12688/f1000research.9315.1) - DOI - PMC - PubMed
    1. Hines ML, Carnevale NT. 1997. The NEURON simulation environment. Neural Comput. 9, 1179–1209. - PubMed
    1. Yu Palyanov A, Khayrulin SS. 2015. Sibernetic: a software complex based on the PCI SPH algorithm aimed at simulation problems in biomechanics. Russ. J. Genet Appl. Res. 5, 635–641. (10.1134/S2079059715060052) - DOI

Publication types

LinkOut - more resources