

Spatial Patterns in Rush-Hour vs. Work-Week Diesel-Related Pollution across a Downtown Core
- PMID: 30201856
- PMCID: PMC6164514
- DOI: 10.3390/ijerph15091968
Spatial Patterns in Rush-Hour vs. Work-Week Diesel-Related Pollution across a Downtown Core
Abstract
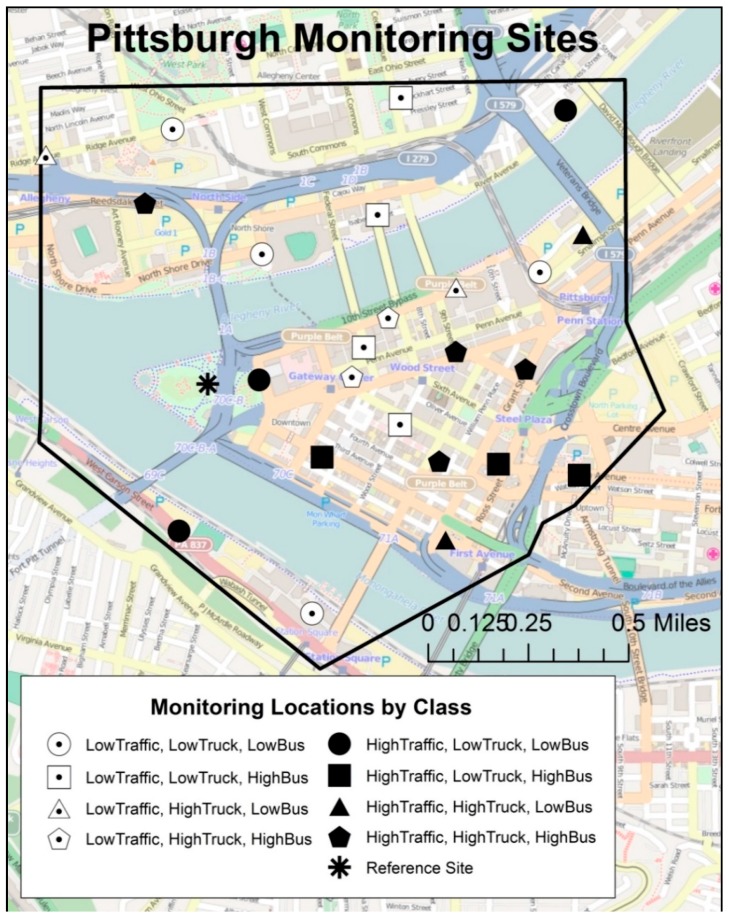
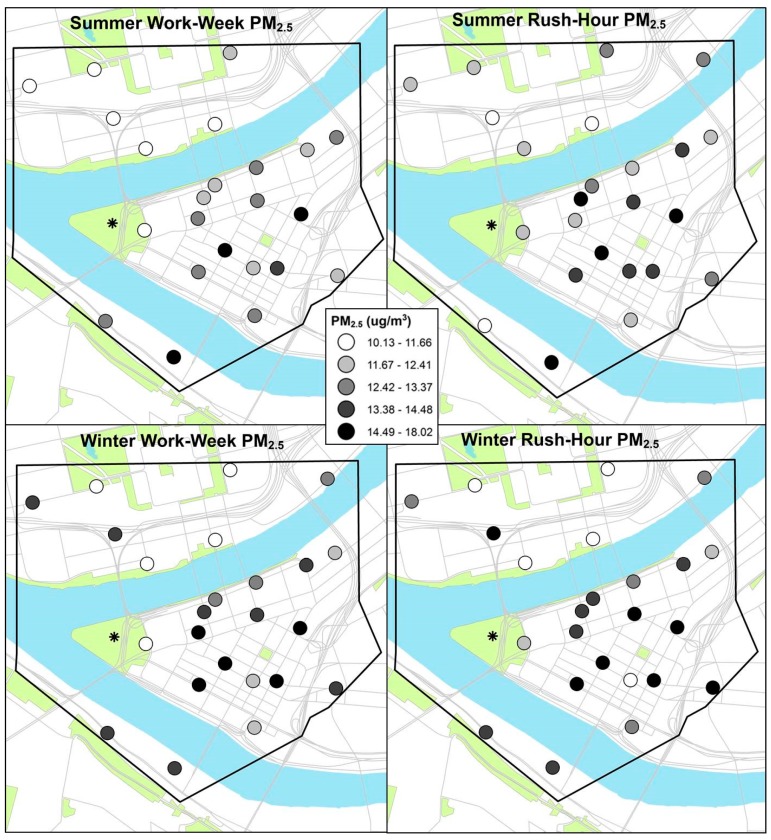
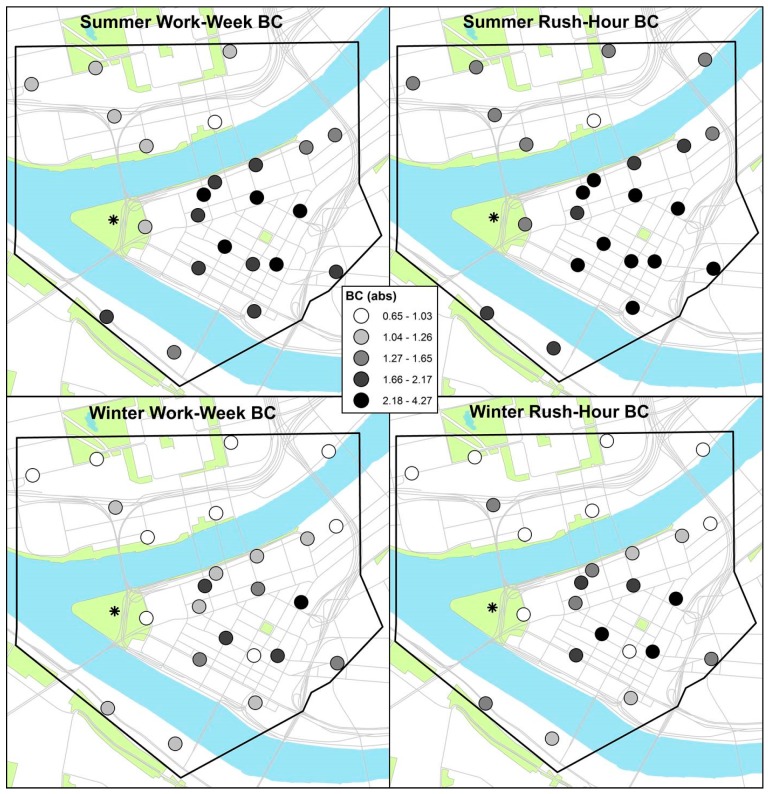
Despite advances in monitoring and modelling of intra-urban variation in multiple pollutants, few studies have attempted to separate spatial patterns by time of day, or incorporated organic tracers into spatial monitoring studies. Due to varying emissions sources from diesel and gasoline vehicular traffic, as well as within-day temporal variation in source mix and intensity (e.g., rush-hours vs. full-day measures), accurately assessing diesel-related air pollution within an urban core can be challenging. We allocated 24 sampling sites across downtown Pittsburgh, Pennsylvania (2.8 km²) to capture fine-scale variation in diesel-related pollutants, and to compare these patterns by sampling interval (i.e., "rush-hours" vs. "work-week" concentrations), and by season. Using geographic information system (GIS)-based methods, we allocated sampling sites to capture spatial variation in key traffic-related pollution sources (i.e., truck, bus, overall traffic densities). Programmable monitors were used to collect integrated work-week and rush-hour samples of fine particulate matter (PM2.5), black carbon (BC), trace elements, and diesel-related organics (polycyclic aromatic hydrocarbons (PAHs), hopanes, steranes), in summer and winter 2014. Land use regression (LUR) models were created for PM2.5, BC, total elemental carbon (EC), total organic carbon (OC), elemental (Al, Ca, Fe), and organic constituents (total PAHs, total hopanes), and compared by sampling interval and season. We hypothesized higher pollution concentrations and greater spatial contrast in rush-hour, compared to full work-week samples, with variation by season and pollutant. Rush-hour sampling produced slightly higher total PM2.5 and BC concentrations in both seasons, compared to work-week sampling, but no evident difference in spatial patterns. We also found substantial spatial variability in most trace elements and organic compounds, with comparable spatial patterns using both sampling paradigms. Overall, we found higher concentrations of traffic-related trace elements and organic compounds in rush-hour samples, and higher concentrations of coal-related elements (e.g., As, Se) in work-week samples. Mean bus density was the strongest LUR predictor in most models, in both seasons, under each sampling paradigm. Within each season and constituent, the bus-related terms explained similar proportions of variance in the rush-hour and work-week samples. Rush-hour and work-week LUR models explained similar proportions of spatial variation in pollutants, suggesting that the majority of emissions may be produced during rush-hour traffic across downtown. Results suggest that rush-hour emissions may predominantly shape overall spatial variance in diesel-related pollutants.
Keywords: air pollution monitoring; black carbon (BC); fine particulate matter (PM2.5); geographic information systems (GIS); land use regression (LUR); organic compounds; trace elements.
Conflict of interest statement
The authors declare no conflict of interest.
Figures
References
-
- Tunno B.J., Michanowicz D., Tripathy S., Chubb L., Kinnee E., Cambal L., Roper C., Clougherty J.E. Spatial Variation in Diesel-Related Elemental and Organic PM2.5 Components during Workweek Hours across a Downtown Core. Sci. Total Environ. 2016;573:27–38. doi: 10.1016/j.scitotenv.2016.08.011. - DOI - PubMed
-
- EPA Diesel Particulate Matter. [(accessed on 5 February 2018)]; Available online: http://www3.epa.gov/region1/eco/airtox/diesel.html.
Publication types
MeSH terms
Substances
LinkOut - more resources
Full Text Sources
Other Literature Sources
Research Materials
