. 2018 Sep 10;19(9):2679.
doi: 10.3390/ijms19092679.

Multiple Aspects of PIP2 Involvement in C. elegans Gametogenesis

Affiliations

Multiple Aspects of PIP2 Involvement in C. elegans Gametogenesis

Livia Ulicna et al. Int J Mol Sci. .

Abstract

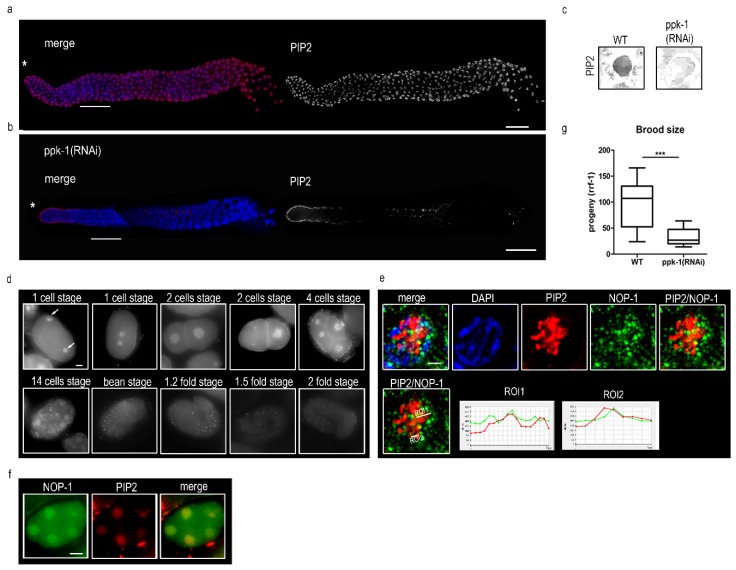
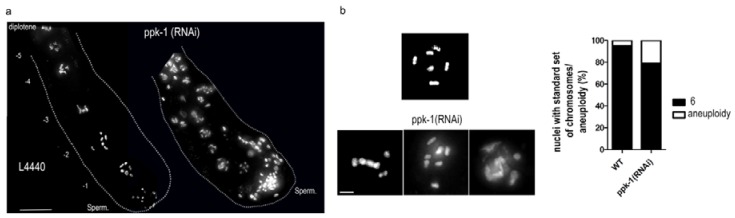
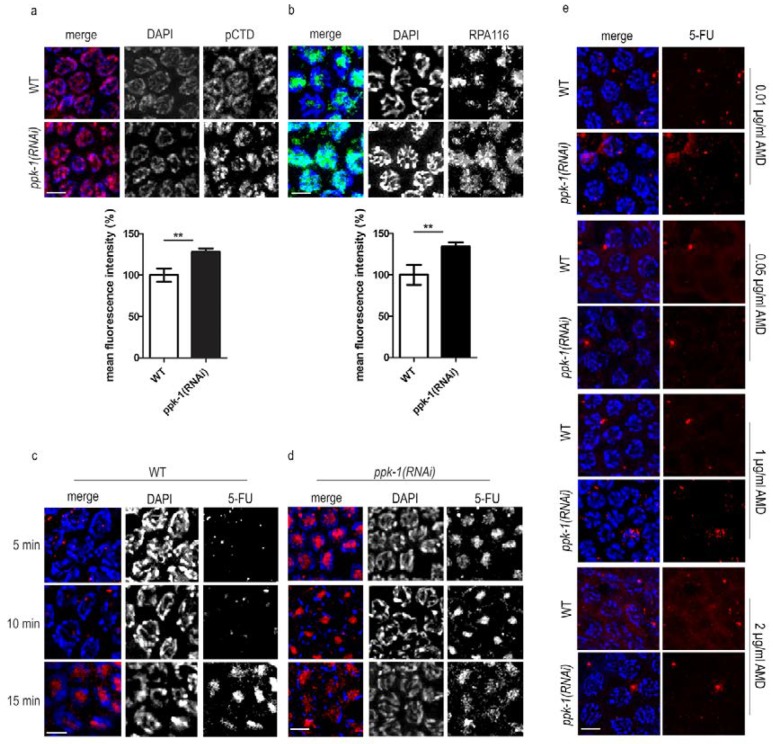
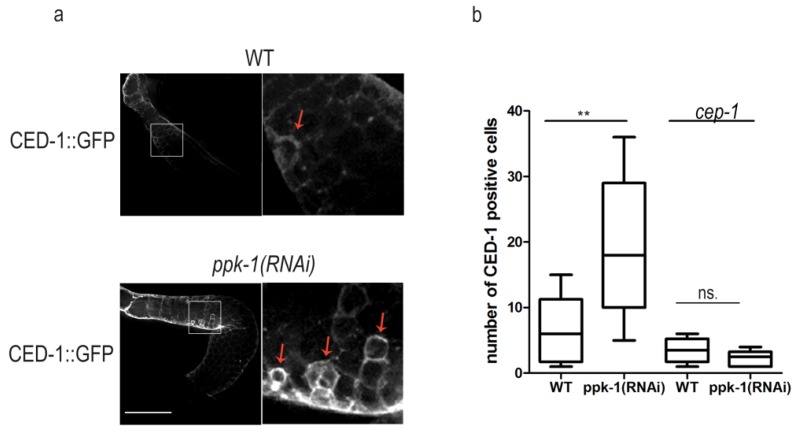
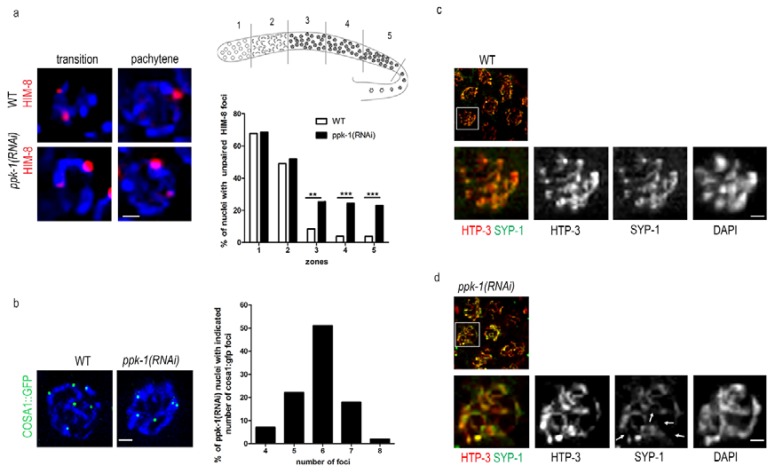
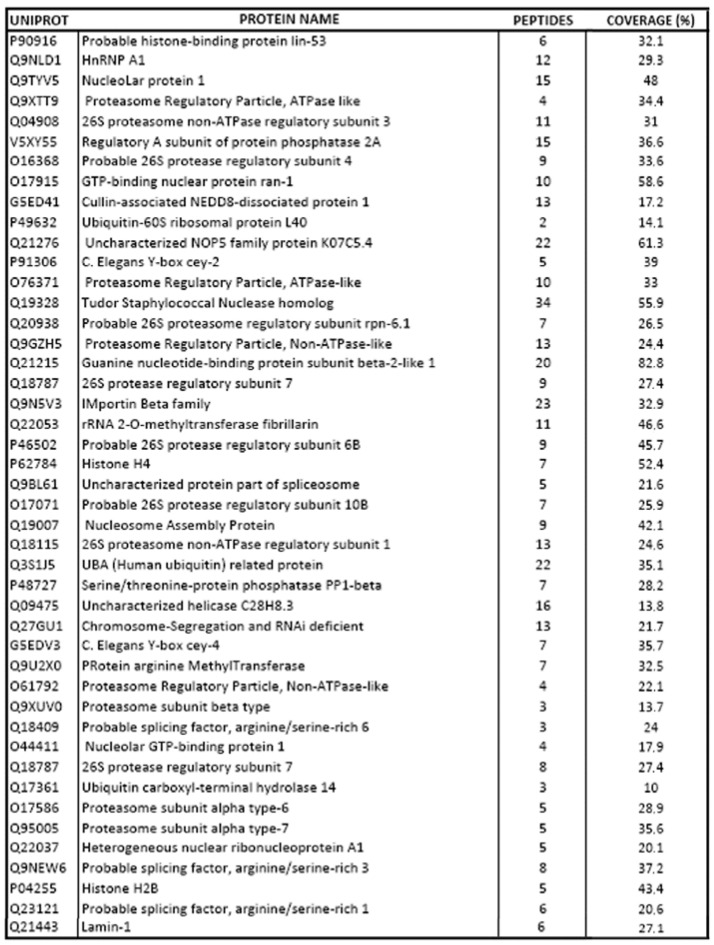
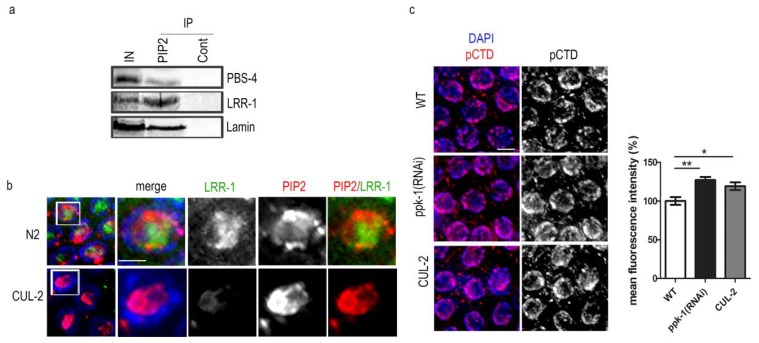
One of the most studied phosphoinositides is phosphatidylinositol 4,5-bisphosphate (PIP2), which localizes to the plasma membrane, nuclear speckles, small foci in the nucleoplasm, and to the nucleolus in mammalian cells. Here, we show that PIP2 also localizes to the nucleus in prophase I, during the gametogenesis of C. elegans hermaphrodite. The depletion of PIP2 by type I PIP kinase (PPK-1) kinase RNA interference results in an altered chromosome structure and leads to various defects during meiotic progression. We observed a decreased brood size and aneuploidy in progeny, defects in synapsis, and crossover formation. The altered chromosome structure is reflected in the increased transcription activity of a tightly regulated process in prophase I. To elucidate the involvement of PIP2 in the processes during the C. elegans development, we identified the PIP2-binding partners, leucine-rich repeat (LRR-1) protein and proteasome subunit beta 4 (PBS-4), pointing to its involvement in the ubiquitin⁻proteasome pathway.

Keywords: C. elegans; PPK-1; nucleus; phosphatidylinositol 4,5-bisphosphate.


Conflict of interest statement

The authors declare no conflict of interest.

Figures

Figure 1
Figure 1
Phosphatidylinositol 4,5-bisphosphate (PIP2) in C. elegans. (a) Indirect immunofluorescence of PIP2 in a dissected N2 C. elegans gonad. Nuclei are visualized by 4′,6-diamidino-2-phenylindole (DAPI); (b) indirect immunofluorescence of PIP2 in dissected gonad in ppk-1(RNAi) background. Asterisks mark the distal tip; the transition zone is underlined; the scale bar is 20 µm. The sheath cells’ signal is the unspecific staining of a secondary antibody; (c) dot blot detection of PIP2 upon single worm rrf-1(pk1417) whole body lysis in ppk-1(RNAi) or L4440 (WT) background; dot blot I magnified 2×. (d) indirect immunofluorescence of PIP2 in embryogenesis of C. elegans N2 strain. Arrows point to pronuclei; the scale bar is 5 µm; (e) co-localization of anti-PIP2 (red) and anti-NOP-1 (green) in N2 strain germ cell nucleus. Scale bar is 1 µm. Region of interest (ROI1) and ROI2 lines represent the regions of interest for the measured colocalization in pachytene nucleus; (f) co-localization of anti-PIP2 (red) and anti-NOP-1 (green) in N2 strain 5-cell stage embryo. Scale bar is 10 µm; (g) quantification of brood size, number of fertilized embryos produced by individual hermaphrodites, rrf-1(pk1417) worm in ppk-1(RNAi) or L4440 (WT) background; (N (number of biological replicates) = 3, n (number of animals per replica) = 30). Statistical comparisons between the worms were performed using Student t-test: n.s.—non-significant; * p ≤ 0.05; ** p ≤ 0.01; *** p ≤ 0.001.
Figure 2
Figure 2
Increased number of DAPI stained bodies. (a) DAPI staining of oocytes DNA in the proximal part of dissected rrf-1(pk1417) gonads in ppk-1(RNAi) or WT (L4440) background. Numbers represents the oocytes’ positions. Scale bar represents 15 µm; (b) the breadth of oocytes chromosomes phenotypes observed in ppk-1(RNAi) or WT (L4440). The graph represents the % of nuclei with standard chromosome numbers and aneuploidy in ppk-1(RNAi) or WT oocytes (N = 3, n = 10). Scale bar represents 2.5 µm.
Figure 3
Figure 3
Evidence for increased transcription upon ppk-1(RNAi) in the germ cell nuclei. (a) Indirect immunofluorescence of pCTD of RNA polymerase II in ppk-1(RNAi) or L4440 (WT) germ cell nuclei. The graph represents the mean fluorescence intensity measured from N = 3 and n = 60; (b) indirect immunofluorescence of the subunit 116 of RNA polymerase I in ppk-1(RNAi) or L4440 (WT) germ cell nuclei. The graph represents the mean fluorescence intensity measured from N = 3 and n = 60; (c,d) indirect immunofluorescence of nascent RNA labelled by 5-Fluorouridine (5-FU) in ppk-1(RNAi) or L4440 (WT) background in the time course (N = 3, n = 40); (e) indirect immunofluorescence of nascent RNA in ppk-1(RNAi) or L4440 (WT) background upon actinomycin D treatment (N = 3, n = 30). Scale bars represent 5 µm. Statistical comparisons between the worms were performed using the Student t-test: n.s.—non-significant; * p ≤ 0.05; ** p ≤ 0.01; *** p ≤ 0.001.
Figure 4
Figure 4
Increased apoptosis upon ppk-1(RNAi) in CED-1::GFP C. elegans line. (a) CED-1::GFP visualization in ppk-1(RNAi) worms or L4440 (WT) as a control for the background. Red arrows point to the sheath cell localization of CED-1. Scale bar represents 50 µm. (N = 3 and n = 30); (b) graphical representation of the number of CED-1 positive sheath cells in the WT or ppk-1(RNAi) background, with or without CEP-1 (N = 3, n = 30). Statistical comparisons between worms were performed using the Student t-test: n.s.—non-significant; * p ≤ 0.05; ** p ≤ 0.01; *** p ≤ 0.001.
Figure 5
Figure 5
Meiotic defects upon ppk-1(RNAi). (a) HIM-8::mCherry visualization in the ppk-1(RNAi) or L4440 background. The graph represents the number of observed HIM-8 foci during prophase I (N = 3 and n = 30); (b) COSA-1::GFP foci vizualization in the ppk-1(RNAi) or L4440 background. The graph represents the % of pachytene nuclei with the given numbers of the COSA-1 foci (N = 3 and n = 20). Scale bars represent 1 µm; (c,d) indirect immunofluorescence detection of him 3 paralog (HTP3) and synaptonemal protein 1 (SYP1) in WT or ppk-1(RNAi) background. The arrows point to impaired anti-HTP3 and anti-SYP1 co-localization. Scale bars represent 1 µm. Statistical comparisons between the worms were performed using the Student t-test: n.s.—non-significant; * p ≤ 0.05; ** p ≤ 0.01; *** p ≤ 0.001.
Figure 6
Figure 6
Proteins identified in mas-spectrometry analysis as potential PIP2-binding partners.
Figure 7
Figure 7
PIP2 interacts with leucine rich repeate protein (LRR-1) and proteasome beta subunit 4 (PBS-). (a) Immunoprecipitation by anti-PIP2 and control mouse anti-IgM from C. elegans nuclear lysate; (b) indirect immunofluorescence of anti-LRR-1 (green) and anti-PIP2 (red) in N2 and CUL-2 background germ cell nuclei. Scale bar represents 2 µm; (c) indirect immunofluorescence of pCTD of RNA polymerase II in ppk-1(RNAi) or L4440 (WT) germ cell nuclei. The graph represents the mean fluorescence intensity measured from N = 3 and n = 30. Scale bar represents 5 µm. Statistical comparisons between the worms were performed using the Student t-test: n.s.—non-significant; * p ≤ 0.05; ** p ≤ 0.01; *** p ≤ 0.001.

Similar articles

Cited by

References

    1. MacQueen A.V., Villeneuve A.M. Nuclear reorganization and homologous chromosome pairing during meiotic prophase require C. elegans chk-2. Genes Dev. 2001;15:1674–1687. doi: 10.1101/gad.902601. - DOI - PMC - PubMed
    1. Nicklas B.R. Chromosome segregation mechanisms. Genetics. 1974;78:205–213. - PMC - PubMed
    1. Ostergren G. The mechanism of co-orientation in bivalents and multivalents. Hereditas. 1951;37:85–156. doi: 10.1111/j.1601-5223.1951.tb02891.x. - DOI
    1. Bell O., Tiwari V.K., Thoma N.H., Schubeler D. Determinants and dynamics of genome accessibility. Nat. Rev. Genet. 2011;12:554–564. doi: 10.1038/nrg3017. - DOI - PubMed
    1. Wang X., Zhao Y., Wong K., Ehlers P., Kohara Y., Jones S.J., Marra M.A., Holt R.A., Moerman D.G., Hansen D. Identification of genes expressed in the hermaphrodite germ line of C. elegans using SAGE. BMC Genom. 2009;10:213. doi: 10.1186/1471-2164-10-213. - DOI - PMC - PubMed

MeSH terms

Substances

LinkOut - more resources