

Clinical and Electrophysiological Differences between Subjects with Dysphonetic Dyslexia and Non-Specific Reading Delay
- PMID: 30201924
- PMCID: PMC6162778
- DOI: 10.3390/brainsci8090172
Clinical and Electrophysiological Differences between Subjects with Dysphonetic Dyslexia and Non-Specific Reading Delay
Abstract
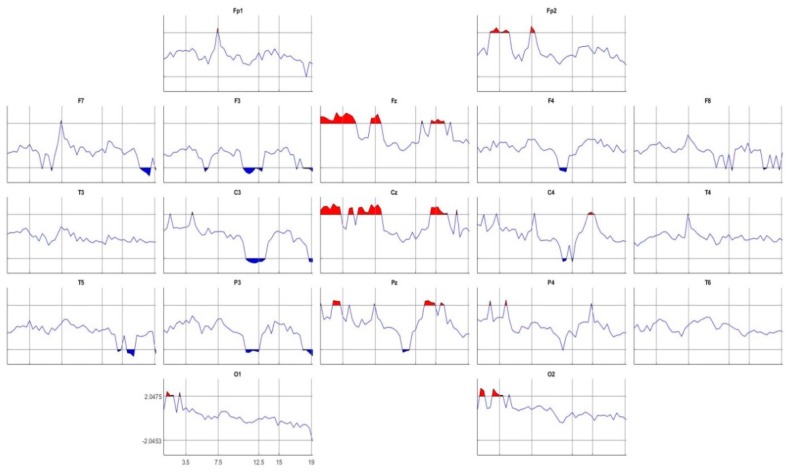
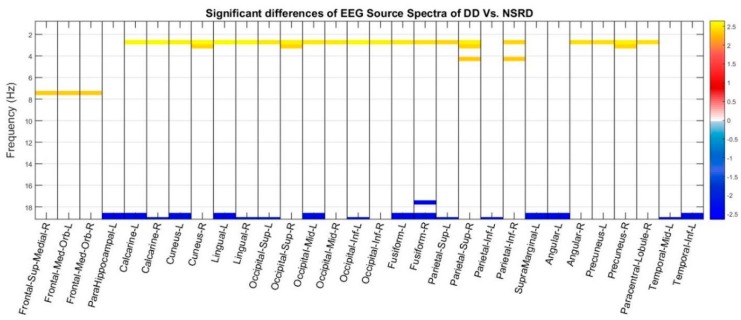
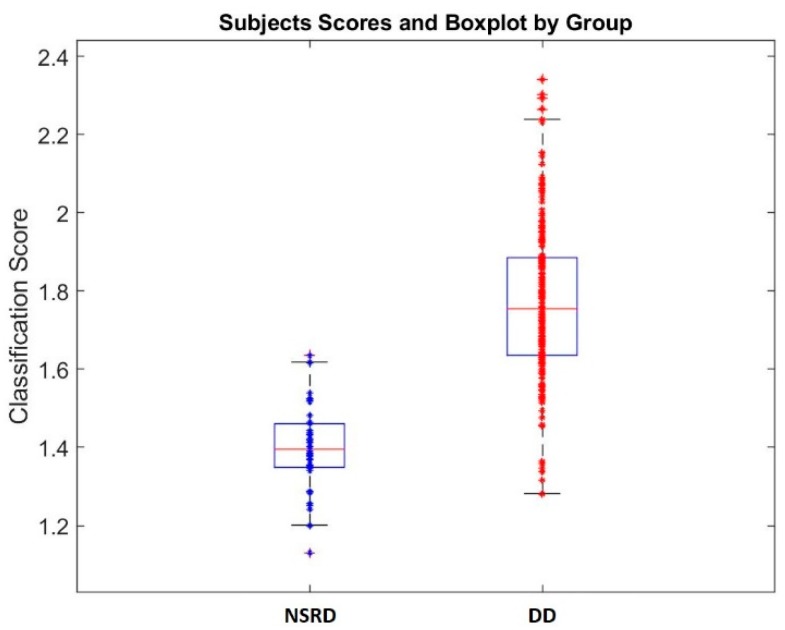
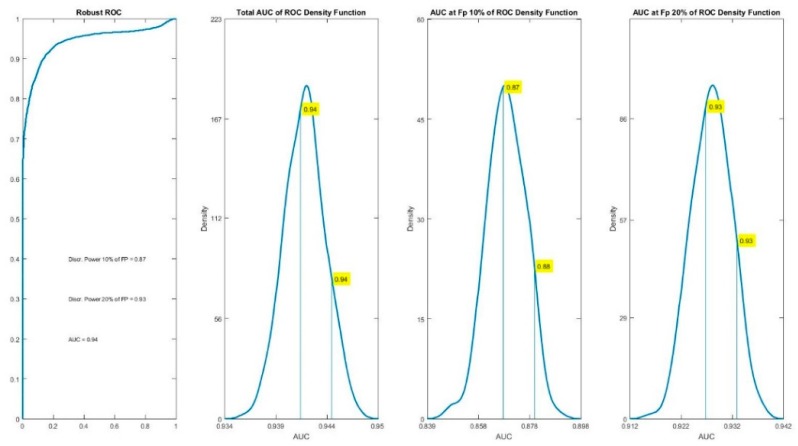
Reading is essentially a two-channel function, requiring the integration of intact visual and auditory processes both peripheral and central. It is essential for normal reading that these component processes go forward automatically. Based on this model, Boder described three main subtypes of dyslexia: dysphonetic dyslexia (DD), dyseidetic, mixed and besides a fourth group defined non-specific reading delay (NSRD). The subtypes are identified by an algorithm that considers the reading quotient and the % of errors in the spelling test. Chiarenza and Bindelli have developed the Direct Test of Reading and Spelling (DTRS), a computerized, modified and validated version to the Italian language of the Boder test. The sample consisted of 169 subjects with DD and 36 children with NSRD. The diagnosis of dyslexia was made according to the DSM-V criteria. The DTRS was used to identify the dyslexia subtypes and the NSRD group. 2⁻5 min of artefact-free EEG (electroencephalogram), recorded at rest with eyes closed, according to 10⁻20 system were analyzed. Stability based Biomarkers identification methodology was applied to the DTRS and the quantitative EEG (QEEG). The reading quotients and the errors of the reading and spelling test were significantly different in the two groups. The DD group had significantly higher activity in delta and theta bands compared to NSRD group in the frontal, central and parietal areas bilaterally. The classification equation for the QEEG, both at the scalp and the sources levels, obtained an area under the robust Receiver Operating Curve (ROC) of 0.73. However, we obtained a discrimination equation for the DTRS items which did not participate in the Boder classification algorithm, with a specificity and sensitivity of 0.94 to discriminate DD from NSRD. These results demonstrate for the first time the existence of different neuropsychological and neurophysiological patterns between children with DD and children with NSRD. They may also provide clinicians and therapists warning signals deriving from the anamnesis and the results of the DTRS that should lead to an earlier diagnosis of reading delay, which is usually very late diagnosed and therefore, untreated until the secondary school level.
Keywords: QEEG; direct test of reading and spelling (DTRS); dysphonetic dyslexia; non-specific reading delay; quantitative EEG tomography; source localization, VARETA, Biomarkers.
Conflict of interest statement
The authors declare no conflict of interest.
Figures
Similar articles
-
Resting EEG effective connectivity at the sources in developmental dysphonetic dyslexia. Differences with non-specific reading delay.Int J Psychophysiol. 2020 Jul;153:135-147. doi: 10.1016/j.ijpsycho.2020.04.021. Epub 2020 May 5. Int J Psychophysiol. 2020. PMID: 32387396
-
Directional motion contrast sensitivity in developmental dyslexia.Vision Res. 2006 Oct;46(20):3291-303. doi: 10.1016/j.visres.2006.05.009. Epub 2006 Jul 7. Vision Res. 2006. PMID: 16824575
-
Reading disability subtypes and the test of memory and learning.Arch Clin Neuropsychol. 1999 Apr;14(3):317-39. Arch Clin Neuropsychol. 1999. PMID: 14590599
-
How the visual aspects can be crucial in reading acquisition? The intriguing case of crowding and developmental dyslexia.J Vis. 2015 Jan 14;15(1):15.1.8. doi: 10.1167/15.1.8. J Vis. 2015. PMID: 25589292 Review.
-
Reading and spelling disorders: clinical features and causes.Eur Child Adolesc Psychiatry. 1999;8 Suppl 3:2-12. doi: 10.1007/pl00010689. Eur Child Adolesc Psychiatry. 1999. PMID: 10638363 Review.
Cited by
-
EEG correlates of developmental dyslexia: a systematic review.Ann Dyslexia. 2023 Jul;73(2):184-213. doi: 10.1007/s11881-022-00273-1. Epub 2022 Nov 22. Ann Dyslexia. 2023. PMID: 36417146 Free PMC article.
-
Individual Alpha Peak Frequency, an Important Biomarker for Live Z-Score Training Neurofeedback in Adolescents with Learning Disabilities.Brain Sci. 2021 Jan 28;11(2):167. doi: 10.3390/brainsci11020167. Brain Sci. 2021. PMID: 33525458 Free PMC article.
-
Semantic Priming and Its Link to Verbal Comprehension and Working Memory in Children with Learning Disorders.Brain Sci. 2023 Jul 1;13(7):1022. doi: 10.3390/brainsci13071022. Brain Sci. 2023. PMID: 37508954 Free PMC article.
-
An Overview on Electrophysiological and Neuroimaging Findings in Dyslexia.Iran J Psychiatry. 2023 Oct;18(4):503-509. doi: 10.18502/ijps.v18i4.13638. Iran J Psychiatry. 2023. PMID: 37881421 Free PMC article.
-
Electroencephalography-Based Neuroinflammation Diagnosis and Its Role in Learning Disabilities.Diagnostics (Basel). 2025 Mar 18;15(6):764. doi: 10.3390/diagnostics15060764. Diagnostics (Basel). 2025. PMID: 40150106 Free PMC article.
References
-
- Boder E., Jarrico S. The Boder Test of Reading-Spelling Patterns. Grune Stratton; New York, NY, USA: 1982.
-
- Chiarenza G.A., Bindelli D. Il test diretto di lettura e scrittura (DTLS): Versione computerizzata e dati normativi. Giornale Neuropsichiatria dell’Età Evolutiva. 2001;21:163–179.
-
- Luisi A., Ruggerini C. Dislessia e Disagio Pedagogico, un Approccio Interdisciplinare per la Diagnosi e L’aiuto. Editrice TEMI; Bologna, Italy: 1997.
-
- Chiarenza G.A., Di Pietro S.F. La dislessia e i suoi sottotipi. Modelli clinici e risvolti applicativi nel trattamento della dislessia evolutiva. In: Sidoti E., editor. Dentro la Dislessia. Junior Edizioni; Brescia, Italy: 2014. pp. 107–132.
Grants and funding
LinkOut - more resources
Full Text Sources
Other Literature Sources
