. 2018 Sep 10;9(1):3662.
doi: 10.1038/s41467-018-06098-0.

Different patterns of clonal evolution among different sarcoma subtypes followed for up to 25 years

Affiliations

Different patterns of clonal evolution among different sarcoma subtypes followed for up to 25 years

Jakob Hofvander et al. Nat Commun. .

Abstract

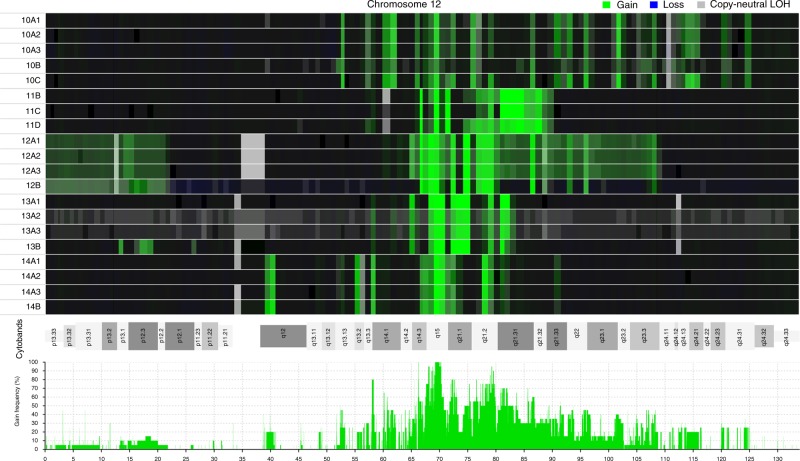
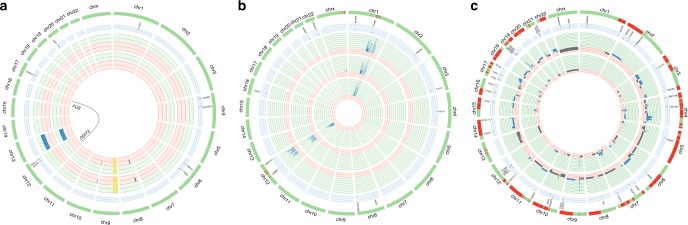
To compare clonal evolution in tumors arising through different mechanisms, we selected three types of sarcoma-amplicon-driven well-differentiated liposarcoma (WDLS), gene fusion-driven myxoid liposarcoma (MLS), and sarcomas with complex genomes (CXS)-and assessed the dynamics of chromosome and nucleotide level mutations by cytogenetics, SNP array analysis and whole-exome sequencing. Here we show that the extensive single-cell variation in WDLS has minor impact on clonal key amplicons in chromosome 12. In addition, only a few of the single nucleotide variants in WDLS were present in more than one lesion, suggesting that such mutations are of little significance in tumor development. MLS displays few mutations other than the FUS-DDIT3 fusion, and the primary tumor is genetically sometimes much more complex than its relapses, whereas CXS in general shows a gradual increase of both nucleotide- and chromosome-level mutations, similar to what has been described in carcinomas.


Conflict of interest statement

The authors declare no competing interests.

Figures

Fig. 1
Fig. 1
Schematic illustration of clonal evolution in 20 sarcomas (C1–C20). C1–C9 are gene fusion-driven myxoid liposarcomas (MLS), C10–C14 are amplicon-driven well-differentiated liposarcomas (WDLS), and C15–C20 are sarcomas with complex genotypes (CXS). a Time intervals (in months) between lesions that were analyzed with regard to chromosomal aberrations and nucleotide level mutations. Each sample is indicated by a filled circle; blue samples were analyzed by whole-exome sequencing (WES), SNP arrays (GCS), and chromosome banding analysis (CA), green samples by GCS and CA, and red samples only by CA; larger filled circles represent lesions from which multiple samples were analyzed for assessment of intratumoral heterogeneity. Each line starts with the primary tumor, followed by local recurrences (LR) and/or metastases (M). b Diagram showing the number of non-synonymous exonic variants (ESV) detected at WES, as well as the extent of shared mutations among different samples and lesions from the same patient. c Diagram showing the number of clonal chromosomal breakpoints detected at GCS and, for MLS also including CB, as well as the extent of shared aberrations among different samples and lesions from the same patient. Figures for C8 and C9 are based on CB only
Fig. 2
Fig. 2
Heat map and frequency distribution of amplicons in chromosome 12. Twenty samples from 12 lesions from five patients with well-differentiated liposarcomas, representing amplicon-driven sarcomas, were analyzed. a The upper panel, based on the log ratios, shows that the extension of gains (green) and copy-neutral loss of heterozygosity (LOH) is highly similar among different samples from the same patient. Note that samples 10A1–A3 (three samples from primary tumor) and 10C (local recurrence 2; LR2) are more similar to each other than 10A1–3 to 10B or 10B to 10C; the same is true for samples 11B (LR1) and 11D (LR3) in comparison to 11C (LR2). b The lower panel, based on the copy number segmentation, shows the frequency of distinct amplicons in chromosome 12 among the 20 samples. Only two segments in 12q14–15, with a combined length of 856 kb, were amplified in all samples
Fig. 3
Fig. 3
Circos plots illustrating different modes of clonal evolution in sarcomas with different genetic backgrounds. a A fusion-driven myxoid liposarcoma (MLS), b an amplicon-driven well-differentiated liposarcoma (WDLS), and c a myxofibrosarcoma (MFS) with a complexly rearranged genome. The red/green inner circles represent the location and amplitude of the allelic imbalances; blue is gain, gray is loss and yellow background indicates loss of heterozygosity. The number of red fields can vary between lesions depending on what is considered the expected number of copies for that lesion in relation to the ploidy level (2n–3n), the number of green fields varies between patients and is determined by the gain with highest number of copies in that patient. The circles are ordered chronologically, starting from the center with the first lesion. The light blue circles represent the location of the variants reported by the whole-exome sequencing (WES) in the same order. Red on the schematic green chromosomes represents differences in genomic changes at SNP array (GCS) between lesions. Both the primary tumor (PT) and the local recurrence (LR) 22 months later from the MLS (case 1) displayed few and mostly identical GCS and ESV. In three lesions from a WDLS (case 10), the GCS of the PT were more similar to those in the second LR occurring after 306 months than to those in the first LR occurring after 197 months. The MFS (case 19) had no less than 209 GCS, but only 39 ESV. While many of the ESV were shared by the PT and the metastasis occurring 86 months later, the GCS overlap was only 0.39. Circos plots for all 20 sarcomas analyzed by both SNP array and WES are shown in Supplementary Fig. 2

References

    1. Cahill DP, Kinzler KW, Vogelstein B, Lengauer C. Genetic instability and darwinian selection in tumours. Trends Cell Biol. 1999;9:M57–M60. doi: 10.1016/S0962-8924(99)01661-X. - DOI - PubMed
    1. Hanahan D, Weinberg RA. Hallmarks of cancer: the next generation. Cell. 2011;144:646–674. doi: 10.1016/j.cell.2011.02.013. - DOI - PubMed
    1. Loeb LA. Human cancers express a mutator phenotype: hypothesis, origin, and consequences. Cancer Res. 2016;76:2057–2059. doi: 10.1158/0008-5472.CAN-16-0794. - DOI - PMC - PubMed
    1. Nowell PC. The clonal evolution of tumor cell populations. Science. 1976;194:23–28. doi: 10.1126/science.959840. - DOI - PubMed
    1. Loeb LA. Mutator phenotype may be required for multistage carcinogenesis. Cancer Res. 1991;51:3075–3079. - PubMed

Publication types