. 2018 Sep 10;8(1):13536.
doi: 10.1038/s41598-018-31910-8.

Platelet activation and prothrombotic properties in a mouse model of peritoneal sepsis

Affiliations

Platelet activation and prothrombotic properties in a mouse model of peritoneal sepsis

Fanny Vardon Bounes et al. Sci Rep. .

Abstract

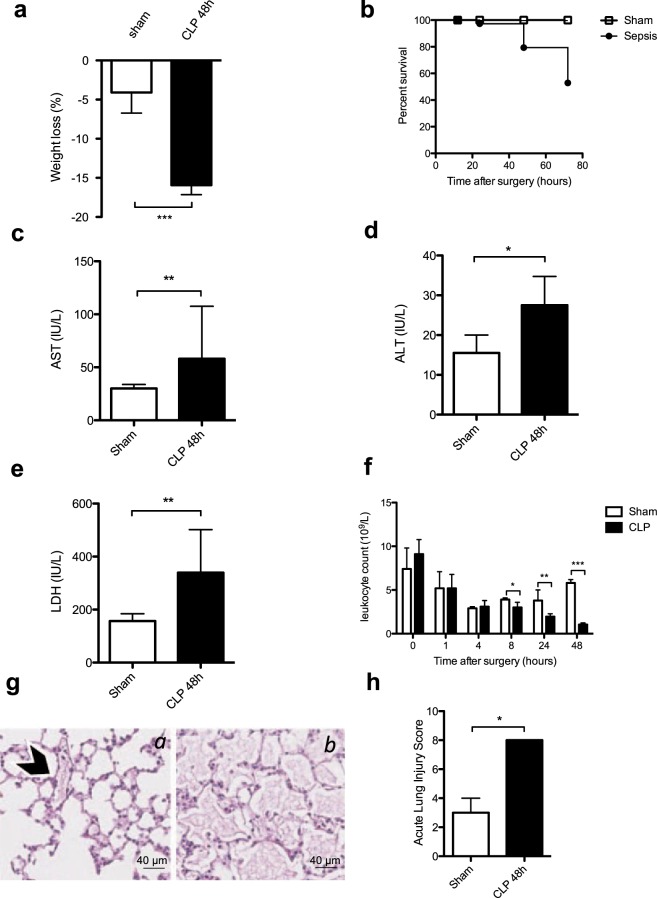
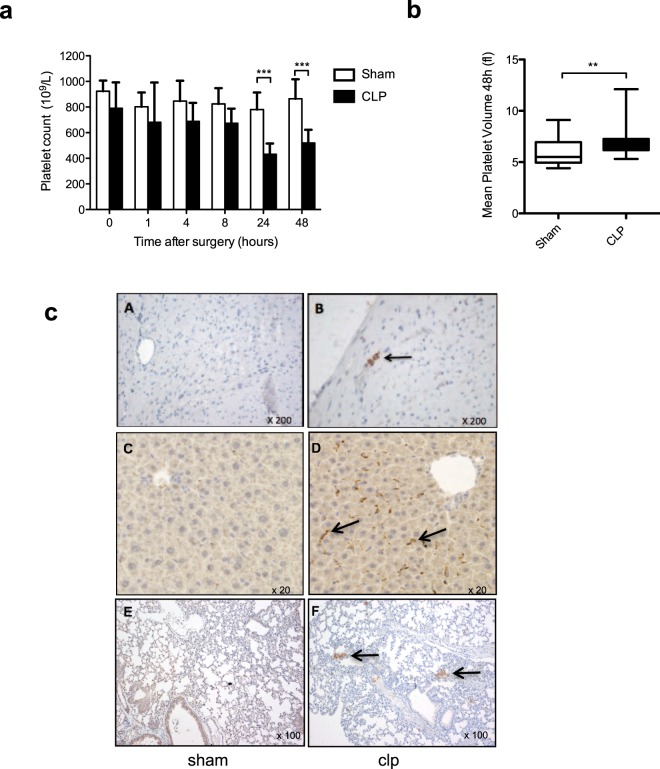
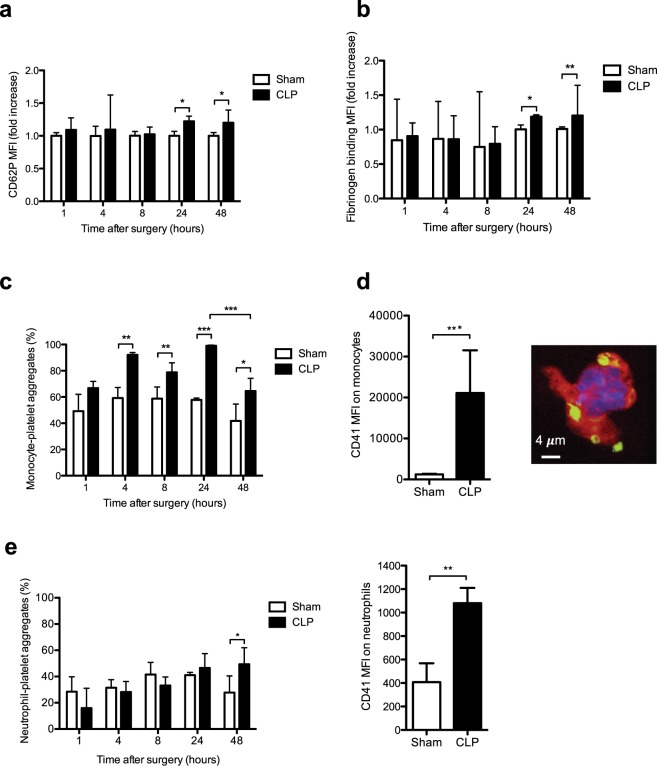
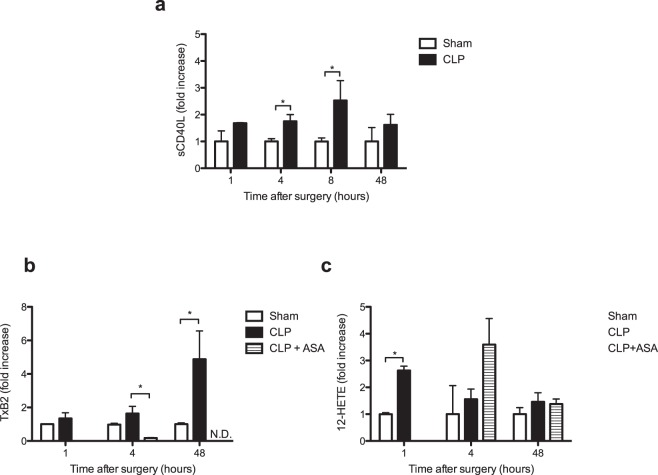
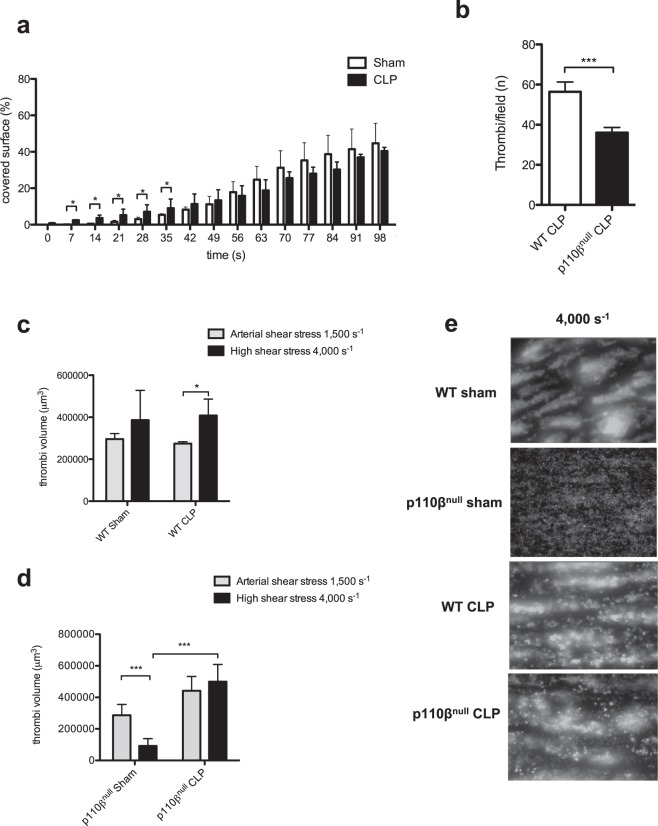
Sepsis is associated with thrombocytopenia and microvascular thrombosis. Studies have described platelets implication in this pathology but their kinetics of activation and behavior remain poorly known. We show in a mouse model of peritonitis, the appearance of platelet-rich thrombi in organ microvessels and organ damage. Complementary methods are necessary to characterize platelet activation during sepsis as circulating soluble markers and platelet-monocyte aggregates revealed early platelet activation, while surface activation markers were detected at later stage. A microfluidic based ex-vivo thrombosis assay demonstrated that platelets from septic mice have a prothrombotic behavior at shear rate encountered in microvessels. Interestingly, we found that even though phosphoinositide-3-kinase β-deficient platelet mice formed less thrombi in liver microcirculation, peritoneal sepsis activates a platelet alternative pathway to compensate the otherwise mandatory role of this lipid-kinase to form stable thrombi at high shear rate. Platelets are rapidly activated during sepsis. Thrombocytopenia can be attributed in part to platelet-rich thrombi formation in capillaries and platelet-leukocytes interactions. Platelets from septic mice have a prothrombotic phenotype at a shear rate encountered in arterioles. Further studies are necessary to unravel molecular mechanisms leading to this prothrombotic state of platelets in order to guide the development of future treatments of polymicrobial sepsis.


Conflict of interest statement

The authors declare no competing interests.

Figures

Figure 1
Figure 1
Characterization of sepsis after cecal ligation and puncture. (a) Weight loss was increased 48 hours post procedure in the CLP group of mice (black bar) compared to the sham group (white bar). Results are expressed as percentage of weight loss and are median [25–75th percentiles] (n = 14, ***p < 0.001). (b) Survival was quantified at 72 hours post CLP. At 72 h, the overall mortality was 47% in CLP group. Results are expressed as percentage of survival (n = 36, p < 0.05). Biochemical analysis were performed with a PENTRA 400 ABXc analyzer for aspartate aminotransferase (AST) (c), alanine aminotransferase (ALT) (d) and lactate dehydrogenase (LDH) (e). Results are presented as median [25–75th percentiles] (n = 6, *p < 0.05, **p < 0.01, ***p < 0.001). (f) Leukocyte count was measured 48 h post surgery and compared in sham versus CLP group. Results are expressed as median [25–75th percentiles] (n = 6 to 30 *p < 0.05,**p > 0.001, ***p < 0.0001). (g) Representative images of lung sections stained with hematoxylin and eosin 48 h post surgery. The arrowhead shows a blood vessel section which integrity is conserved in a sham-operated mouse (a). In the CLP group of mice (b) important alveolar injuries are observed as quantified by the Acute Lung Injury (ALI) Score 48 h post CLP induction (h). Results are median ± IQR of 7 independent experiments (*p < 0.05) and representative images are shown (g).
Figure 2
Figure 2
Sepsis promotes thrombocytopenia and thrombus formation in lung capillaries after cecal ligation and puncture. (a) Whole blood platelet count kinetics at 48 h post CLP surgery. Results are expressed as platelets x 109/L and are median ± IQR of 30 independent experiments (**p < 0.01, ***p < 0.001). (b) Comparison of Mean Platelet Volume (MPV) 48 h post CLP surgery. Whisker boxes are constructed as follow: min, max, median, 25–75th percentiles (n = 30, **p < 0.01). (c) Representative histological sections of heart (A,B), liver (C,D) and lung (E,F) tissues 48 h post surgery. Sections from CLP (B,D,F) or sham-operated animals (A,C,E) as controls were stained with Masson’s trichrome and platelets were specifically labeled with an anti-αIIb antibody. Arrows highlight platelet-rich thrombi in microvessels. Images (x20, x100 and x200 magnification) shown are representative of 3 independent experiments.
Figure 3
Figure 3
Expression of surface platelet activation markers and elevation of leukocyte-platelets interactions during sepsis. (a) Expression of the surface platelet activation marker CD62P analyzed by flow cytometry during sepsis. (b) Activation of αIIbβ3 (GpIIbIIIa) integrin at the platelet surface assessed by oregon green fibrinogen binding and flow cytometry analysis. Results are expressed as median fluorescence intensity and are median fold increase ± IQR of 6 to 8 independent experiments (*p < 0.05, **p < 0.01). (c) Whole blood monocyte-platelet aggregates quantified at different times post surgery in sham and CLP-operated mice. Results are expressed as percentage of monocyte-platelet aggregates and are median ± IQR of 4 to 6 independent experiments (*p < 0.05, **p < 0.01, ***p < 0.001). (d) Density of platelets per monocytes. The MFI values of the platelet marker (CD41) on monocytes was measured 24 h after CLP by flow cytometry to evaluate the platelet density per monocyte (left panel). After sorting by flow cytometry the platelet-monocyte aggregates were spin down onto poly-lysine coated slides and observed by confocal microscopy (right panel). A representative confocal image is show to illustrate the interaction of platelets (CD41, green) and monocyte (CD115, red) 24 h post CLP. The monocyte nucleus was labeled with DAPI (blue). (e) Whole blood neutrophil-platelet aggregates quantified at different times after surgery in sham and CLP-operated mice. Results are expressed as percentage of neutrophil-platelet aggregates and are median ± IQR of 3 to 7 independent experiments (*p < 0.05) (left panel). The MFI values of the platelet marker (CD41) on neutrophils was measured 48 h after CLP to evaluate the platelet density per neutrophil (right panel).
Figure 4
Figure 4
Early elevation of soluble markers of platelet activation during sepsis. (a) Levels of plasma soluble CD40L (sCD40L) and eicosanoids at different times in sham and CLP mice. Results are expressed as fold increase and are median (25–75th percentile) of 4 to 7 independent experiments (*p < 0.05). (b) Kinetics of TxB2, the stable metabolite of TxA2, and (c) 12-HETE production in plasma of sham, CLP-operated mice and CLP-operated mice treated with aspirin. The quantification was performed by a lipidomics LC-MS/MS technique. Results are expressed as fold increase and are median (25–75th percentile) of 3 to 6 independent experiments (*p < 0.05, **p < 0.01). N.D., not detectable.
Figure 5
Figure 5
Platelet pro-thrombotic properties at arterial flow and bypass of PI3Kβ for thrombus stability at high shear rate during sepsis. (a) DIOC6-labeled platelets in whole blood from the CLP (black bar) or sham (white bar) mice 48 h post intervention were perfused through a collagen-coated microcapillary at a physiological arterial rate of 1500 s−1. Surface coverage (%) by fluorescent platelets was analyzed using ImageJ software. Results shown are median ± IQR of 4 independent experiments (*p < 0.05). (b) Platelet-rich thrombi formed in the liver 48 h post CLP were detected as in Fig. 2 (C-D) and quantified. 5 mice from each group and 5 to 10 field per mice were analyzed. Results are expressed as median ± IQR (***p < 0.001). (ce) DIOC6-labeled platelets in whole blood from platelet PI3Kβ-deficient mice (p110βnull) or wild type mice (WT) were perfused through a collagen-coated microcapillary at a physiological arterial shear rate of 1500 s−1, followed by a high shear rate of 4000 s−1. Thrombi volumes (μm3) were analyzed using ImageJ software. Results are expressed as median ± IQR of 4 to 6 independent experiments (***p < 0.001). (e) Representative images showing the platelet thrombi remaining after 1 min of high shear rate (4000 s−1).

Similar articles

Cited by

References

    1. Fleischmann C, et al. Assessment of Global Incidence and Mortality of Hospital-treated Sepsis. Current Estimates and Limitations. Am J Respir Crit Care Med. 2016;193:259–272. doi: 10.1164/rccm.201504-0781OC. - DOI - PubMed
    1. Vincent J-L, et al. Assessment of the worldwide burden of critical illness: the Intensive Care Over Nations (ICON) audit. Lancet Respir Med. 2014;2:380–386. doi: 10.1016/S2213-2600(14)70061-X. - DOI - PubMed
    1. Gaieski DF, Edwards JM, Kallan MJ, Carr BG. Benchmarking the incidence and mortality of severe sepsis in the United States. Critical Care Medicine. 2013;41:1167–1174. doi: 10.1097/CCM.0b013e31827c09f8. - DOI - PubMed
    1. Singer M, et al. The Third International Consensus Definitions for Sepsis and Septic Shock (Sepsis-3) JAMA. 2016;315:801–10. doi: 10.1001/jama.2016.0287. - DOI - PMC - PubMed
    1. Jenne CN, Kubes P. Platelets in inflammation and infection. Platelets. 2015;26:286–292. doi: 10.3109/09537104.2015.1010441. - DOI - PubMed

Publication types

MeSH terms

Substances