. 2018 Oct;19(10):1126-1136.
doi: 10.1038/s41590-018-0200-5. Epub 2018 Sep 10.

An immunoregulatory and tissue-residency program modulated by c-MAF in human TH17 cells

Affiliations

An immunoregulatory and tissue-residency program modulated by c-MAF in human TH17 cells

Dominik Aschenbrenner et al. Nat Immunol. 2018 Oct.

Erratum in

Abstract

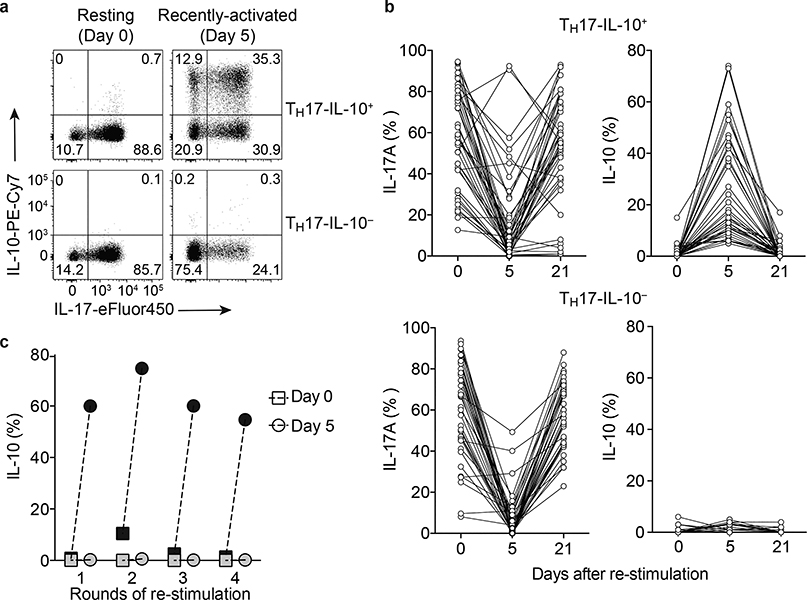
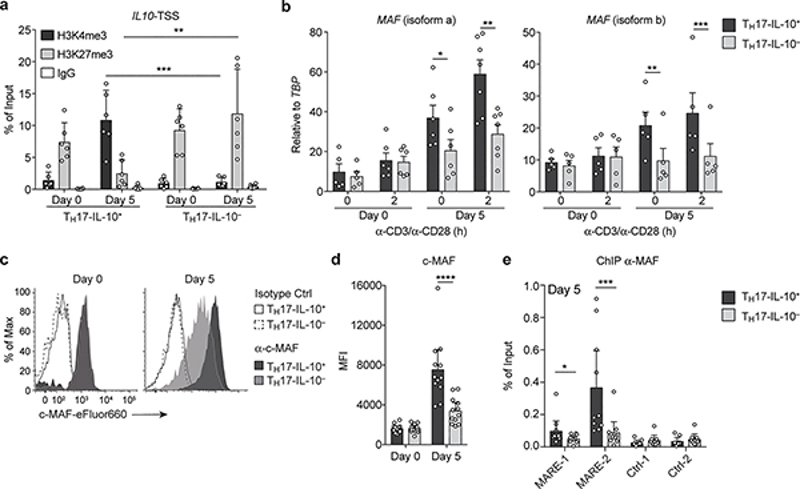
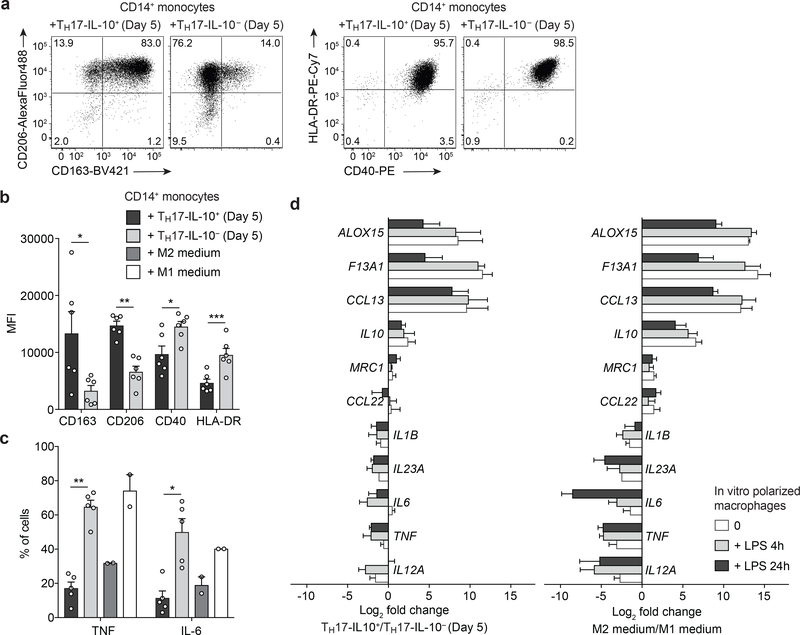
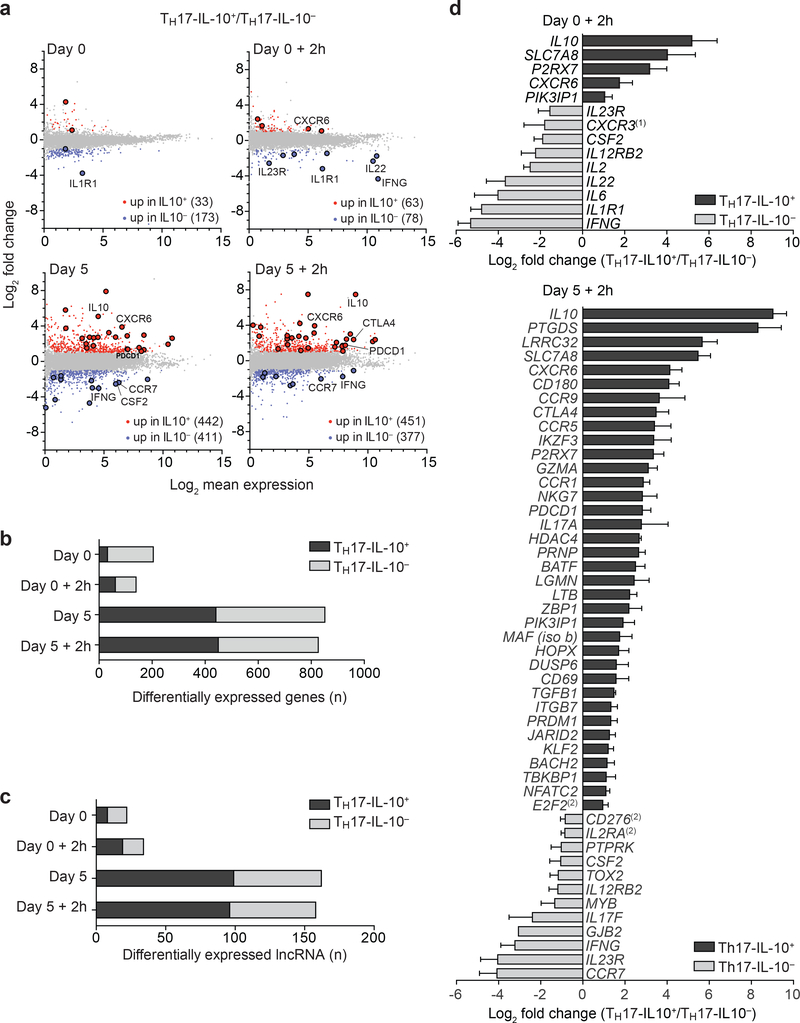
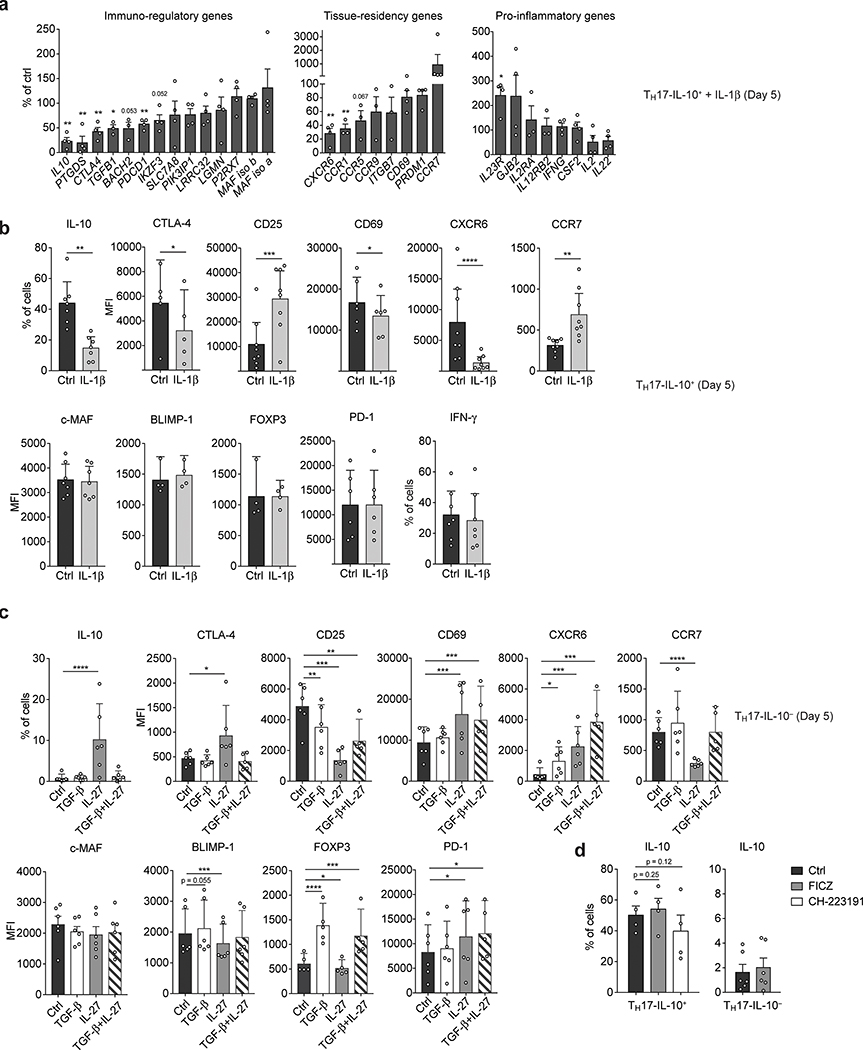
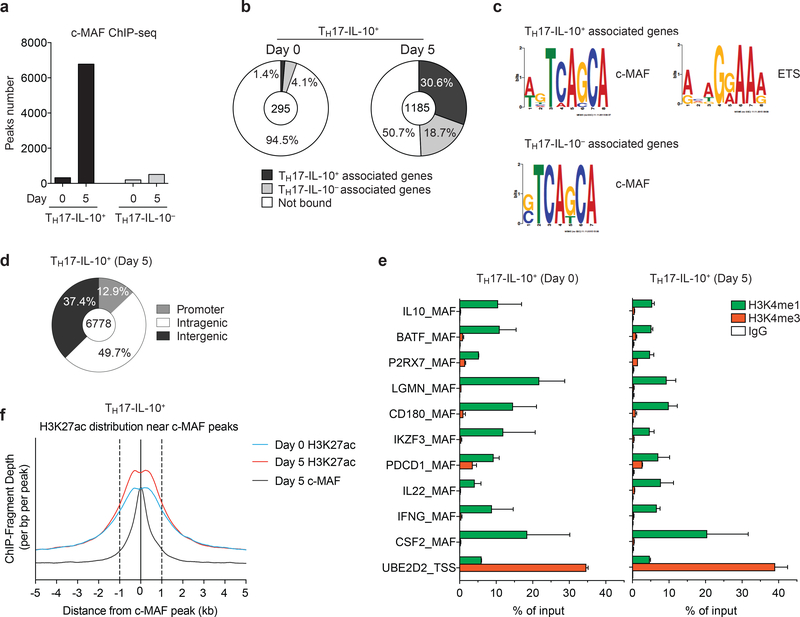
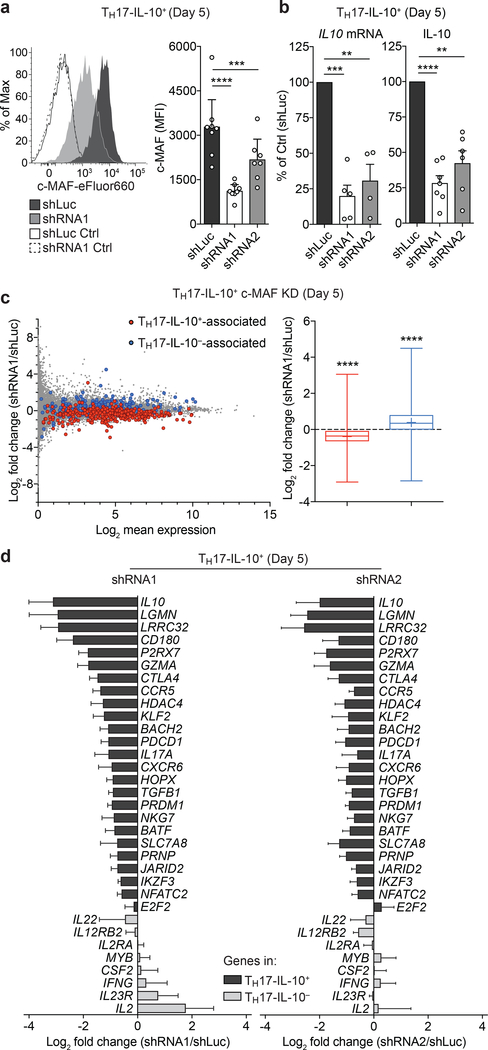
Different types of effector and memory T lymphocytes are induced and maintained in protective or pathological immune responses. Here we characterized two human CD4+ TH17 helper cell subsets that, in the recently activated state, could be distinguished on the basis of their expression of the anti-inflammatory cytokine IL-10. IL-10+ TH17 cells upregulated a variety of genes encoding immunoregulatory molecules, as well as genes whose expression is characteristic of tissue-resident T cells. In contrast, IL-10- TH17 cells maintained a pro-inflammatory gene-expression profile and upregulated the expression of homing receptors that guide recirculation from tissues to blood. Expression of the transcription factor c-MAF was selectively upregulated in IL-10+ TH17 cells, and it was bound to a large set of enhancer-like regions and modulated the immunoregulatory and tissue-residency program. Our results identify c-MAF as a relevant factor that drives two highly divergent post-activation fates of human TH17 cells and provide a framework with which to investigate the role of these cells in physiology and immunopathology.


Conflict of interest statement

Competing Financial Interests Statement

The authors declare no competing interests.

Figures

Figure 1.
Figure 1.. Transient production of IL-10 is a stable feature of a subset of human memory TH17 cells.
a,b. Production of IL-17 and IL-10 in TH17 clones analyzed in the resting state (Day 0 and Day 21) and in the recently activated state (Day 5) as measured by intracellular cytokine staining. The clones were divided according to their ability to produce IL-10 on Day 5. Representative staining of a TH17-IL-10+ clone (upper panel) and a TH17-IL-10- clone is shown in (a) and data from several TH17-IL-10+ and TH17-IL-10- clones representative of more than 15 experiments performed are shown in (b). The percentage of TH17-IL-10+ clones isolated from CCR6+CCR4+CXCR3 T cells in 13 experiments performed with different donors was 24.67 ± 3.22 (mean ± s.e.m). A similar frequency of TH17-IL-10+ clones was obtained from 4 experiments performed with different donors in which clones were isolated from IL-17-producing CCR6+CXCR3 T cells (25.6 ± 7.87%, mean ± s.e.m.). c. The capacity of TH17-IL-10+ clones (black symbols) and TH17-IL-10- clones (grey symbols) to produce IL-10 was evaluated after repeated rounds of re-stimulation with anti-CD3 and anti-CD28 antibodies, both on Day 0 (square) and on Day 5 (circle); at least 21 days separated two following re-stimulations. Data are representative of 4 independent experiments. In panel c and in all subsequent experiments, the TH17 cells analyzed were pools of TH17 clones that comprised ≥ 50% IL-17+ cells in the resting state.
Figure 2.
Figure 2.. Production of IL-10 by Day 5-activated TH17 cells requires chromatin remodeling and c-MAF up-regulation.
a. Abundance of histone modifications associated with gene transcription (H3K4me3) or repression (H3K27me3) at the IL10 TSS analyzed by ChIP in Day 0-resting and Day 5-activated TH17-IL-10+ and TH17-IL-10- cells. Data are represented as mean + 95% c.i. (n = 6). b. Expression of MAF isoforms a and b was measured in Day 0 and Day 5 TH17-IL-10+ and TH17-IL-10- clones by qPCR and normalized to the TATA-box binding protein gene (TBP). Shown are individual values and mean + s.e.m. (isoform a: Day 0, n = 5; Day 0 + 2h and Day 5, n = 6; Day 5 + 2h, n = 7; isoform b, n = 5). c. Expression of c-MAF as detected by intracellular staining in representative Day 0 and Day 5 TH17-IL-10+ and TH17-IL-10- cells. d. Mean fluorescence Intensity (MFI) of c-MAF staining in Day 0 and Day 5 IL-10+ and IL-10- TH17 clones. Data are represented as mean + 95% c.i., with each dot indicating a T cell clone pool (n = 12). e. c-MAF binding to two regions located in the IL10 promoter as determined by ChIP. A developmentally repressed locus (Ctrl_1) and a pericentromeric DNA repeat region (Ctrl_2) were used as negative controls. Data are represented as mean + 95% c.i., with each dot indicating a T cell clone pool (n = 10). *P < 0.05; **P < 0.01; ***P < 0.001; ****P < 0.0001, as determined by ratio paired t test. Data are representative of at least 3 independent experiments.
Figure 3.
Figure 3.. TH17-IL-10 and TH17-IL-10+ cells differentially polarize monocytes to M1 and M2 macrophages.
CD14+ monocytes were sorted from PBMCs and co-cultured with allogeneic Day 5-activated TH17-IL-10+ or TH17-IL-10- cells or in medium containing M1- or M2-inducing cytokines. a,b. Expression of M1- and M2-associated surface markers was determined after 24 h culture by flow cytometry (a, representative plots; b, mean + s.e.m.; n = 6). c. Production of TNF and IL-6 by CD14+CD4- monocytes assessed by intracellular staining after 48 h culture (mean + s.e.m.; TH17, n = 5; M1/M2 medium, n = 2). d. CD14+ monocytes were cultured in the presence of supernatants from Day 5 TH17-IL-10+or TH17- IL-10- cells or in M1/M2 medium for 7 days and then stimulated with LPS for the indicated time points. RNA was extracted and the expression of M1- and M2-associated genes was measured by qPCR (mean + s.e.m.; TH17 supernatants, n = 4; M1/M2 medium, n = 3). Genes are ranked according to their differential expression in M1/M2 medium-macrophages stimulated with LPS for 4 hours. *P < 0.05; **P < 0.01; ***P < 0.001, as determined by ratio paired t test. Data are from 3 (a-c) and 2 (d) independent experiments.
Figure 4.
Figure 4.. Distinct transcriptional programs in Day 5-activated TH17-IL-10+ and TH17- IL-10 cells.
a. MA plots of RNA-seq analysis of Day 0-resting and Day 5-activated TH17- IL-10+ and TH17-IL-10 cells, before or after 2 h stimulation with CD3/CD28 antibodies. Differentially expressed genes are marked in red (fold change ≥ 2) or blue (fold change ≤ 0.5). The genes selected for validation are highlighted by larger dots. b,c. Number of differentially expressed protein-coding genes (b) and lncRNAs (c) in the indicated samples. Data represent the average of two independent experiments. d. qPCR validation of a set of differentially expressed genes in Day 0 (upper panel) and Day 5 (lower panel) TH17-IL-10+ and TH17-IL-10 cells (mean + s.e.m; n ≥ 3, P-value ≤ 0.05 as determined by paired t test) ((1) P-value = 0.06; (2) fold change ≥ 1.8). In b, c and d, black bars indicate genes more expressed in TH17-IL-10+ cells and grey bars genes more expressed in TH17-IL-10 cells.
Figure 5.
Figure 5.. IL-27 and IL-lβ antagonistically promote the expression of TH17-IL-10+ and TH17-IL-10- associated genes.
a,b. TH17-IL-10+ cells were polyclonally activated with or without IL-1β (10 ng/ml) and the expression of representative immunoregulatory, tissue- residency and pro-inflammatory genes was measured on Day 5 at mRNA level by qPCR, after 2 h re-stimulation with CD3/CD28 antibodies (a, mean + s.e.m; n > 3), and at protein level by flow cytometry (b, mean + 95% c.i.; CXCR6, CD25 and CCR7, n = 8; IL-10, IFN-γ and c-MAF, n = 7; CD69 and PD-1, n = 6; CTLA-4, n = 5; BLIMP-1 and FOXP3, n = 4), after 5 h stimulation with PMA+I. c. TH17-IL-10- cells were polyclonally activated in presence of IL-27 (25 ng/ml), TGF-β (2 ng/ml) or a combination of the two cytokines and the expression of the indicated proteins was assessed on Day 5 by flow cytometry, after 5 h stimulation with PMA+I (mean + 95% c.i.; n = 6; surface markers TGF-β+IL-27, n = 5). d. TH17-IL-10+ (n = 4) and TH17-IL-10- (n = 6) cells were polyclonally activated in the presence of AHR antagonist (CH-223191, 3 μΜ) or agonist (FICZ, 100 nM) and IL-10 production was measured on Day 5 by flow cytometry, following 5 h PMA+I stimulation (mean + s.e.m.). *P < 0.05; **P < 0.01; ***P < 0.001; ****P < 0.0001, as determined by ratio paired t test (a) or ratio paired t test (b-d).
Figure 6.
Figure 6.. c-MAF extensively binds bona fide enhancers associated to immune-related genes in TH17-IL-10+ cells.
a. Number of c-MAF peaks found in Day 0-resting and Day 5- activated TH17-IL-10+ and TH17-IL-10- cells, as assessed by ChIP-seq (MACS P-value ≤ 10 × 10−10). b. Pie chart showing the portion of differentially expressed c-MAF-bound genes in Day 0 and Day 5 TH17-IL-10+ cells. The portion of genes associated with TH17-IL-10+ or TH17-IL-10- is shown in black and grey, respectively; c-MAF not bound genes are shown in white. c. Position weight matrix (PWM) of DNA motives in TH17-IL-10+ and TH17-IL-10- associated genes. d. Genomic distribution of c-MAF peaks; promoters were defined as a −2.5 kb to +1 kb window around gene TSSs. e. ChIP-qPCR analysis of H3K4me1 and H3K4me3 levels on a selected number of c-MAF bound regions in Day 0 and Day 5 TH17-IL-10+ cells (mean + s.e.m.; n = 2). Each region is named according to the associated gene. f. H3K27ac distribution in a 10 kb window around c-MAF peaks, in Day 0 or Day 5 TH17-IL-10+ cells. Data represent the average of two independent experiments.
Figure 7.
Figure 7.. c-MAF promotes the immunoregulatory and tissue-residency transcriptional program in Day 5-activated TH17-IL-10+ cells.
a. c-MAF depletion in Day 5-activated TH17-IL-10+ clones by shRNAs. Left panel depicts a representative c-MAF staining in TH17- IL-10+ cells transduced with control shRNA (shLuc) or c-MAF-specific shRNAs (shRNA1). Right panel shows the shRNA-mediated downregulation of c-MAF levels in TH17-IL-10+ clones, as detected by intracellular staining. Two independent c-MAF-targeting shRNAs (shRNAl and shRNA2) were used. Data are represented as mean + 95% c.i., with each dot indicating a T cell clone pool (shLuc and shRNA1 n = 8, shRNA2 n = 7). b. IL-10 expression as determined by qPCR (left panel, mean + s.e.m.) and intracellular cytokine staining (ICCS, right panel, mean + 95% c.i.) in TH17-IL-10+ clones transduced with control shRNA (shLuc) or c-MAF-targeting shRNA1 and shRNA2. Each dot indicates a T cell clone pool (qPCR: shRNA1 n = 5, shRNA2 n = 4, ICCS: shRNA1 n = 7, shRNA2 n = 6). c. MA plots of RNA-seq analysis of Day 5 c-MAF-depleted TH17-IL-10+, after 2 h stimulation with CD3/CD28 antibodies (left panel). Genes associated with TH17-IL-10+ or TH17-IL-10- are highlighted in red and blue, respectively. Changes in expression of genes associated with TH17-IL-10+ and TH17-IL-10- upon c-MAF depletion are summarized in a box (interquartiles, with a line indicating the median value) and whiskers (min to max values) plot (right panel, mean indicated as a “+”). Data represent the average of two independent experiments. d. Expression of c-MAF-dependent genes in Day 5 c-MAF-depleted TH17-IL10+ cells, as measured by qPCR. Black and grey bars indicate genes associated with TH17-IL10+ or TH17-IL10- cells, respectively. Shown is the average log2 fold change of the two indicated shRNAs compared to the shLuc control (mean + s.e.m.; n = 4). **P < 0.01; ***P < 0.001; ****P < 0.0001, as determined by ratio paired t test (a), paired t test (b) and Wilcoxon matched-pairs signed rank test (c).

References

    1. Sallusto F, Lenig D, Forster R, Lipp M & Lanzavecchia A Two subsets of memory T lymphocytes with distinct homing potentials and effector functions. Nature 401, 708–712 (1999). - PubMed
    1. Mueller SN & Mackay LK Tissue-resident memory T cells: local specialists in immune defence. Nat Rev Immunol 16, 79–89 (2016). - PubMed
    1. Park CO & Kupper TS The emerging role of resident memory T cells in protective immunity and inflammatory disease. Nat Med 21, 688–697 (2015). - PMC - PubMed
    1. Ouyang W, Rutz S, Crellin NK, Valdez PA & Hymowitz SG Regulation and functions of the IL-10 family of cytokines in inflammation and disease. Annu Rev Immunol 29, 71–109 (2011). - PubMed
    1. Chen L & Flies DB Molecular mechanisms of T cell co-stimulation and coinhibition. Nat Rev Immunol 13, 227–242 (2013). - PMC - PubMed

Publication types

MeSH terms