. 2018 Oct;3(10):1131-1141.
doi: 10.1038/s41564-018-0229-0. Epub 2018 Sep 10.

Autophagy proteins suppress protective type I interferon signalling in response to the murine gut microbiota

Affiliations

Autophagy proteins suppress protective type I interferon signalling in response to the murine gut microbiota

Patricia K Martin et al. Nat Microbiol. 2018 Oct.

Abstract

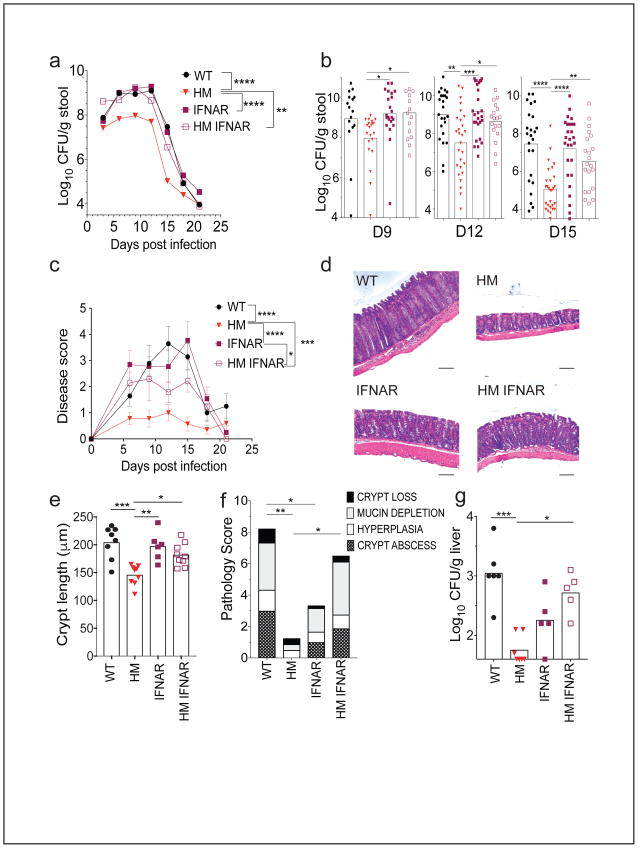
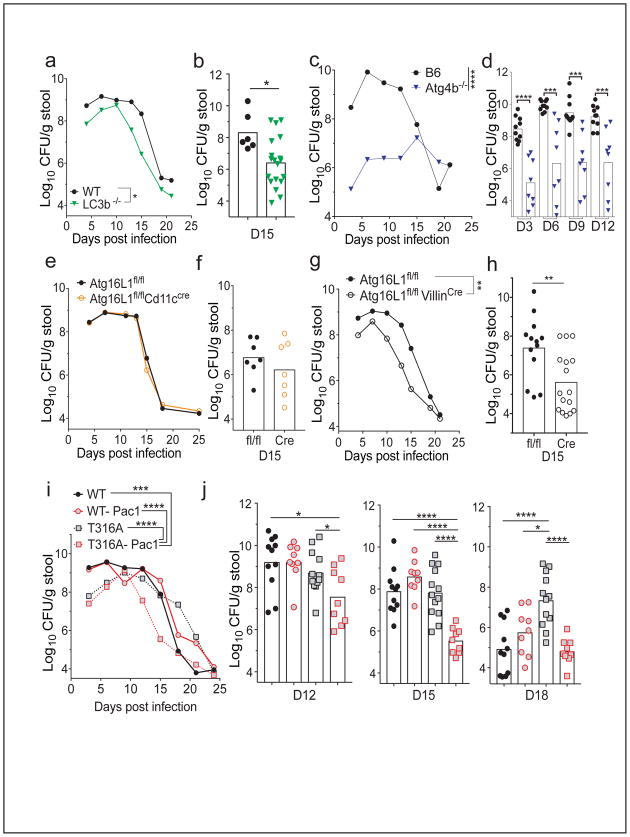
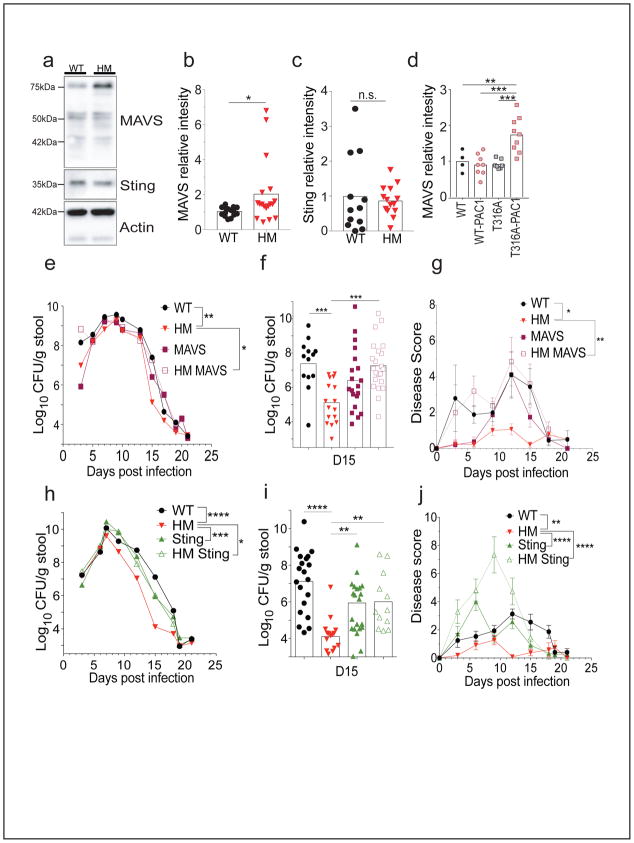
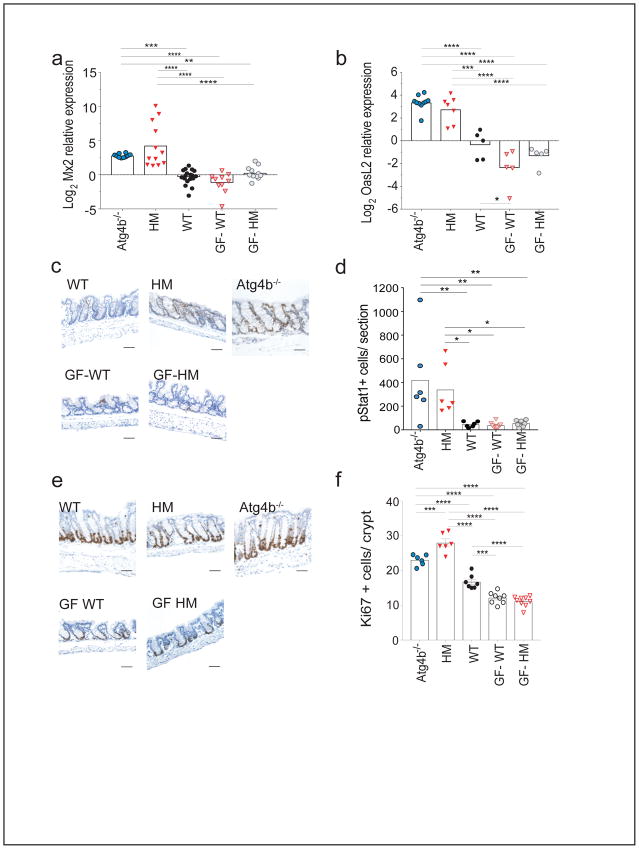
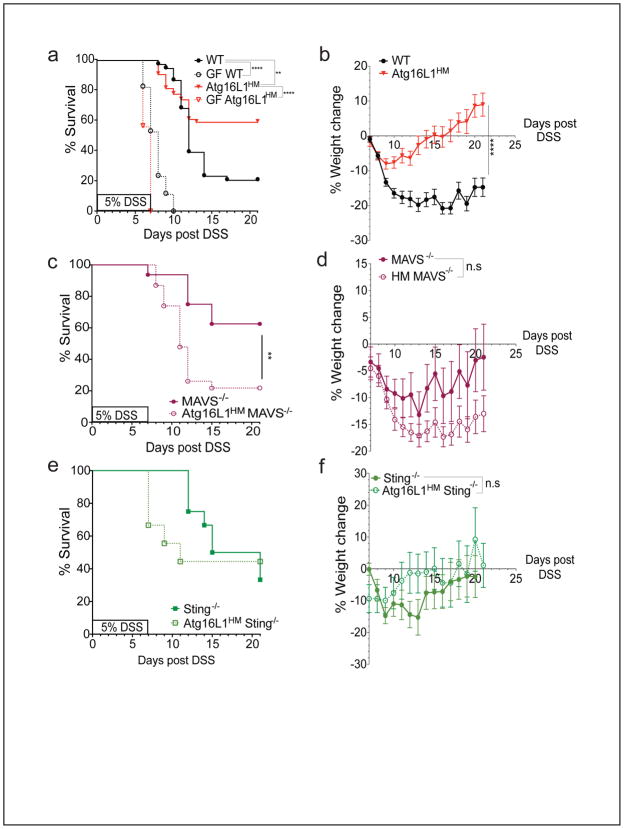
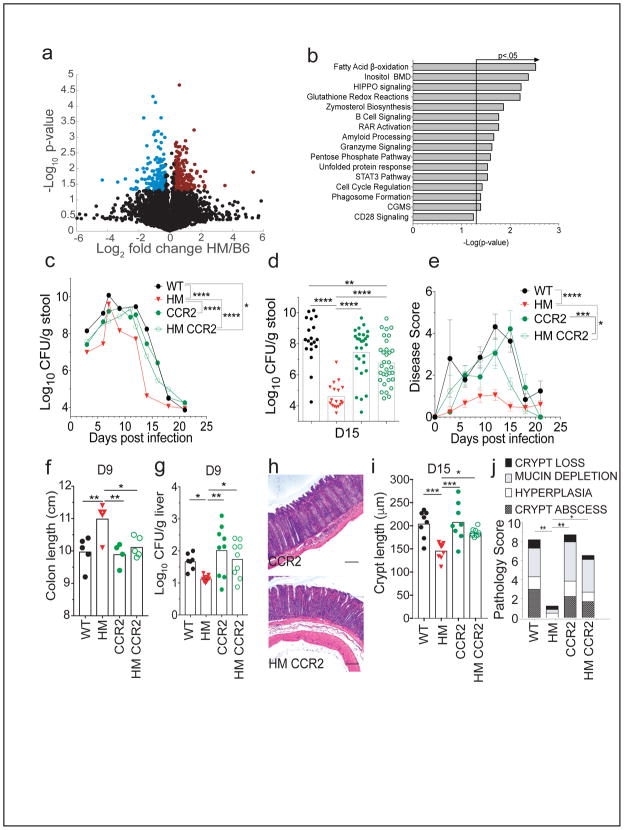
As a conserved pathway that lies at the intersection between host defence and cellular homeostasis, autophagy serves as a rheostat for immune reactions. In particular, autophagy suppresses excess type I interferon (IFN-I) production in response to viral nucleic acids. It is unknown how this function of autophagy relates to the intestinal barrier where host-microbe interactions are pervasive and perpetual. Here, we demonstrate that mice deficient in autophagy proteins are protected from the intestinal bacterial pathogen Citrobacter rodentium in a manner dependent on IFN-I signalling and nucleic acid sensing pathways. Enhanced IFN-stimulated gene expression in intestinal tissue of autophagy-deficient mice in the absence of infection was mediated by the gut microbiota. Additionally, monocytes infiltrating into the autophagy-deficient intestinal microenvironment displayed an enhanced inflammatory profile and were necessary for protection against C. rodentium. Finally, we demonstrate that the microbiota-dependent IFN-I production that occurs in the autophagy-deficient host also protects against chemical injury of the intestine. Thus, autophagy proteins prevent a spontaneous IFN-I response to microbiota that is beneficial in the presence of infectious and non-infectious intestinal hazards. These results identify a role for autophagy proteins in controlling the magnitude of IFN-I signalling at the intestinal barrier.


Conflict of interest statement

Competing financial interests

The authors declare no competing financial interests.

Figures

Figure 1
Figure 1. Protection conferred by ATG16L1 inhibition is dependent on the IFN-I pathway
(a) Mean colony forming units (CFUs) recovered from stool over time from WT (n=22), Atg16L1HM (n=25), Ifnar−/−(n=27), and Atg16L1HMIfnar−/− (n=21) mice inoculated with C. rodentium. 6 independent experiments were performed. (b) Quantification of bacterial burden in stool on indicated days from (a). (c) Quantification of disease over time for mice in (a). Disease score is a measurement of hunched posture, ruffled fur, immobility, and weight loss (See Methods). (d–f) Representative H&E-stained colonic sections from WT (n=8), Atg16L1HM(n=9), Ifnar−/−(n=6), and Atg16L1HMIfnar−/− (n=9) mice (d). Quantification of crypt hyperplasia (e), and cumulative pathology score (f) on day 15 post infection from 2 independent experiments. Scale bar=100μm. (g) Bacterial burden in the liver measured by CFUs per gram tissue. Data points in (a) and (c) and bars in (b), (e), (f), and (g) represent mean, and dots in (b) and (g) represent individual mice. Error bars in (c) and (e) represent SEM. ANOVA with Holm–Sidak multiple comparisons test was used to evaluate significance in all graphs for this figure. *p<0.05, **p<0.01, ***p<0.001, and ****p<0.0001 (Supplemental Table 2 lists exact p-values).
Figure 2
Figure 2. Different models of autophagy deficiency confer resistance to C. rodentium infection
(a) Mean colony forming units (CFUs) recovered from stool over time from WT (n=6) and LC3b−/− (n=19) mice inoculated with C. rodentium. 3 independent experiments were performed. (b) Quantification of bacterial burden in stool on day 15 post infection from (a). (c) Mean CFUs recovered from stool over time from WT (n=10) and Atg4b−/−(n=8) mice inoculated with C. rodentium. 2 independent experiments were performed. (d) Quantification of bacterial burden in stool on indicated days from (c). (e) Mean CFUs recovered from stool over time from Atg16L1fl/fl (n=7) and Atg16L1fl/flCdllcCre (n=8) mice inoculated with C. rodentium. 2 independent experiments were performed. (f) Quantification of bacterial burden in stool on day 15 post infection from (e). (g) Mean CFUs recovered from stool over time from Atg16L1fl/fl (n=13) and Atg16L1fl/flVillinCre (n=16) mice inoculated with C. rodentium from 4 independent experiments. (h) Quantification of bacterial burden in stool on day 15 post infection from (g). (i) Mean CFUs recovered from stool over time from WT (n=12), WT-Pac1 treated (n=10), Atg16L1T316A (n=13), and Atg16L1T316A Pac1 treated (n=9) mice inoculated with C. rodentium. 3 independent experiments were performed. (j) Quantification of bacterial burden in stool on day 15 post infection from (i). Bars represent mean and dots represent individual mice. An unpaired two-tailed t-test was used to evaluate differences between two groups where data was distributed normally with equal variance between conditions (a–h). ANOVA with Holm–Sidak multiple comparisons test was used to evaluate significance for experiments involving multiple groups (i,j). *p<0.05, **p<0.01, ***p<0.001, and ****p<0.0001 (Supplemental Table 2 lists exact p-values).
Figure 3
Figure 3. Protection conferred by ATG16L1 inhibition is dependent on MAVS and STING
(a–c) Representative Western blot (a) and quantification of MAVS (b) and STING (c) from colonic tissue of uninfected Atg16L1HM (n=18) and WT (n=16) mice normalized to β-actin from 3 independent experiments. Relative intensity of MAVS protein was determined by complete lane analysis. Full-length original blots can be found in Supplemental Figure 4h. (d) Quantification of MAVS from colonic tissue of uninfected WT (n=5), Atg16L1T316A (n=7), WT-Pac1 treated (n=8), and Atg16L1T316A-Pac1 treated (n=9) mice. Protein is normalized to β-actin from 2 independent experiments. (e–f) Bacteria in stool over time (e) and on day 15 (f) from WT (n=13), Atg16L1HM (n=19), Mavs−/− (n=20), and Atg16L1HMMavs−/− (n=26) mice inoculated with C. rodentium. 4 independent experiments were performed. (g) Quantification of disease over time for mice in (e). (h–i) Bacteria in stool over time (h) and on day 15 (i) from WT (n=20), Atg16L1HM (n=16), Sting−/− (n=24), and Atg16L1HMSting−/− (n=24) mice inoculated with C. rodentium. (j) Quantification of disease over time for mice in (h). 3 independent experiments were performed. Data points in (e), (g), (h) and (j) and bars in (b), (c), (d), (f), and (i) represent mean. Error bars represent SEM. Dots in (b), (c), (d), (f) and (i) represent individual mice. An unpaired two-tailed t-test was used to evaluate differences between two groups (b) and (c). ANOVA with Holm–Sidak multiple comparisons test was used to evaluate significance for experiments involving multiple groups (d–j). *p<0.05, **p<0.01, ***p<0.001, and ****p<0.0001 (Supplemental Table 2 lists exact p-values).
Figure 4
Figure 4. The type I IFN signature in colonic tissue of autophagy deficient mice is dependent on the microbiota
(a,b) qRT-PCR analyses of Mx2 (a) and OasL2 (b) expression relative to Gapdh in colonic tissue from uninfected Atg4b−/− (n=10), Atg16L1HM (n=12), WT (n=15), germ-free (GF) WT (n=15), and GF Atg16L1HM (n=15) mice from 4 independent experiments. (c–f) Representative immunohistochemistry (IHC) images and quantification of pStat1 (c,d) and Ki67 (e,f) staining in colonic tissue from Atg4b−/− (n=7), Atg16L1HM (n=7), WT (n=6), germ-free (GF) WT (n=7), and GF Atg16L1HM (n=10) mice. 2 independent experiments were performed. Bars in (a), (b), (d), and (f) represent mean. Error bars represent SEM. Scale bar=100μm. ANOVA with Holm–Sidak multiple comparisons test was used to evaluate significance in all graphs for this figure. *p<0.05, **p<0.01, ***p<0.001, and ****p<0.0001 (Supplemental Table 2 lists exact p-values).
Figure 5
Figure 5. Autophagy deficiency protects against chemical injury of the intestine
(a,b) Survival (a) and change in body weight (b) of WT (n=38), Atg16L1HM (n=35), germ-free WT (n=17), and germ-free Atg16L1HM (n=16) mice receiving 5% dextran sodium sulfate (DSS) in drinking water for 7 days. (c,d) Survival (c) and change in body weight (d) of Mavs−/− (n=15) and Atg16L1HMMavs−/−(n=25) mice receiving 5% DSS. (e,f) Survival (e) and change in body weight (f) of Sting−/−(n=12) and Atg16L1HMSting−/− (n=10) mice receiving 5% DSS. At least 2 independent experiments were performed. Data points represent mean ± SEM in (b), (d), and (f). An unpaired two-tailed t-test was used to evaluate differences between two groups where data was distributed normally with equal variance between conditions (b), (d), and (f). The log-rank Mantel–Cox test was used for comparison of mortality curves (a), (c), and (e). **p<0.01, ***p<0.001, and ****p<0.0001 (Supplemental Table 2 lists exact p-values).
Figure 6
Figure 6. Protection conferred by Atg16L1 mutation is associated with enhanced monocyte function
(a) RNAseq analysis was performed on monocytes harvested from WT and Atg16L1HM mice on day 9 post Citrobacter rodentium infection. Volcano plot of all transcripts that mapped to the murine transcriptome show 404 differentially up-regulated genes in monocytes from Atg16L1HM mice labeled in red and 402 downregulated genes labeled in blue. n= 4 mice/group. (b) Functional classification of differentially regulated genes from (a) by Ingenuity pathway analysis. The arrowed line marks where the p-value becomes less than 0.05 and highlights the pathways that are significantly different between WT and Atg16L1HM transcriptional profiles. Inositol BMD= Inositol Biosynthesis, metabolism, and degradation, CGMS=cholecystokinin and gastrin-mediated signaling. (c,d) Bacteria recovered from stools over time (c) and on day 15 (d) from WT(n=19), Atg16L1HM(n=18), Ccr2−/−(n=29), and Atg16L1HMCcr2−/−(n=22) mice inoculated with C. rodentium. 6 independent experiments were performed. (e) Quantification of disease over time for mice in (c). (f) Colon length of WT (n=5), Atg16L1HM (n=4), Ccr2−/− (n=5), and Atg16L1HMCcr2−/− (n=5) mice infected at day 9 with C. rodentium infection from 1 experiment. (g) Bacterial burden in the liver measured by CFUs per gram tissue in WT (n=7), Atg16L1HM (n=10), Ccr2−/− (n=9), and Atg16L1HMCcr2−/− (n=9) mice at day 9 post C. rodentium infection from 2 experiments. (h–j) Representative H&E-stained colonic sections (h), quantification of crypt length (i), and cumulative pathology sore (j) on day 15 post infection from WT (n=8), Atg16L1HM (n=9), Ccr2−/− (n=8), and Atg16L1HMCcr2−/− (n=9) mice. 3 independent experiments were performed. Scale bar=100μm. Data points in (c), (e) and bars in (d), (f), (g), (i), and (j) represent mean. Error bars represent SEM. An unpaired two-tailed t-test was used to evaluate differences between two groups (b). ANOVA with Holm–Sidak multiple comparisons test was used to evaluate significance for experiments involving multiple groups (c–j). *p<0.05, **p<0.01, ***p<0.001, and ****p<0.0001 (Supplemental Table 2 lists exact p-values).

Comment in

  • Taming the beasts within.
    Martinez J. Martinez J. Nat Microbiol. 2018 Oct;3(10):1080-1081. doi: 10.1038/s41564-018-0264-x. Nat Microbiol. 2018. PMID: 30254330 No abstract available.

Similar articles

Cited by

References

    1. Ramanan D, Cadwell K. Intrinsic Defense Mechanisms of the Intestinal Epithelium. Cell Host Microbe. 2016;19:434–441. - PMC - PubMed
    1. Cadwell K. Crosstalk between autophagy and inflammatory signalling pathways: balancing defence and homeostasis. Nat Rev Immunol. 2016 - PMC - PubMed
    1. Tal MC, et al. Absence of autophagy results in reactive oxygen species-dependent amplification of RLR signaling. Proc Natl Acad Sci U S A. 2009;106:2770–2775. - PMC - PubMed
    1. Jounai N, et al. The Atg5 Atg12 conjugate associates with innate antiviral immune responses. Proc Natl Acad Sci U S A. 2007;104:14050–14055. - PMC - PubMed
    1. Liang Q, et al. Crosstalk between the cGAS DNA sensor and Beclin-1 autophagy protein shapes innate antimicrobial immune responses. Cell Host Microbe. 2014;15:228–238. - PMC - PubMed

Publication types

MeSH terms