. 2018 Sep 10;8(1):13530.
doi: 10.1038/s41598-018-30335-7.

Characterisation of pathogen-specific regions and novel effector candidates in Fusarium oxysporum f. sp. cepae

Affiliations

Characterisation of pathogen-specific regions and novel effector candidates in Fusarium oxysporum f. sp. cepae

Andrew D Armitage et al. Sci Rep. .

Abstract

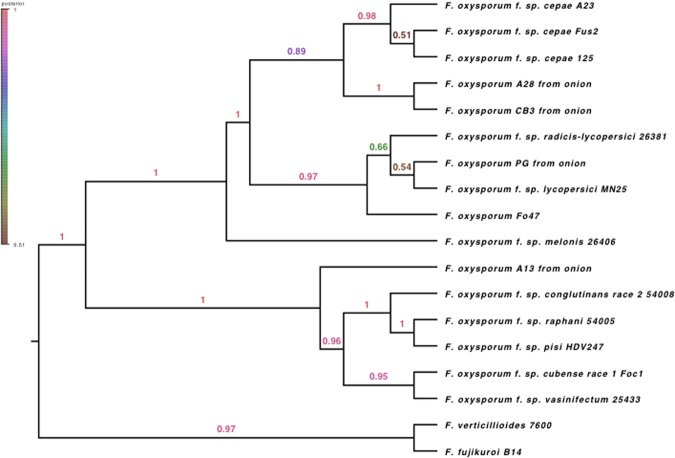
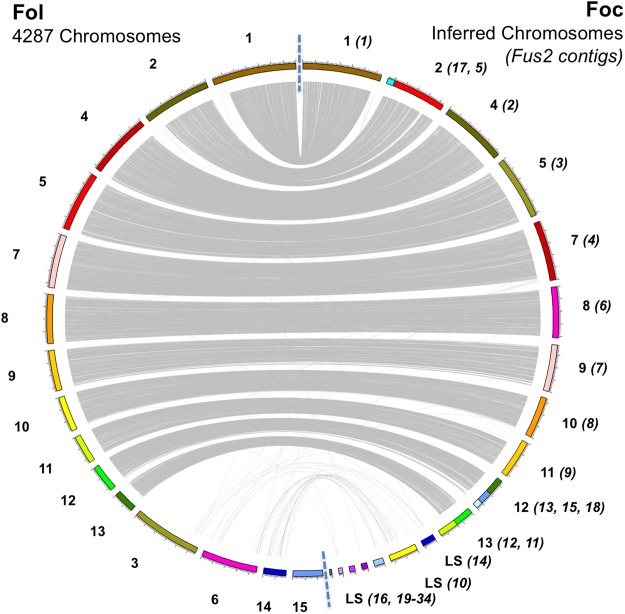
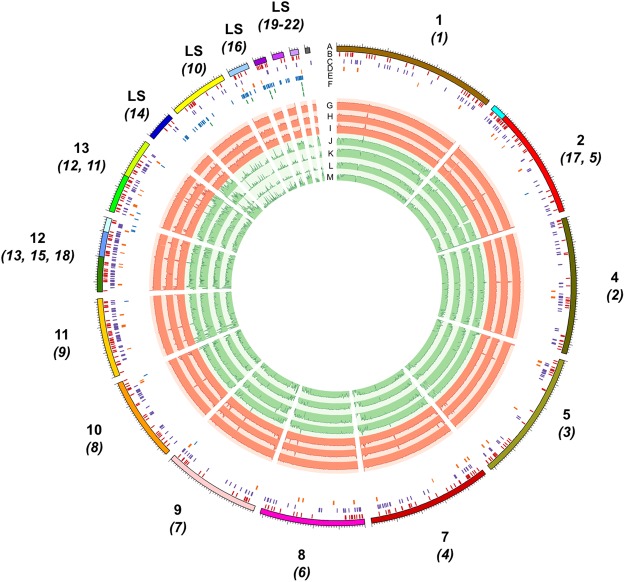
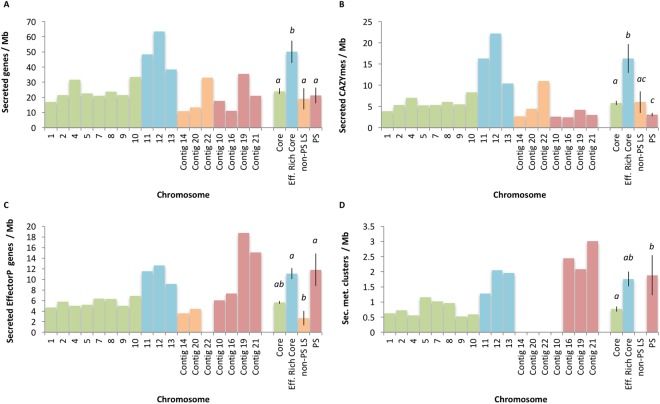
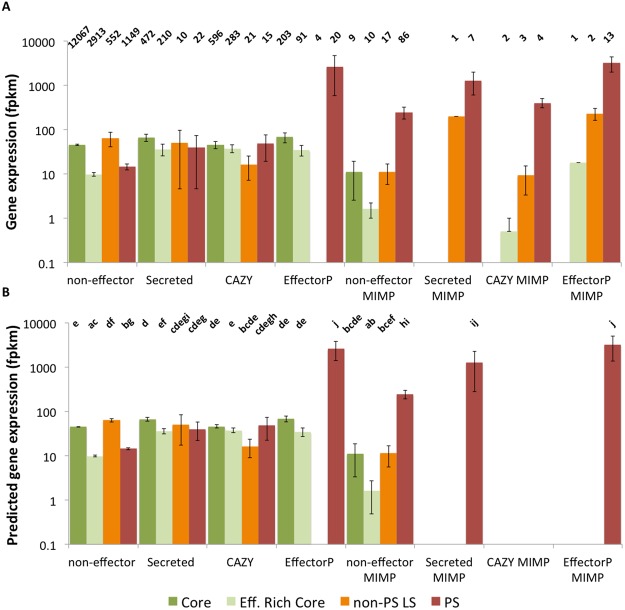
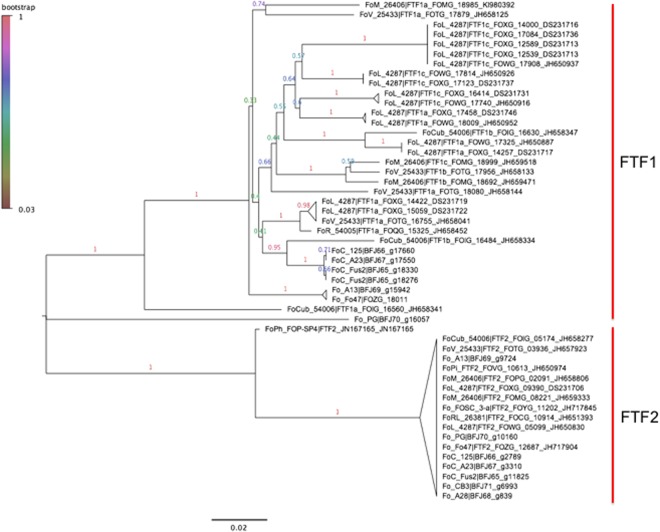
A reference-quality assembly of Fusarium oxysporum f. sp. cepae (Foc), the causative agent of onion basal rot has been generated along with genomes of additional pathogenic and non-pathogenic isolates of onion. Phylogenetic analysis confirmed a single origin of the Foc pathogenic lineage. Genome alignments with other F. oxysporum ff. spp. and non pathogens revealed high levels of syntenic conservation of core chromosomes but little synteny between lineage specific (LS) chromosomes. Four LS contigs in Foc totaling 3.9 Mb were designated as pathogen-specific (PS). A two-fold increase in segmental duplication events was observed between LS regions of the genome compared to within core regions or from LS regions to the core. RNA-seq expression studies identified candidate effectors expressed in planta, consisting of both known effector homologs and novel candidates. FTF1 and a subset of other transcription factors implicated in regulation of effector expression were found to be expressed in planta.


Conflict of interest statement

The authors declare no competing interests.

Figures

Figure 1
Figure 1
Bayesian phylogeny of Fusarium oxysporum isolates from onion and other hosts using 30 single copy loci. Pathogenic Foc isolates (Fus2, 125, A23) are monophyletic within the phylogeny while non-pathogenic isolates from onion (A13, A28, CB3, PG), are interspersed throughout the tree.
Figure 2
Figure 2
Synteny of chromosomes between Fol and Foc genome assemblies. Relationships are shown through linking single copy orthologous genes, present in both genomes. Core chromosomes can be identified through synteny between Foc and Fol whereas LS regions show reduced synteny. The number of LS chromosomes does not appear to be conserved between assemblies. Fol chromosome 15 harbours no genes in single copy orthogroups.
Figure 3
Figure 3
Visualisation of core chromosomes and 7 assigned LS contigs from Foc isolate Fus2 genome (A). Chromosome designations in relation to Fol are shown, with constituent contents shown in brackets. Locations of predicted effector genes (B), secreted carbohydrate active enzymes (C), secondary metabolite gene clusters (D), mimp sequences (E) and SIX gene homologs (F; shown over three lines) are identified within contigs. Alignment of assemblies from pathogenic Foc isolates Fus2, 125 and A23 (G–I), non-pathogenic isolates A28, PG, CB3 and A13 (J–M).
Figure 4
Figure 4
Density of genes associated with an effector-associated function in Foc genomic regions including those encoding: secreted proteins (A); secreted carbohydrate active enzymes (CAZYmes) (B); proteins with an effector-like structure (EffectorP) (C); secondary metabolite gene clusters (D). Average gene density (±SE) is also shown by genomic region including significant differences in gene density by region (ANOVA, P < 0.05).
Figure 5
Figure 5
Observed (A) expression values (mean fpkm) for Foc Fus2 genes expressed during infection of onion seedlings at 72 hpi and predicted expression values from generalized linear modelling (B). Differences in gene expression are observed between effector-type, genomic region and presence of a mimp within 2 Kb of the gene. Number of genes in each category is shown above observed values. Pairwise significances (P < 0.05) are shown above predicted values, as determined by a Tukey test of terms from a negative binomial GLM. Effector categories include genes encoding non-effectors, secreted proteins, secreted carbohydrate active enzymes (CAZY) and secreted proteins with an effector-like structure (EffectorP). Genomic regions shown are core chromosomes 1–10 (Core), effector-enriched core chromosomes 11–13 (effector-enriched core), non-PS LS contigs, and PS contigs. Expression is shown for genes within 2 Kb of a mimp sequence (mimp).
Figure 6
Figure 6
Neighbour joining phylogeny of FTF gene sequences from Foc, Fol, f. sp. pisi (FoPi), radicis-lycopersici (FoRL), cubense (Focub), vasinifectum (FoV), melonis (FoM), conglutinans (Foco) and phaseoli (FoPh). Foc FTF1 homologs are distinct from those from other Fo ff. spp. and in non pathogenic isolates PG and A13. Branches are labelled by bootstrap support from 1000 replicates.

References

    1. Ma L-J, et al. Comparative genomics reveals mobile pathogenicity chromosomes in Fusarium. Nature. 2010;464:367–373. doi: 10.1038/nature08850. - DOI - PMC - PubMed
    1. Dong S, Raffaele S, Kamoun S. The two-speed genomes of filamentous pathogens: waltz with plants. Curr Opin Genet Dev. 2015;35:57–65. doi: 10.1016/j.gde.2015.09.001. - DOI - PubMed
    1. Medini D, Donati C, Tettelin H, Masignani V, Rappuoli R. The microbial pan-genome. Curr Opin Genet Dev. 2005;15:589–594. doi: 10.1016/j.gde.2005.09.006. - DOI - PubMed
    1. Schmidt SM, et al. MITEs in the promoters of effector genes allow prediction of novel virulence genes in Fusarium oxysporum. BMC Genomics. 2013;14:119. doi: 10.1186/1471-2164-14-119. - DOI - PMC - PubMed
    1. Leslie, J. F. & Summerell, B. A. The Fusarium Laboratory Manual. (Oxford: Blackwell Publishing, 2006).

Publication types

MeSH terms

Substances

LinkOut - more resources