

doi: 10.1038/s41592-018-0115-y.
Epub 2018 Sep 10.
Three-photon imaging of mouse brain structure and function through the intact skull
Affiliations
- PMID: 30202059
- PMCID: PMC6188644
- DOI: 10.1038/s41592-018-0115-y
Item in Clipboard
Three-photon imaging of mouse brain structure and function through the intact skull
Nat Methods.
2018 Oct.
Abstract
Optical imaging through the intact mouse skull is challenging because of skull-induced aberrations and scattering. We found that three-photon excitation provided improved optical sectioning compared with that obtained with two-photon excitation, even when we used the same excitation wavelength and imaging system. Here we demonstrate three-photon imaging of vasculature through the adult mouse skull at >500-μm depth, as well as GCaMP6s calcium imaging over weeks in cortical layers 2/3 and 4 in awake mice, with 8.5 frames per second and a field of view spanning hundreds of micrometers.
Conflict of interest statement
Competing Financial Interests
The authors declare no competing financial interests.
Figures
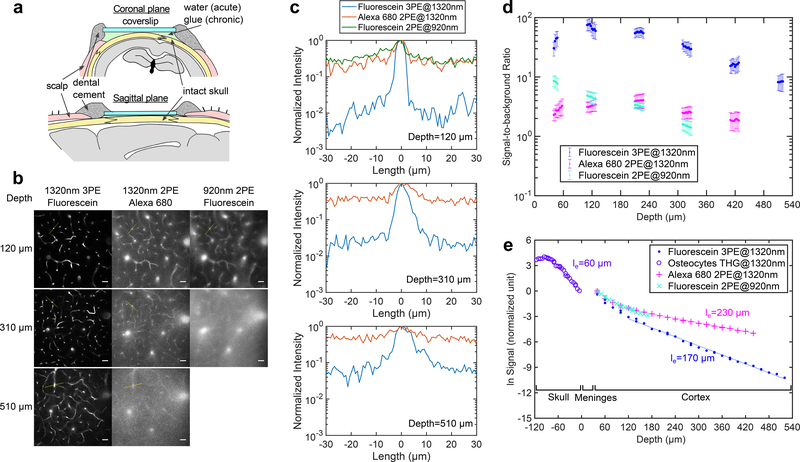
a, Schematic of through-skull imaging preparation with sagittal and coronal views (photos of a good preparation are shown in Supplementary Fig. 1). b, Comparison of 2PM and 3PM images of vasculature of a wild-type mouse (C57BL/6J, male, 12 weeks, similar results n=3) in the same cortical column under the central area of a parietal bone, with chronic preparation. Each site was imaged by 920-nm 2PE of fluorescein, 1320-nm 3PE of fluorescein and 1320-nm 2PE of Alexa680 during the same imaging session. For 920-nm 2PM, 510 μm depth is not shown since the maximum imaging depth achieved was 420 μm (Supplementary Fig. 2). Each frame was integrated for 50 s to ensure photon shot noise is negligible, and all image contrasts were linearly stretched to saturate top 0.2% pixels. Scale bar, 30 μm. c, Intensity profiles across the brightest blood vessels in each frame in (b), along the yellow lines (similar results n=3). d, SBR measured at different depths for the three imaging groups in (b) (similar results n=2). The signal was calculated from the average of the top 0.1% brightest pixels in each frame, and background from the average of the unlabeled regions. Each data point was calculated from one image, and the vertical error bar indicates the standard deviation of SBR, originated from the brightness variation of blood vessels in each image. e, Signal attenuation with depth for through-skull vasculature imaging measured in the same mouse as in (b) (similar results, n=2). Meninges include dura mater, arachnoid and pia mater. The signal strength at a particular depth is represented by the average value of the brightest 0.5% of the pixels in the x-y image from that depth. The effective attenuation length le was determined by the exponential fit of the signal as a function of imaging depth (THG signal was used inside the skull). Each data point was calculated from one image.
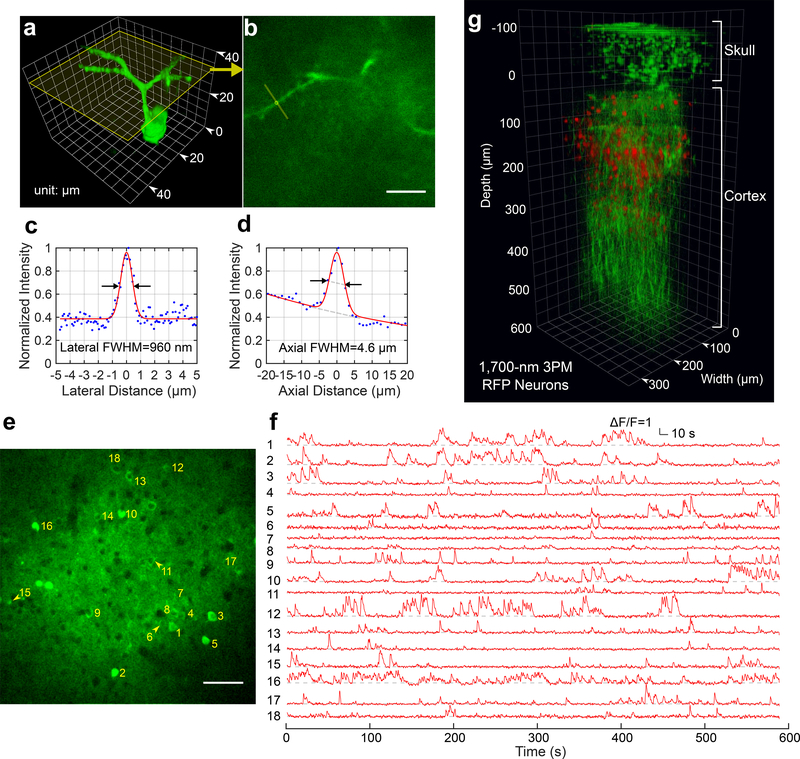
a, 3D reconstruction of a GCaMP6s-labeled neuron located about 140 μm below the cortical surface of a transgenic mouse (CamKII-tTA/tetO-GCaMP6s, 10 weeks; similar measurements were performed on 2 mice with 3 neurons each, in total n=6) imaged by 1320-nm 3PM through the intact skull (thickenss ~ 100 μm). Apical dendrites can be clearly observed for resolution estimation. b, A cross section of the 3D stack in (a), with its location indicated by the yellow frame in (a). The locations for lateral and axial resolution measurement on the apical dendrite are indicated by the yellow line and circle, respectively (similar results n=6). Scale bar, 10 μm. c, Lateral intensity profile measured along the yellow line in (b), fitted by a Gaussian profile for the estimation of the lateral resolution (similar results n=6). d, Axial intensity profile measured in the region within the yellow circle in (b), fitted by the sum of two Gaussian profiles, with one broad, off-centered Gaussian profile to corrected for the uneven baseline, and the other for the central peak (similar results n=6). e, High resolution image of a site for through-skull activity recording in an awake, GCaMP6s-labeled transgenic mouse (CamKII-tTA/tetO-GCaMP6s, female, 8 weeks, similar results n=5). The recording site is about 275 μm below the cortical surface and the FOV was 320 μm × 320 μm (256×256 pixels per frame). Scale bar, 50 μm f, Spontaneous activity traces recorded under awake condition from the indexed neurons in (e), acquired at 8.49 Hz frame rate (similar results n=5). The repetition rate used for imaging was 800 kHz, and the average power under the objective lens was 44 mW. Each trace is normalized to its baseline and low-pass filtered by a hamming window of 1.06 s time constant. The same site was visited 8 times over a period of 4 weeks after the skull preparation, with cumulatively over 6 hours of recording time (data from other imaging sessions are shown in Supplementary Fig. 5). g, 3D reconstruction of through-skull imaging of a cortical column of red fluorescent protein (RFP) labeled neurons in a Brainbow mouse (B6.Cg-Tg(Thy1-Brainbow1.0)HLich/J, male, 12 weeks, similar results n=2). The red channel is 3PE fluorescent signal from RFP and the green channel is THG. The zero depth is set just beneath the skull.
References
-
- McGonigle P Animal models of CNS disorders. Biochem. Pharmacol 87, 140–149 (2014). - PubMed
Publication types
MeSH terms
Grants and funding
LinkOut - more resources
Full Text Sources
Other Literature Sources
