. 2018 Oct;15(10):832-836.
doi: 10.1038/s41592-018-0114-z. Epub 2018 Sep 10.

Terminal exon characterization with TECtool reveals an abundance of cell-specific isoforms

Affiliations

Terminal exon characterization with TECtool reveals an abundance of cell-specific isoforms

Andreas J Gruber et al. Nat Methods. 2018 Oct.

Abstract

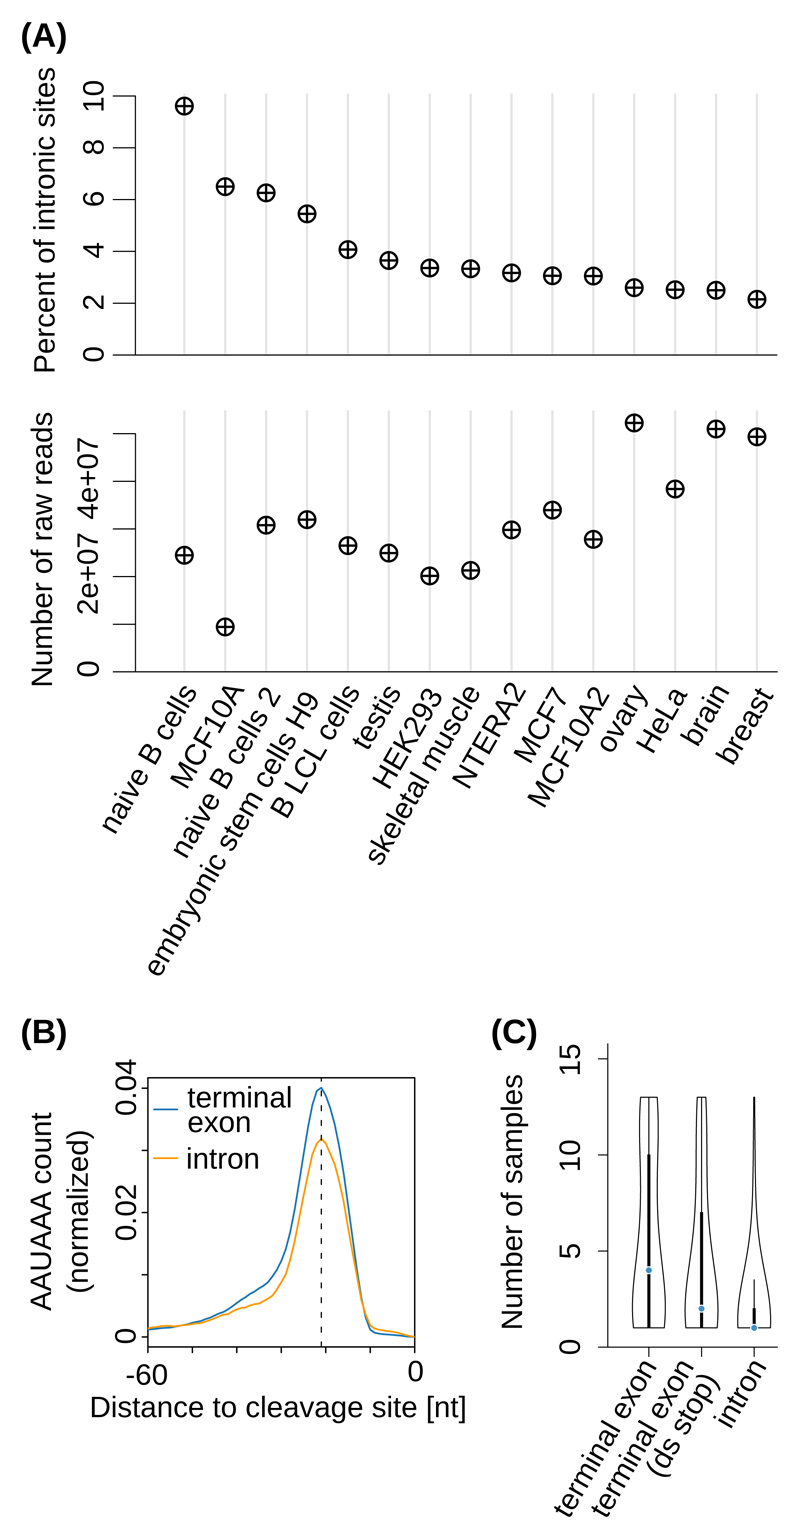
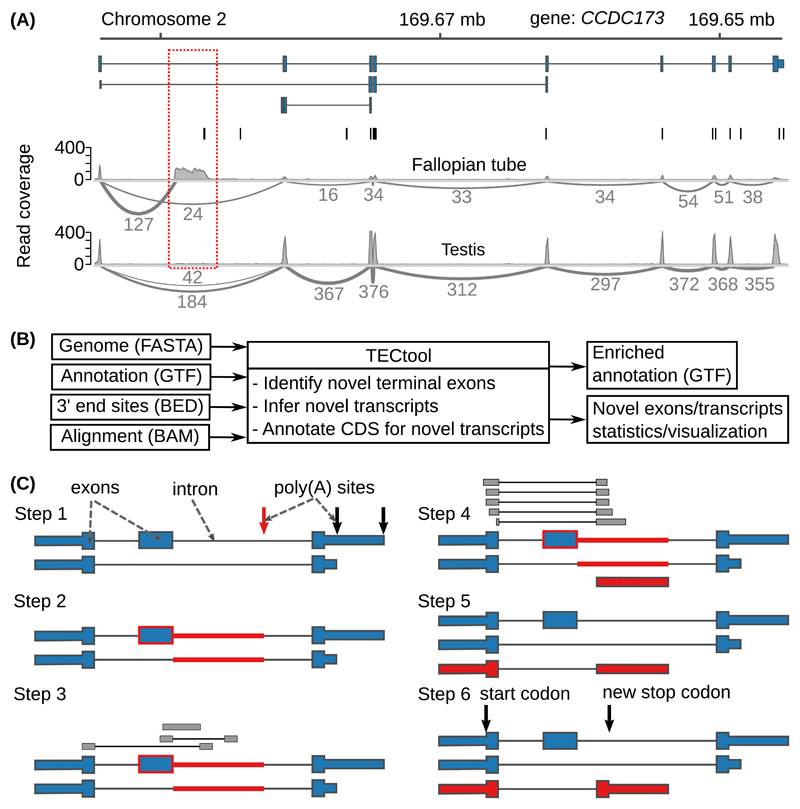
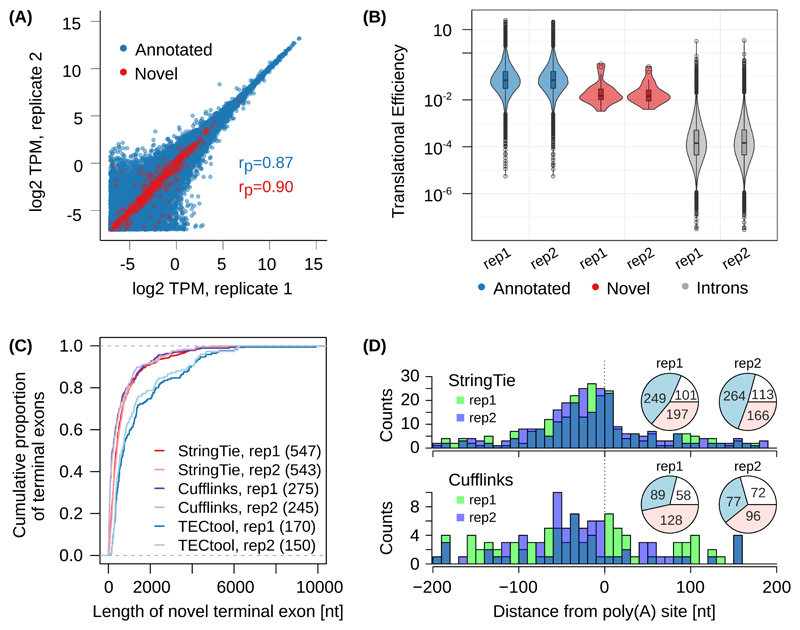
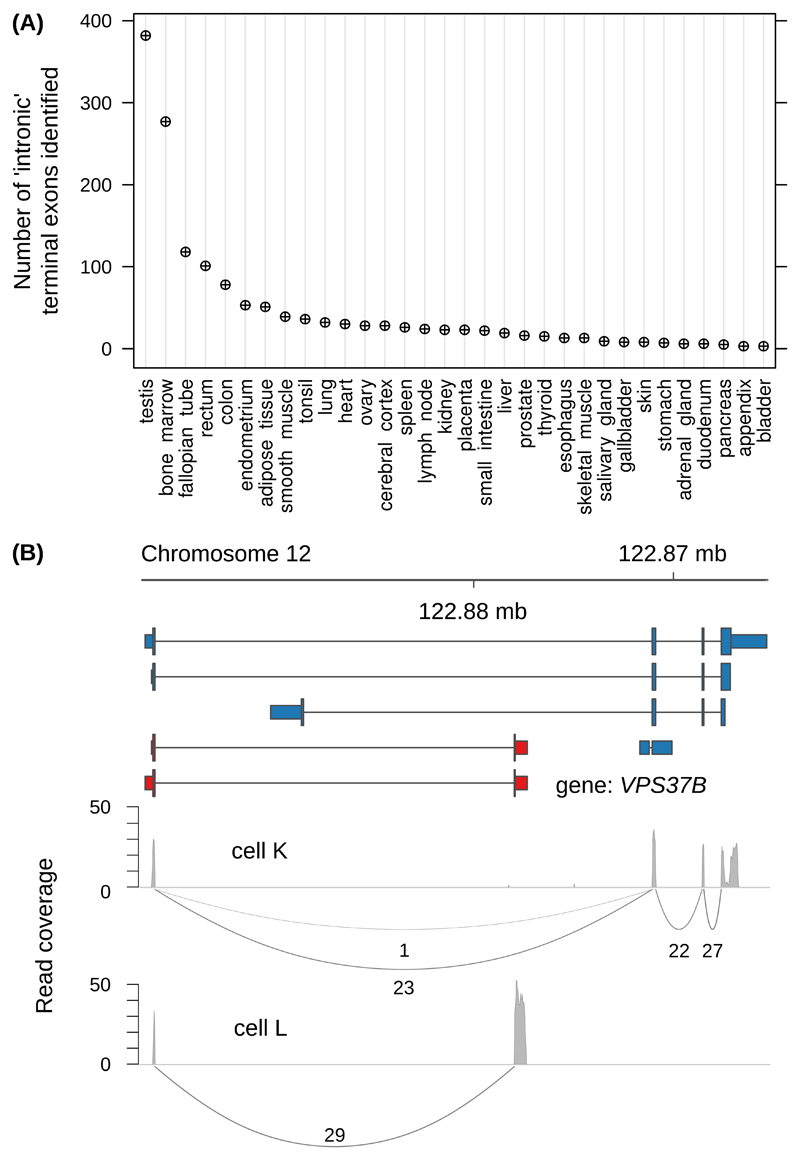
Sequencing of RNA 3' ends has uncovered numerous sites that do not correspond to the termination sites of known transcripts. Through their 3' untranslated regions, protein-coding RNAs interact with RNA-binding proteins and microRNAs, which regulate many properties, including RNA stability and subcellular localization. We developed the terminal exon characterization (TEC) tool ( http://tectool.unibas.ch ), which can be used with RNA-sequencing data from any species for which a genome annotation that includes sites of RNA cleavage and polyadenylation is available. We discovered hundreds of previously unknown isoforms and cell-type-specific terminal exons in human cells. Ribosome profiling data revealed that many of these isoforms were translated. By applying TECtool to single-cell sequencing data, we found that the newly identified isoforms were expressed in subpopulations of cells. Thus, TECtool enables the identification of previously unknown isoforms in well-studied cell systems and in rare cell types.


Conflict of interest statement

Competing interests

The authors declare no competing interests.

Figures

Figure 1
Figure 1. Cell type-dependent usage of ‘intronic’ poly(A) sites.
(A) Top panel: Percentage of ‘intronic’ PAS in individual samples obtained with the 3’-Seq protocol . Bottom panel: corresponding sequencing depths. (B) Position-dependent frequency of the canonical poly(A) signal (‘AAUAAA’), dashed line at -21 nts) upstream of ‘intronic’ poly(A) sites (orange) and of poly(A) sites from annotated terminal exons (blue) from the study introduced in (A). (C) Distribution of the number of distinct samples in which individual PAS were observed, for PAS from terminal exons with no stop codon annotated downstream (‘terminal exon’, 26894 PAS), from annotated terminal exons located upstream of an annotated stop codon in the corresponding gene (‘terminal exon (ds stop)’, 3430 PAS), and from genomic regions currently annotated as intronic (‘intron’, 3937 PAS). Black boxes indicate the interquartile range (IQR) with the blue line corresponding to the median, whiskers corresponding to 1.5 times the IQR from the hinge, and densities extending to the most extreme values.
Figure 2
Figure 2. Example and model to identify novel 3’ UTR isoforms.
(A) ‘Sashimi plots’ of RNA-seq reads mapped to a region within the Coiled-coil Domain Containing 173 (CCDC173) gene locus, with the annotated ENSEMBL transcripts (blue), the PAS annotated in the PolyAsite atlas (vertical black lines, http://polyasite.unibas.ch) and densities of RNA-seq reads (gray) from fallopian tube and testis samples. The novel terminal exon is marked by the red dashed box, gray arcs indicate putative splice junctions, and numbers on the arcs indicate supporting reads (for clarity, only splice junctions supported by at least 10% of the maximum number of split reads between two exons in the genomic locus are shown, see also Supplementary Figure 2A). (B) Flow of the data through TECtool (input and output file formats are indicated in parentheses). (C) Outline of the main computational steps: Step 1 - Selection of PAS located within regions that with respect to the input annotation (see ‘Annotation (GTF)’ in (B)), are ‘intronic’ (red arrow), and not exonic, intergenic or antisense (black arrows). Step 2 - Identification of the ‘feature’ region of the putative novel terminal exon (red line), extending from the ‘intronic’ poly(A) site up to the closest annotated exon upstream (blue box with red border). Step 3 - Identification of reads that map uniquely to the feature region. Step 4 - Definition of terminal exon boundaries (red box), given by a splice site at the 5’ end - inferred from split reads -, and the ‘intronic’ poly(A) site at the 3’ end. Classification of putative terminal exons is done with a Bayes classifier. Step 5 - The newly identified terminal exons are linked to upstream exons to which they were found to be spliced based on split reads, to generate novel isoforms. Step 6 - Prediction of protein coding regions in newly identified transcripts.
Figure 3
Figure 3. Evaluation of TECtool’s performance.
(A) Scatter plot of estimated expression levels of already annotated transcripts (ENSEMBL v87, transcript support level 1-5 (TSL1-5), blue, 168'726 transcripts) and of transcripts ending at TECtool-identified terminal exons (red, 842 novel transcripts), in biological replicates of RNA-seq from HEK 293 cells (rP indicate the corresponding Pearson correlations). (B) Translational efficiencies computed for annotated terminal exons, novel terminal exons and intronic regions (two-tailed t-test p-values for pairwise comparisons of regions based on TSL1-5, novel versus intron replicate 1 (rep1): 2.1e-16; replicate 2 (rep2): 5.4e-18, and annotated versus novel rep1: 1.4e-5; rep2: 8.6e-7). The numbers of annotated, novel and introns were in rep1: 16068, 24, and 64455, and in rep2: 15772, 25, and 63932. Boxes indicate the interquartile range (IQR) with the line corresponding to the median, whiskers correspond to the most extreme value that is within 1.5 times the IQR from the hinge and outliers beyond this range are shown as individual points. (C) Cumulative distribution of the length of novel terminal exons identified by TECtool, StringTie and Cufflinks in the two replicate RNA-seq data sets, relative to the TSL1-5 annotation. The number of novel terminal exons identified by each tool is indicated in parentheses. (D) Distance between experimentally determined PAS from the PolyAsite atlas and the 3’ ends of novel transcripts identified by StringTie (top panel) and Cufflinks (bottom panel). Pie-charts show the number of 3’ ends of novel transcripts that have an experimentally determined PAS within +/-200 nts (blue), or have experimentally determined PAS farther away but in the same intron (red) or do not have any experimentally observed PAS in the respective intron (white).
Figure 4
Figure 4. TECtool identifies novel isoforms with cell type-specific expression.
(A) Number of novel terminal exons identified by TECtool in at least one sample from the indicated tissues. (B) VPS37B gene locus with the ENSEMBL-annotated transcripts (blue), novel transcripts predicted by TECtool (red), and Sashimi plots of RNA-seq read densities (gray) from two single T cells (labeled as cell K and cell L).

References

    1. Kishore S, Luber S, Zavolan M. Deciphering the role of RNA-binding proteins in the post-transcriptional control of gene expression. Brief Funct Genomics. 2010;9:391–404. - PMC - PubMed
    1. Hausser J, Zavolan M. Identification and consequences of miRNA--target interactions—beyond repression of gene expression. Nat Rev Genet. 2014;15:599. - PubMed
    1. Sandberg R, Neilson JR, Sarma A, Sharp PA, Burge CB. Proliferating Cells Express mRNAs with Shortened 3’ Untranslated Regions and Fewer MicroRNA Target Sites. Science. 2008;320:1643–1647. - PMC - PubMed
    1. Lackford B, et al. Fip1 regulates mRNA alternative polyadenylation to promote stem cell self-renewal. EMBO J. 2014;33:878–889. - PMC - PubMed
    1. Gruber AJ, et al. Discovery of physiological and cancer-related regulators of 3’ UTR processing with KAPAC. Genome Biol. 2018;19:44. - PMC - PubMed

Publication types

LinkOut - more resources