. 2018 Sep 10;9(1):3671.
doi: 10.1038/s41467-018-06115-2.

Coordinate regulation of mutant NPC1 degradation by selective ER autophagy and MARCH6-dependent ERAD

Affiliations

Coordinate regulation of mutant NPC1 degradation by selective ER autophagy and MARCH6-dependent ERAD

Mark L Schultz et al. Nat Commun. .

Abstract

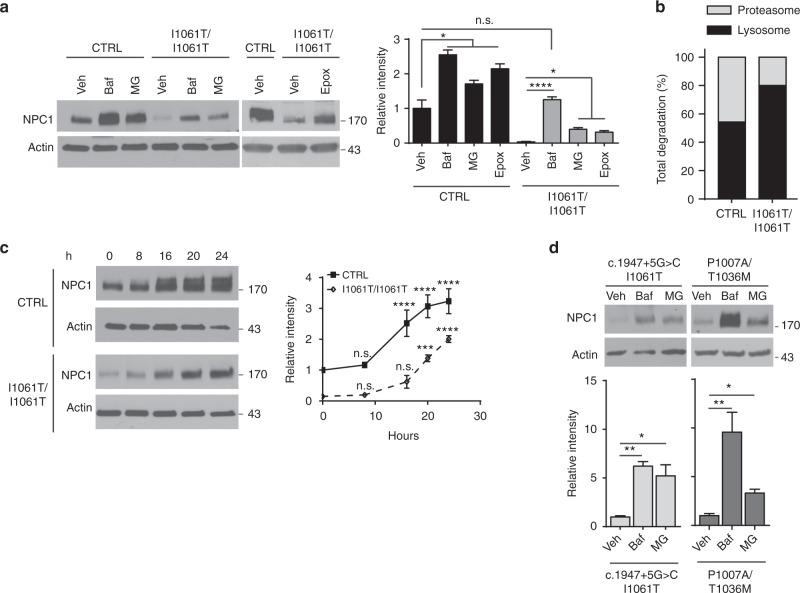
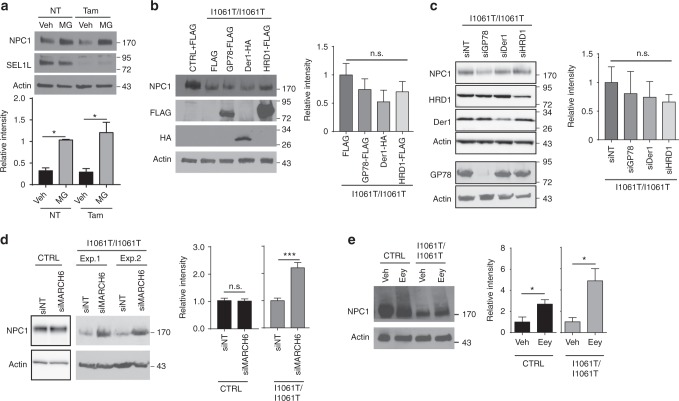
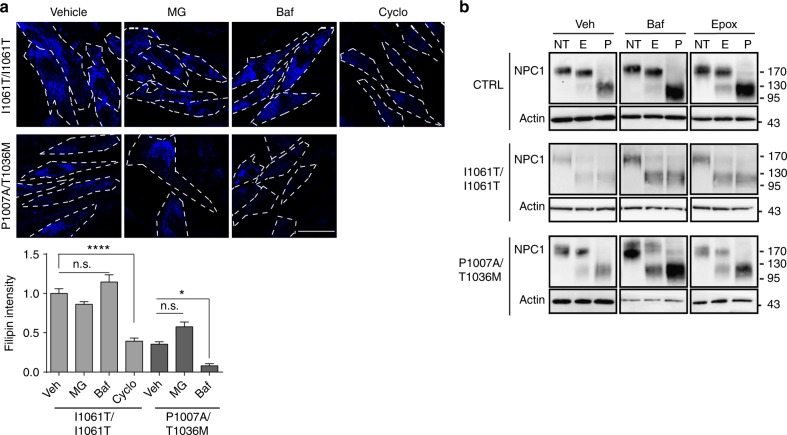
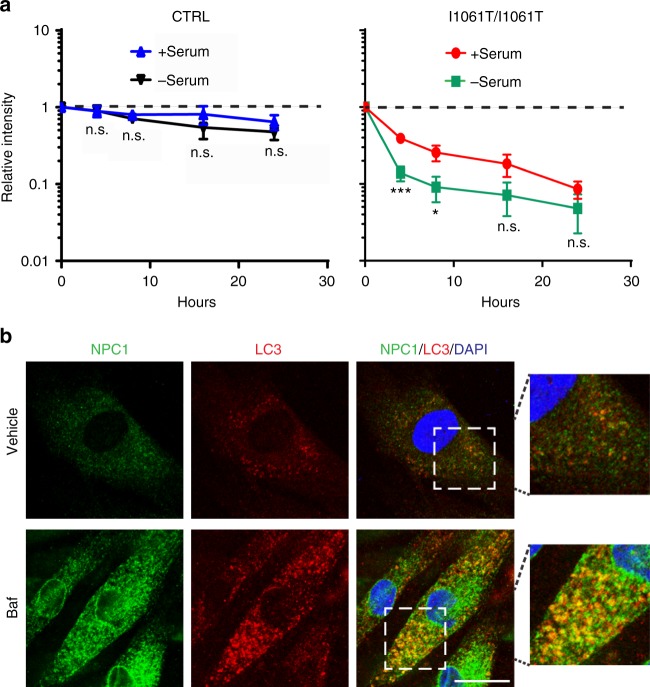
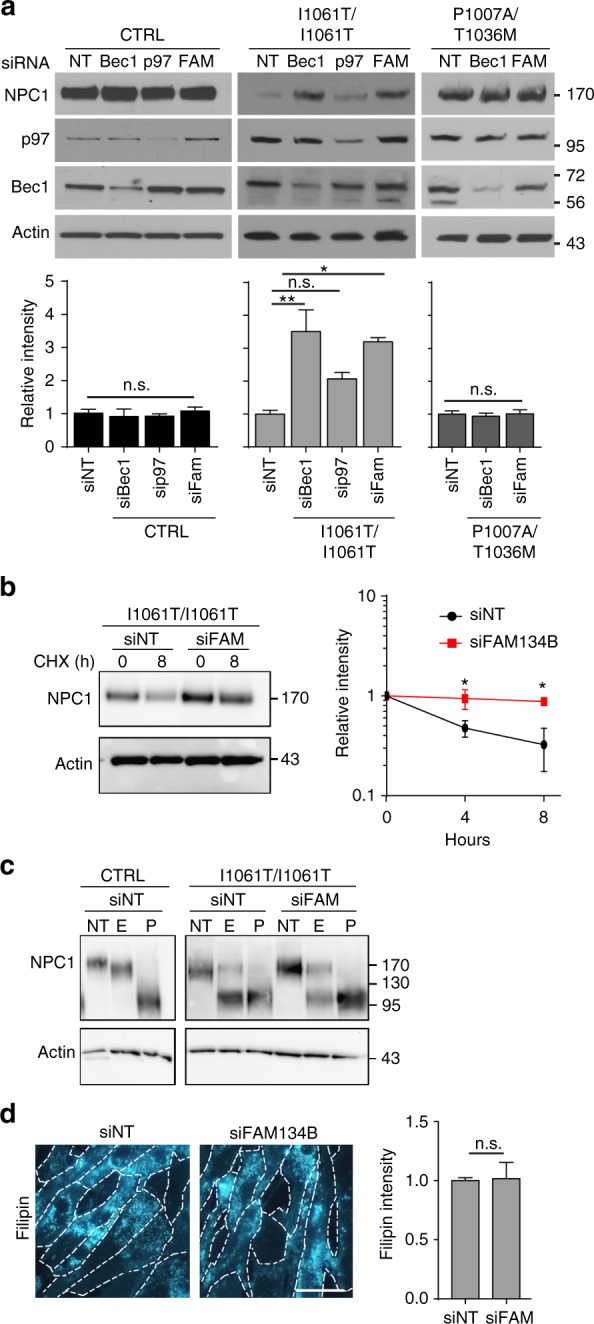
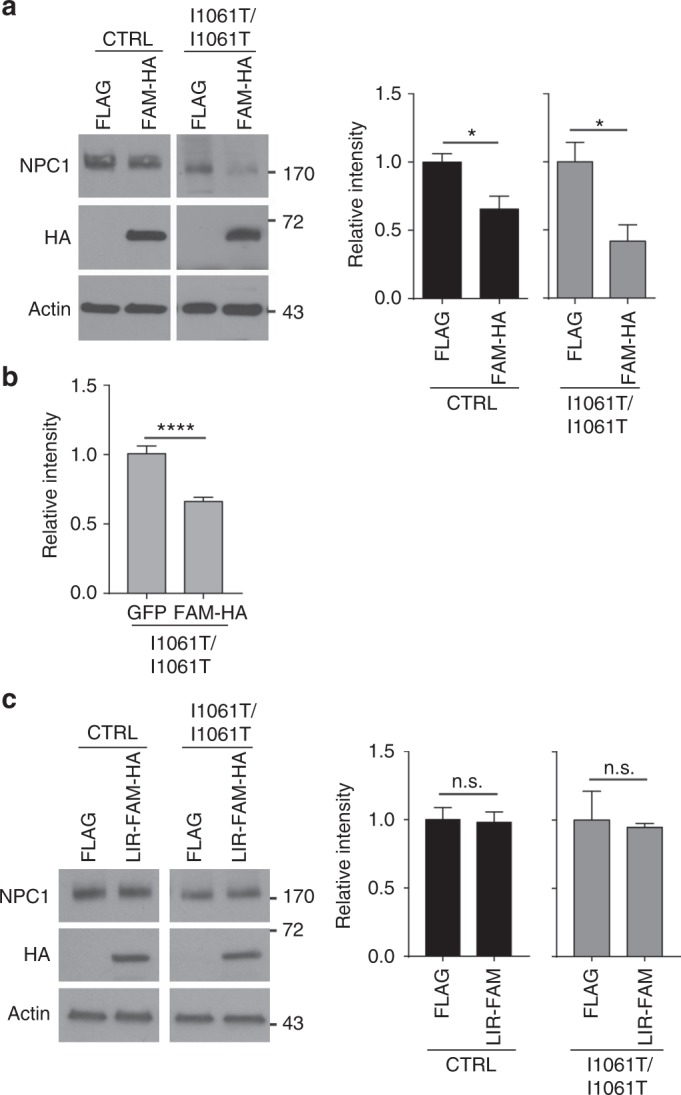
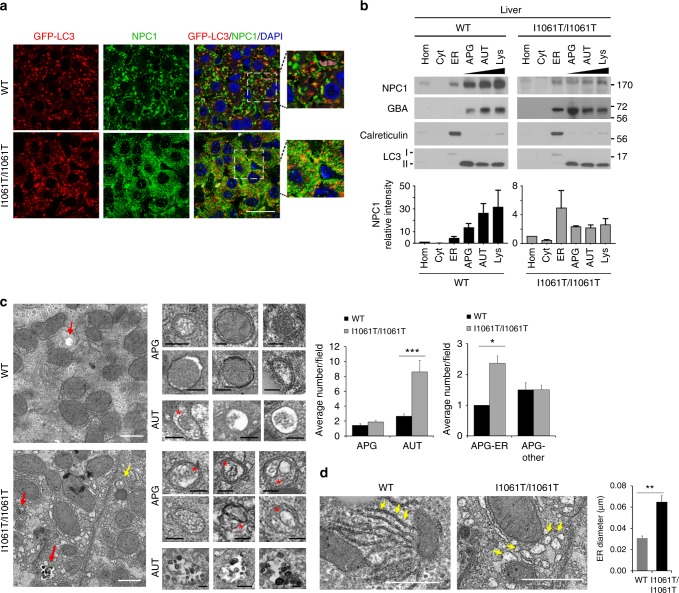
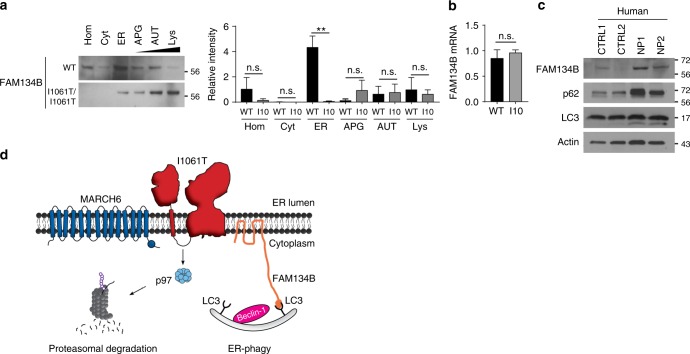
Niemann-Pick type C disease is a fatal, progressive neurodegenerative disorder caused by loss-of-function mutations in NPC1, a multipass transmembrane glycoprotein essential for intracellular lipid trafficking. We sought to define the cellular machinery controlling degradation of the most common disease-causing mutant, I1061T NPC1. We show that this mutant is degraded, in part, by the proteasome following MARCH6-dependent ERAD. Unexpectedly, we demonstrate that I1061T NPC1 is also degraded by a recently described autophagic pathway called selective ER autophagy (ER-phagy). We establish the importance of ER-phagy both in vitro and in vivo, and identify I1061T as a misfolded endogenous substrate for this FAM134B-dependent process. Subcellular fractionation of I1061T Npc1 mouse tissues and analysis of human samples show alterations of key components of ER-phagy, including FAM134B. Our data establish that I1061T NPC1 is recognized in the ER and degraded by two different pathways that function in a complementary fashion to regulate protein turnover.


Conflict of interest statement

The authors declare no competing interests.

Figures

Fig. 1
Fig. 1
I1061T NPC1 accumulates after lysosomal or proteasomal inhibition. a Primary human fibroblasts homozygous for WT NPC1 (CTRL) or I1061T NPC1 (I1061T) were treated with vehicle (Veh),100 nM bafilomycin A1 (Baf), 10 µM MG132 (MG), or 100 nM epoxomicin (Epox) for 24 h. Quantified at right. b NPC1 protein levels quantified in a were normalized to calculate relative contribution of each pathway to NPC1 degradation. c Time course of NPC1 accumulation after treatment with Baf. Quantified at right. d Patient fibroblasts with the indicated NPC1 mutations were treated for 24 h with vehicle, 100 nM Baf, or 10 µM MG. Normalized relative to CTRL and quantified below. ad Data are mean ± s.e.m. from three independent experiments. n.s., not significant, *P ≤ 0.05, **P ≤ 0.01, ***P ≤ 0.001, ****P ≤ 0.0001 by ANOVA with ad Tukey’s or c Bonferroni posthoc test (a F = 58.71; c F = 7.68; d F = (c.1947+5G>C/I1061T) 14.91, (P1007A/T1036M) 13.46)
Fig. 2
Fig. 2
I1061T NPC1 is degraded in part by MARCH6-dependent ERAD. a Tamoxifen-inducible Sel1L null mouse embryonic fibroblasts expressing WT NPC1 were treated with vehicle (NT) or 200 nM tamoxifen (Tam) for 48 h. Cells were also treated with vehicle (Veh) or 10 µM MG132 (MG) during the last 24 h to determine if Sel-1L deficiency alters the pool of WT NPC1 trafficking to the proteasome. NPC1 protein level quantified below. b Over-expression of FLAG, GP78-FLAG, Der1-HA, and HRD1-FLAG in I1061T NPC1 fibroblasts. Cells were transfected at t = 0 and t = 24 h and lysates collected at 48 h. Transgene expression confirmed using antibodies against FLAG and HA. NPC1 quantified at right, normalized to I1061T NPC1 fibroblasts transfected with FLAG. c I1061T NPC1 fibroblasts were treated with the following siRNAs: non-targeting (NT), GP78, Der1, and HRD1 at t = 0 and t = 24 h. Lysates were collected at 48 h. NPC1 quantified at right, normalized to I1061T NPC1 fibroblasts transfected with NT siRNA. d, e CTRL and I1061T NPC1 fibroblasts were treated with d non-targeting or MARCH6 siRNA (shown are two independent experiments for I1061T), e vehicle (Veh) or 10 μM eeyarestatin I (Eey). Lysates were blotted for NPC1 (quantified at right). Data are mean ± s.e.m. ae N = 3–4, b, c N = 5–6, d N = 4–6. ac One-way ANOVA with Tukey’s posthoc test, a F = 8.147. d, e Student’s t-test, d (I10) t = 4.8, e t = (CTRL) 2.69, (I10) 3.16. n.s. = not significant, *P ≤ 0.05, ***P ≤ 0.001
Fig. 3
Fig. 3
Accumulating I1061T NPC1 does not traffic to lysosomes. a Primary human fibroblasts expressing I1061T or P1007A/T1036M NPC1 were treated for 24 h with vehicle, 10 μM MG132 (MG), 100 nM bafilomycin A1 (Baf), or 1 mM cyclodextrin (Cyclo). Unesterified cholesterol was labeled with filipin (blue), and staining intensity calculated from three independent experiments (16 fields/experiment). Scale bar = 50 μm. Dashed lines outline plasma membrane. Quantified at the bottom. b CTRL, I1061T, or P1007A/T1036M NPC1 fibroblasts were treated for 24 h with vehicle (Veh), 100 nM bafilomycin A1 (Baf), or 100 nM epoxomicin (Epox). Lysates were digested with endoglycosidase H (E), PNGaseF (P), or not treated (NT) and then analyzed by western blot. Data are mean ± s.e.m. n.s., not significant, *P ≤ 0.05, ****P ≤ 0.0001 by ANOVA with Tukey’s posthoc test F = 50.85
Fig. 4
Fig. 4
I1061T NPC1 traffics to autophagosomes. a CTRL or I1061T NPC1 primary human fibroblasts were treated with cycloheximide in the absence or presence of serum. Lysates were collected at indicated times and analyzed by western blot. b I1061T NPC1 fibroblasts were treated with vehicle or 100 nM bafilomycin A1 (Baf) for 24 h. Fixed cells were stained for LC3 (red), NPC1 (green), and DAPI (blue) then imaged by confocal microscopy. Co-localization is indicated by yellow color in the merged image. Scale bar = 25 μm. Data are mean ± s.e.m. from three independent experiments. n.s., not significant, *P ≤ 0.05, ***P ≤ 0.001 by ANOVA with Bonferroni posthoc test (I10) F = 6.142
Fig. 5
Fig. 5
I1061T is degraded by ER-phagy. a CTRL, I1061T, or P1007A/T1036M NPC1 fibroblasts were treated with the following siRNAs: non-targeting (NT), beclin-1 (Bec1), p97, and FAM134B (FAM) at t = 0 and t = 24 h. Lysates were collected at t = 48 h and NPC1 levels analyzed and quantified below. b I1061T NPC1 fibroblasts were treated for 2 sequential days with non-targeting siRNA (siNT) or siRNA FAM134B (siFAM134B), then treated with cycloheximide and serum starved. NPC1 protein levels were analyzed by western blot, quantified at right. c Lysates from a were digested with endoglycosidase H (E), PNGaseF (P), or not treated (NT) and then analyzed by western blot. d I1061T NPC1 fibroblasts were treated with siRNAs as in a. At t = 48 h, cells were stained with filipin. Intensity quantified at right. Scale bar = 50 μm. Data are mean ± s.e.m. from a 3–6; b, c 3 independent experiments. n.s., not significant, *P ≤ 0.05. **P ≤ 0.01 by a, b ANOVA with a Tukey or b Bonferroni posthoc test; c Student’s t-test. *P ≤ 0.05, a (I10) F = 10.37; b F = 7.45
Fig. 6
Fig. 6
FAM134B over-expression enhances degradation of I1061T NPC1. a, b Over-expression of FLAG (control vector) or FAM134B-HA (FAM-HA) in CTRL and I1061T NPC1 fibroblasts. NPC1 protein levels were quantified by a western blot and b confocal microscopy. c Over-expression of FLAG (control vector) or FAM134B lacking the LC3 interacting domain (LIR-FAM-HA) in CTRL and I1061T NPC1 fibroblasts. NPC1 was analyzed by western blot. Quantified at right. Data are mean ± s.e.m. a N = 3–6 and c N = 3 independent experiments, b >32 cells per group. ac Student’s t-test; a (CTRL) t = 3.092, (I10) t = 3.113; b (I10) t = 5.511. n.s., not significant, *P ≤ 0.05, ****P ≤ 0.0001
Fig. 7
Fig. 7
I1061T NPC1 traffics to autophagosomes in vivo. a Seven-week-old I1061T/I1061T-Npc1, GFP-LC3 or wildtype-Npc1 (WT), GFP-LC3 mice were treated with vinblastine for 2 h. NPC1 (green) and LC3-GFP (red) in hepatocytes were visualized by confocal microscopy. Nuclei were stained with DAPI (blue). Due to expression differences and to prevent overexposure, WT and I1061T were imaged at different exposures. Scale bar = 25 μm. b Whole liver homogenates (Hom) from 7-week-old WT or I1061T-Npc1 mice, or fractions enriched for cytosol (Cyt), ER, autophagosomes (APG), autolysosomes (AUT), or lysosomes (Lys) were analyzed by western blot. Blots were probed for LC3 (autophagic compartments), calreticulin (ER), or glucocerebrosidase (GBA; lysosomes). NPC1 band intensity was normalized to total protein as determined by Ponceau S stain (see Supplementary Fig. 8a). c Left: Electron micrographs of livers from WT and I1061T-Npc1 mice. Yellow arrows: autophagosomes (APG); red arrows: autolysosomes (AUT). Inserts: Representative images of APG and AUT. * indicates ER inside APG. Graphs: Average number of APG and AUT per field (left) and average number of autophagosomes containing ER or other cargo (right) were calculated by morphometric analysis of N = 38 fields from 3 mice. Scale bar = 1 μm. d Electron micrographs of livers from WT and I1061T-Npc1 mice. Arrows indicate ER. Right: Average ER diameter calculated by morphometric analysis of N = 38 fields from 3 mice. Scale bar = 1 μm. Data are mean ± s.e.m. Student’s t-test (c); average AUT/field t = 3.2, average APG-ER t = 1.8; ER diameter t = 6. *P < 0.01, ***P < 0.0001. Scale bar: white—1 µm, black—0.2 µm
Fig. 8
Fig. 8
Flux through ER-phagy is altered in Niemann–Pick C mouse and patient brain. a Whole brain homogenates (Hom) from 7-week-old WT and I1061T-Npc1 (I10) mice, or fractions enriched for cytosol (Cyt), ER, autophagosomes (APG), autolysosomes (AUT), or lysosomes (Lys) were analyzed by western blot. Blots were probed for FAM134B. Quantified at right relative to total protein as determined by Ponceau S stain (see Supplementary Fig. 8a, b). b Relative FAM134B mRNA levels in the brain of 7-week-old WT and I1061T-Npc1 mice. c Cerebellar lysates from control (CTRL1, CTRL2) and Niemann–Pick C (NP1, NP2) subjects were analyzed by western blot. d Model of I1061T degradation by ERAD and ER-phagy. Data are mean ± s.e.m. from a, b N = 3 independent experiments. a ANOVA with Tukey’s post-hoc, F = 3.85, b Student’s t-test, n.s. = not significant, **P ≤ 0.01

References

    1. Ferris SP, Kodali VK, Kaufman RJ. Glycoprotein folding and quality-control mechanisms in protein-folding diseases. Dis. Models Mech. 2014;7:331–341. doi: 10.1242/dmm.014589. - DOI - PMC - PubMed
    1. Qi L, Tsai B, Arvan P. New insights into the physiological role of endoplasmic reticulum-associated degradation. Trends Cell Biol. 2017;27:430–440. doi: 10.1016/j.tcb.2016.12.002. - DOI - PMC - PubMed
    1. Pentchev PG, et al. A defect in cholesterol esterification in Niemann–Pick disease (type C) patients. Proc. Natl. Acad. Sci. U.S.A. 1985;82:8247–8251. doi: 10.1073/pnas.82.23.8247. - DOI - PMC - PubMed
    1. Higgins JJ, et al. A clinical staging classification for type C Niemann–Pick disease. Neurology. 1992;42:2286–2290. doi: 10.1212/WNL.42.12.2286. - DOI - PubMed
    1. Vanier MT, Millat G. Niemann–Pick disease type C. Clin. Genet. 2003;64:269–281. doi: 10.1034/j.1399-0004.2003.00147.x. - DOI - PubMed

Publication types

MeSH terms