. 2018 Sep 10;8(1):13544.
doi: 10.1038/s41598-018-31992-4.

Bioengineering functional smooth muscle with spontaneous rhythmic contraction in vitro

Affiliations

Bioengineering functional smooth muscle with spontaneous rhythmic contraction in vitro

Masae Kobayashi et al. Sci Rep. .

Abstract

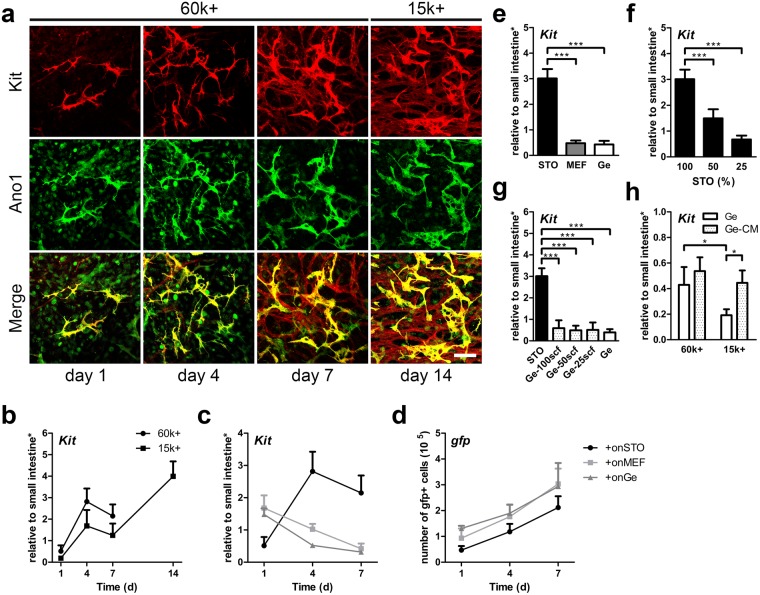
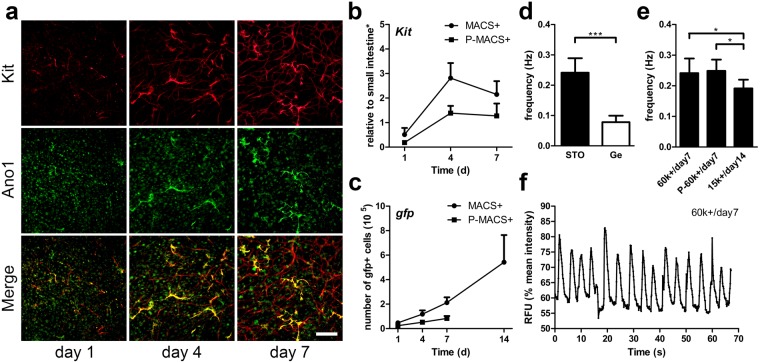
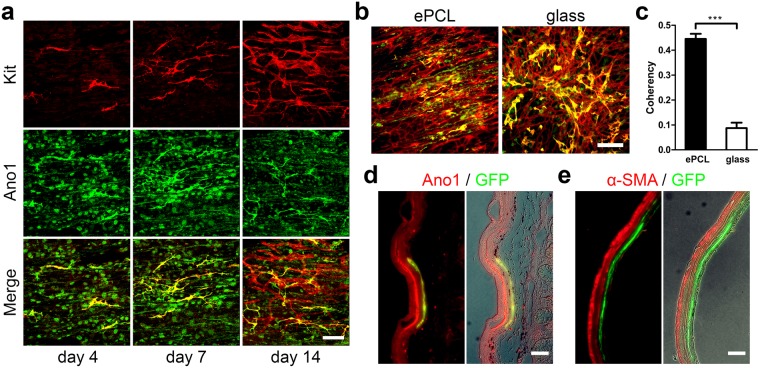
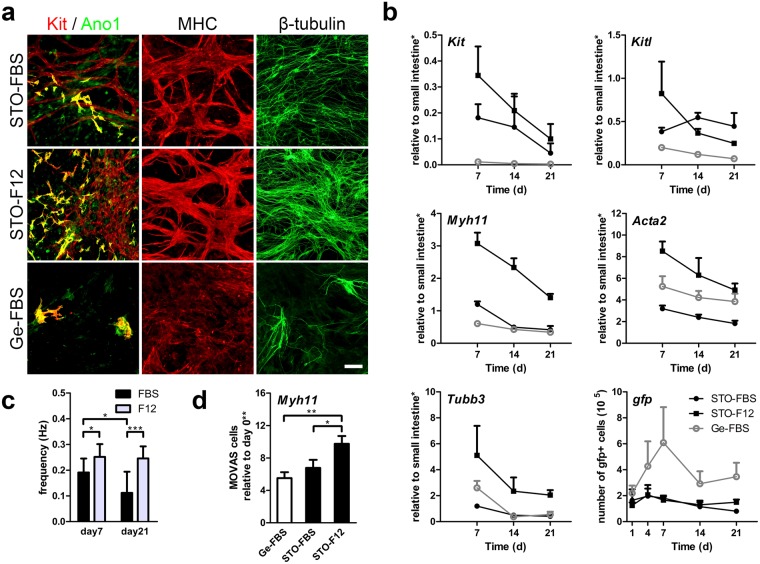
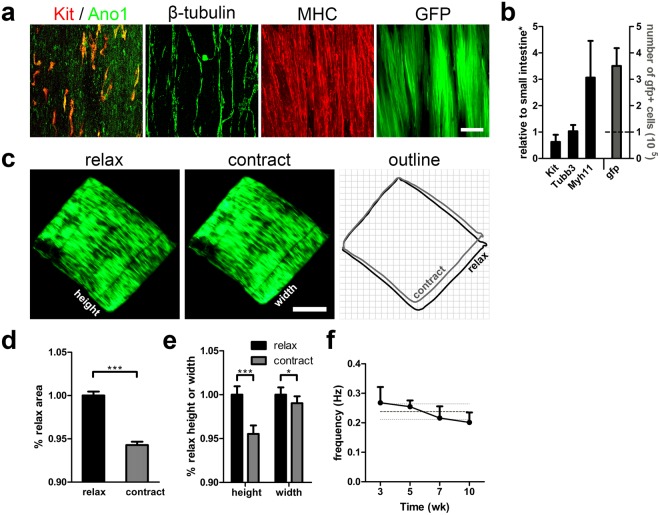
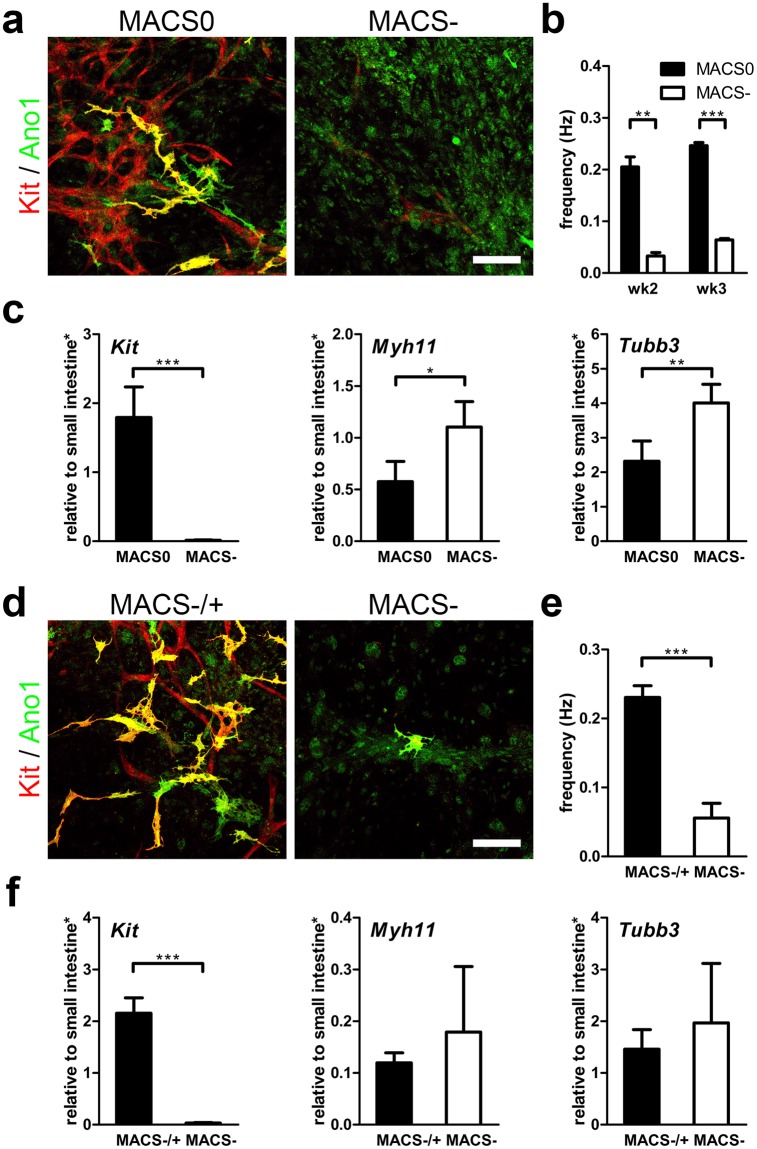
Oriented smooth muscle layers in the intestine contract rhythmically due to the action of interstitial cells of Cajal (ICC) that serve as pacemakers of the intestine. Disruption of ICC networks has been reported in various intestinal motility disorders, which limit the quality and expectancy of life. A significant challenge in intestinal smooth muscle engineering is the rapid loss of function in cultured ICC and smooth muscle cells (SMC). Here we demonstrate a novel approach to maintain the function of both ICC and SMC in vitro. Primary intestinal SMC mixtures cultured on feeder cells seeded electrospun poly(3-caprolactone) scaffolds exhibited rhythmic contractions with directionality for over 10 weeks in vitro. The simplicity of this system should allow for wide usage in research on intestinal motility disorders and tissue engineering, and may prove to be a versatile platform for generating other types of functional SMC in vitro.


Conflict of interest statement

The authors declare no competing interests.

Figures

Figure 1
Figure 1
Maintenance of MACS+ cells cultured on STO cells. (a) Confocal images of ICC markers, Kit (red), Ano1 (green), and co-localization (yellow). 60 k MACS+ and 15 k MACS+ cells were cultured for 7 days and 14 days respectively. Scale bar, 100 µm. (b) MACS+ cells were analyzed for Kit mRNA expression (bd: day 1, 4, 7 n = 4; day 14 n = 2). (c,d) GFP + MACS+ cells were seeded on STO cells, MEF, and Ge, cultured, and analyzed for mRNA expression of Kit (c) and gfp DNA (d). STO cells and MEF do not express Kit/gfp. (e) mRNA expression of Kit for MACS+ cells cultured on STO cells, MEF and Ge for 7 days. (f) mRNA expression of Kit for MACS+ cells cultured on different STO seeding densities for 7 days, where 100% is 100 k (100%, n = 5; 50%, n = 4; 25%, n = 2). (g) mRNA expression of Kit for MACS+ cells cultured on Ge for 7 days in media supplemented with 25, 50, or 100 ng/ml of soluble scf (n = 2). STO and Ge were controls (n = 5). (h) mRNA expression of Kit for 60 k or 15 k MACS+ cells cultured on Ge for 7 days supplemented with conditioned media from STO (Ge-CM), where Ge was the control (n = 4). STO = Mouse Embryonic Fibroblfast (Sandos Inbred Mouse, SIM). MEF = Mouse Embryonic Fibroblast (C57BL/6). Ge = gelatin coating. Feeder cells (STO, MEF) were mitomycin C treated. *Samples were normalized to de-epithelialized intestine. Error bars, s.d. ***P < 0.0001, *P < 0.05.
Figure 2
Figure 2
Maintenance of passaged MACS+ cells on STO cells and rhythmic pacemaker activity of cultured ICC (MACS+ and passaged MACS+ cells). 60 k sorted cells were cultured for 7 days unless otherwise noted. (a) Immunofluorescence of passaged MACS+ (P-MACS+) cells with ICC markers, Kit (red) and Ano1 (green) and with co-localization (yellow). MACS+ cells were cultured on STO cells for 7 days and were passaged and sorted with MACS (P-MACS+). P-MACS+ cells were subsequently cultured on STO cells. Scale bar, 200 µm. (b,c) Growth comparison of GFP + MACS+ and P-MACS+ cells with mRNA expression of Kit (b) and DNA expression of gfp (c). (b,c: day 1, 4, 7 n = 4; day 14 n = 2). (df) Oscillations in intracellular Ca2+ concentration demonstrated the rhythmic pacemaker activity in MACS+ and P-MACS+ ICC cultures and their frequency were measured. (d) Ca2+ oscillation frequency of MACS+ cells cultured on STO cells or Ge at day 7 (n ≥ 5). (e) Ca2+ oscillation frequency of 60 k MACS+ and 60 k P-MACS+ cells cultured on STO cells at day 7, and the frequency of 15 k MACS+ cells cultured on STO cells at day 14 (n ≥ 5). (f) Representative time-course change in fluorescence intensity due to Ca2+ oscillation of ICC in the culture of MACS+ cells on STO cells at day 7 (Supplementary Video 1). *Samples were normalized to de-epithelialized intestine. Error bars, s.d. ***P < 0.0001, *P < 0.05.
Figure 3
Figure 3
Application of MACS+ cells cultured on STO cells. (a) Confocal images of ICC markers, Kit (red), Ano1 (green), and co-localization (yellow). 15 k MACS+ cells were cultured on STO-seeded ePCL scaffold for 14 days. Scale bar, 100 µm. (b,c) Quantification of Kit alignment expressed by 15 k MACS+ cells cultured on STO-seeded ePCL and glass for 14 days. (b) Immunofluorescence of ICC markers, Kit (red) and Ano1 (green) and with co-localization (yellow). Scale bar, 200 µm. (c) Coherency analysis of Kit expression of MACS+ cells cultured on ePCL(aligned) and glass (random), where higher coherency means greater cell alignment (n = 5). (d,e) GFP + MACS+ cells were cultured on STO cells for 4 days and purified using MACS before colonoscopic injection into the submucosa of the rectum of C57BL/6 mice. A permanent carbon ink was mixed into the cell suspension to mark injection sites. The injected rectums were retrieved after 7 days, and were immunostained for Ano1 (d, red), α-SMA (e, red) and GFP (d,e, green). GFP co-localized with Ano1 (d, yellow) but not with α-SMA (e). Merged immunofluorescence images (left) were further merged with phase contrast images to show the area of injection indicated by black ink (right). Scale bar, 100 µm. Insets, higher-magnification images of boxed regions. Scale bar, 10 µm. Error bars, s.d. ***P < 0.0001.
Figure 4
Figure 4
Maintenance of intestinal smooth muscle cell mixture (ISMC Mix) and vascular aortic smooth muscle cell line (MOVAS cells) cultured on STO cells in vitro. Non-sorted cells from enzymatically digested intestinal muscle strips were used as ISMC Mix. All ISMC Mix and MOVAS cells were cultured separately in FBS medium for the first 4 days followed by FBS or F12 medium. (ac) 100 k ISMC Mix were cultured on STO cells or Ge with FBS or F12 medium for up to 3 weeks. (a) Immunofluorescence of ISMC Mix with ICC markers showing co-localization (yellow) of Kit (red) and Ano1 (green), SMCs marker MHC (red), and neuronal marker β-tubulin (green) at day 7. Scale bar, 100 µm. (b) GFP + ISMC Mix were analyzed for mRNA expression (Kit, Myh11, Tubb3, Kitl, and Acta2) and gfp DNA (n = 3). (c) Spontaneous contraction demonstrated the functionality of ISMC Mix cultured on STO cells with FBS or F12 medium (Supplementary Video 2 and 3) and frequency was measured (n ≥ 5). (d) MOVAS cells were analyzed for mRNA expression (Myh11) at day 7 (n = 3; triplicate samples). FBS = 15% FBS in DMEM. F12 = advanced DMEM/F12. *Samples were normalized to de-epithelialized intestine. **Samples were normalized to 100 k cells from day 0. Error bars, s.d. ***P < 0.0001, *P < 0.05.
Figure 5
Figure 5
Engineering aligned intestinal smooth muscle with periodic contraction over 10 weeks in vitro. 100 k ISMC Mix were cultured on STO cells seeded ePCL scaffolds in FBS medium for the first 4 days before changing to F12 medium. (a) Confocal images of ISMC Mix with ICC markers showing co-localization (yellow) of Kit (red) and Ano1 (green), SMCs marker MHC (red), neuronal marker β-tubulin (green), and GFP (green) at 10 weeks. Scale bar, 100 µm. (b) GFP + ISMC Mix were analyzed for mRNA expression (Kit, Myh11, Tubb3, Kitl, and Acta2) (n = 5) and gfp DNA (n = 4). The dashed line indicates the seeding density. (ce) Relaxed and contracted state comparison of engineered intestinal smooth muscle. (c) Images of GFP expression from ISMC Mix seeded ePCL scaffold were extracted from a video recording and outlined (relax, black; contract, gray) for comparison. Scale bar, 2 mm (Supplementary Video 4). (d) To show the degree of the periodic contraction, area of contracted ePCL scaffolds were normalized to that of relaxed ePCL scaffolds (n = 10). (e) To show the directionality of the periodic constriction, height and width of contracted ePCL scaffolds were normalized to those of relaxed ePCL scaffolds (n = 10). (f) Frequency of ePCL rhythmic contractions (n = 4). The dark gray dashed line indicates the mean frequency over time and light gray dashed lines indicate its s.d. *Samples were normalized to de-epithelialized intestine. Error bars, s.d. ***P < 0.0001, *P < 0.05.
Figure 6
Figure 6
MACS+ cells’ role in cultured ISMC Mix with rhythmic contractions in vitro. (ac) 100 k MACS0 (passaged ISMC Mix: mixture of MACS+ cells, SMCs and neuronal cells) or MACS− cells (ISMC Mix without MACS+ cells: mostly SMCs and neuronal cells) were cultured on STO cells for 3 weeks. Cells were seeded and cultured in FBS medium for the first 4 days before changing to F12 medium. (df) 100 k MACS− were seeded on STO cells for 5 weeks, with (MACS−/+) or without (MACS−) addition of 60 k MACS+ cells on day 5. Cells were cultured in FBS medium for the first 7 days before changing to F12 medium. (a,d) Confocal images of ICC markers, Kit (red), Ano1 (green), co-localization (yellow). Scale bar, 100 µm. (b,e) Frequency of cultured cells motility due to spontaneous contraction (b: wk2 n = 2, wk3 n = 4; (e) wk5 n = 4). (c,f) Cultured cells were analyzed for mRNA expression (Kit, Myh11, Tubb3) at week 2 (c) or week 5 (f) (n = 4). *Samples were normalized to de-epithelialized intestine. Error bars, s.d. ***P < 0.0001, **P < 0.01, *P < 0.05.

Similar articles

Cited by

References

    1. Bines JE. Intestinal failure: A new era in clinical management. J. Gastroenterol. Hepatol. 2009;24:S86–S92. doi: 10.1111/j.1440-1746.2009.06077.x. - DOI - PubMed
    1. Donohoe CL, Reynolds JV. Short bowel syndrome. Surgeon. 2010;8:270–9. doi: 10.1016/j.surge.2010.06.004. - DOI - PubMed
    1. Sato T, et al. Single Lgr5 stem cells build crypt–villus structures in vitro without a mesenchymal niche. Nature. 2009;459:262–265. doi: 10.1038/nature07935. - DOI - PubMed
    1. Sala FG, Kunisaki SM, Ochoa ER, Vacanti J, Grikscheit TC. Tissue-Engineered Small Intestine and Stomach Form from Autologous Tissue in a Preclinical Large Animal Model. J. Surg. Res. 2009;156:205–212. doi: 10.1016/j.jss.2009.03.062. - DOI - PubMed
    1. Jain RK, Au P, Tam J, Duda DG, Fukumura D. Engineering vascularized tissue. Nat. Biotechnol. 2005;23:821–823. doi: 10.1038/nbt0705-821. - DOI - PubMed

Publication types

MeSH terms