

Loss of solute carrier family 7 member 2 exacerbates inflammation-associated colon tumorigenesis
- PMID: 30202097
- PMCID: PMC6377304
- DOI: 10.1038/s41388-018-0492-9
Loss of solute carrier family 7 member 2 exacerbates inflammation-associated colon tumorigenesis
Abstract
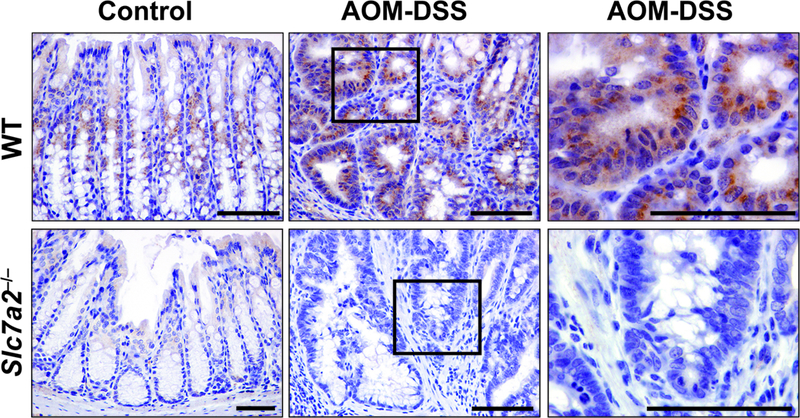
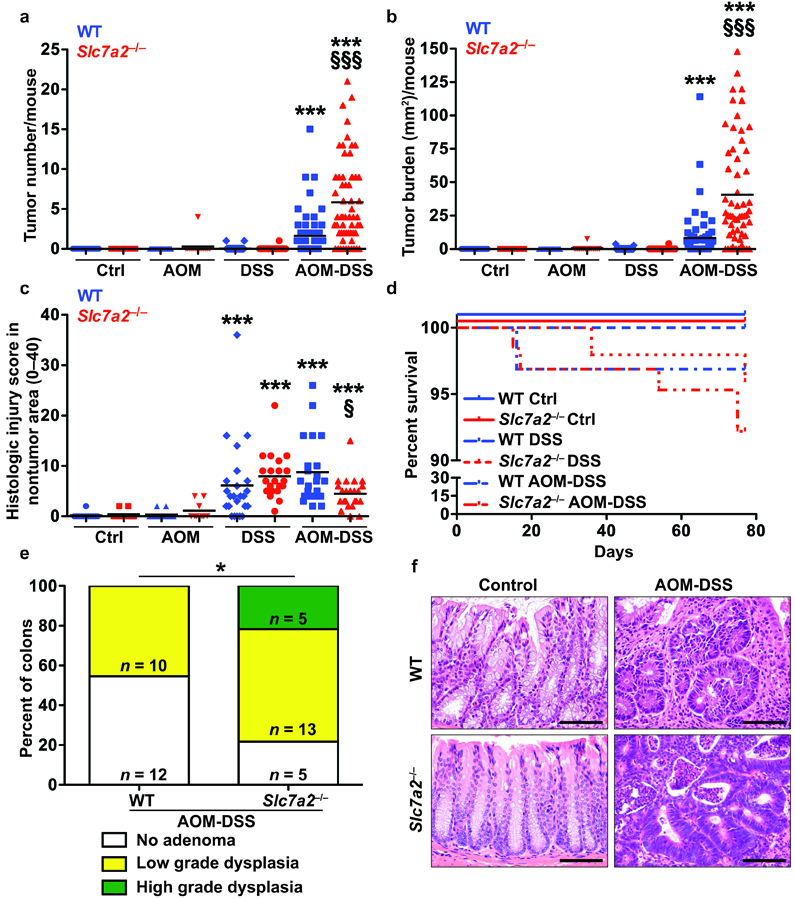
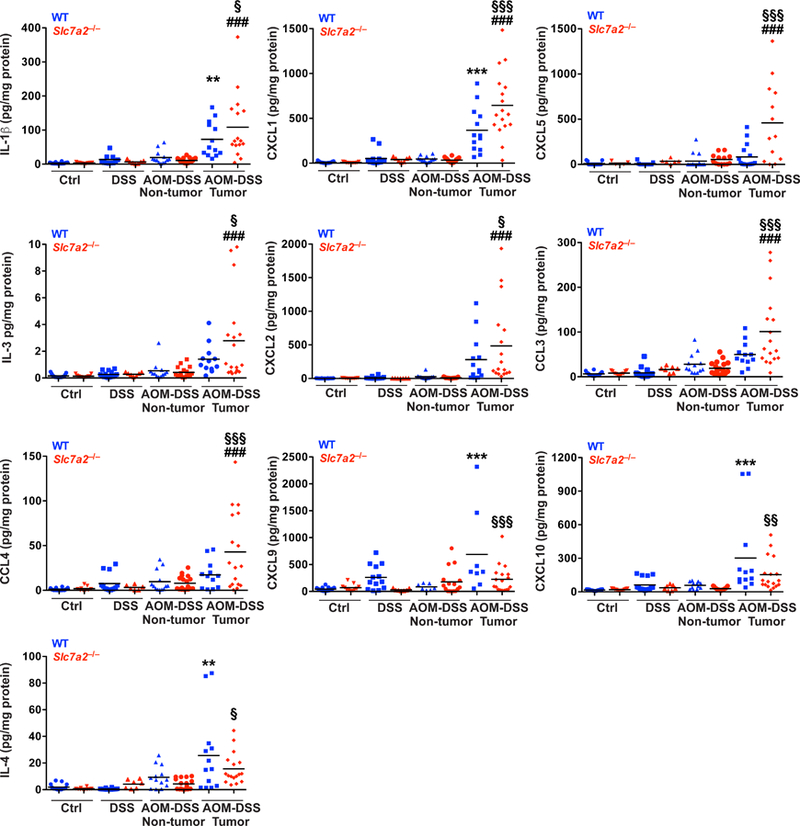
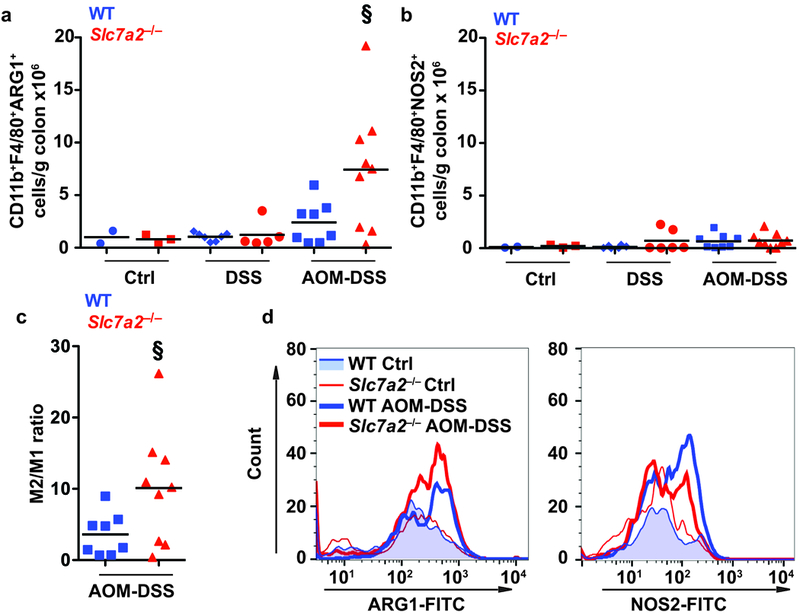
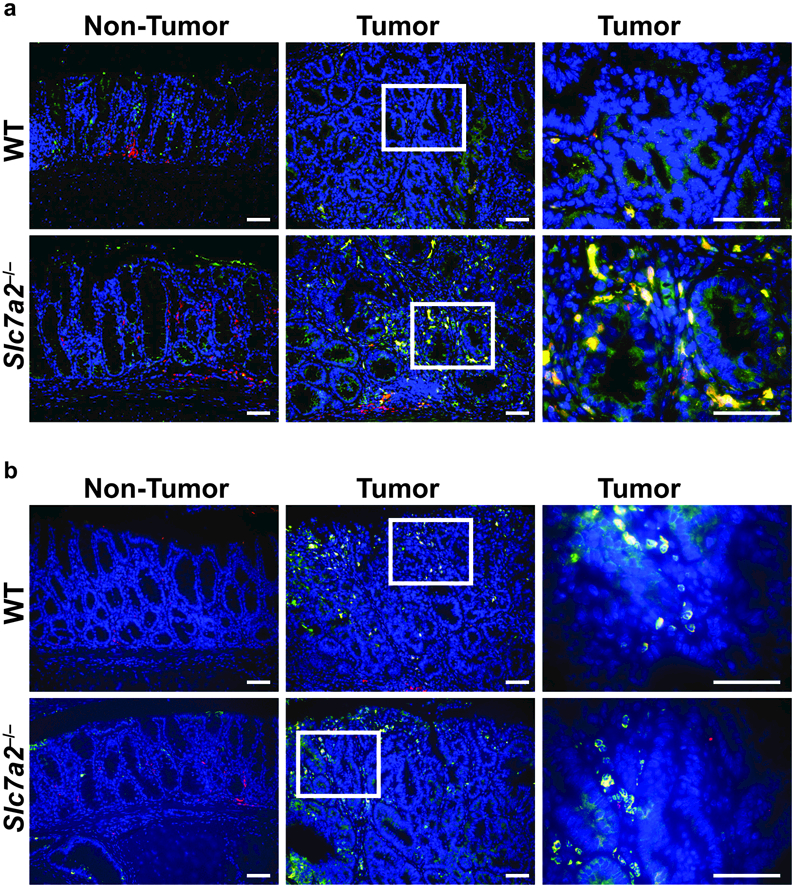
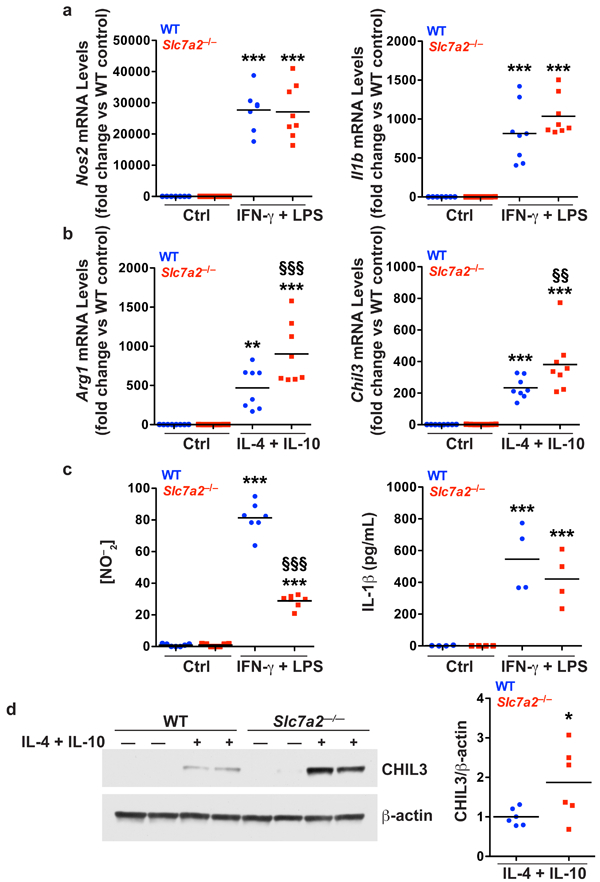
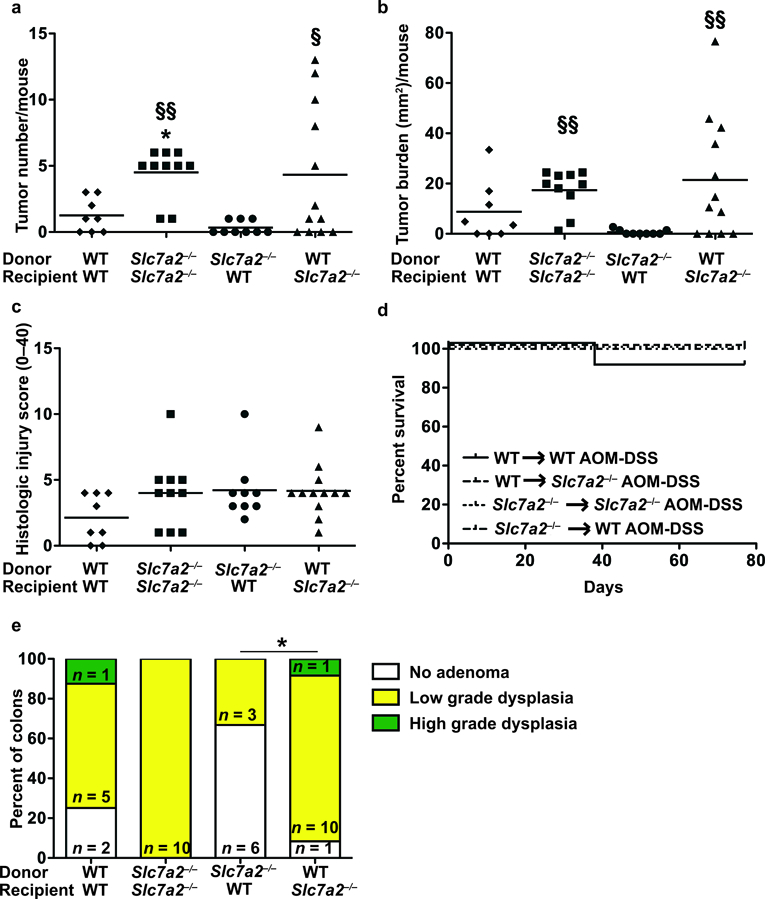
Solute carrier family 7 member 2 (SLC7A2, also known as CAT2) is an inducible transporter of the semi-essential amino acid L-arginine (L-Arg), which has been implicated in wound repair. We have reported that both SLC7A2 expression and L-Arg availability are decreased in colonic tissues from inflammatory bowel disease patients and that mice lacking Slc7a2 exhibit a more severe disease course when exposed to dextran sulfate sodium (DSS) compared to wild-type (WT) mice. Here, we present evidence that SLC7A2 plays a role in modulating colon tumorigenesis in the azoxymethane (AOM)-DSS model of colitis-associated carcinogenesis (CAC). SLC7A2 was localized predominantly to colonic epithelial cells in WT mice. Utilizing the AOM-DSS model, Slc7a2-/- mice had significantly increased tumor number, burden, and risk of high-grade dysplasia vs. WT mice. Tumors from Slc7a2-/- mice exhibited significantly increased levels of the proinflammatory cytokines/chemokines IL-1β, CXCL1, CXCL5, IL-3, CXCL2, CCL3, and CCL4, but decreased levels of IL-4, CXCL9, and CXCL10 compared to tumors from WT mice. This was accompanied by a shift toward pro-tumorigenic M2 macrophage activation in Slc7a2-deficient mice, as marked by increased colonic CD11b+F4/80+ARG1+ cells with no alteration in CD11b+F4/80+NOS2+ cells by flow cytometry and immunofluorescence microscopy. The shift toward M2 macrophage activation was confirmed in bone marrow-derived macrophages from Slc7a2-/- mice. In bone marrow chimeras between Slc7a2-/- and WT mice, the recipient genotype drove the CAC phenotype, suggesting the importance of epithelial SLC7A2 in abrogating neoplastic risk. These data reveal that SLC7A2 has a significant role in the protection from CAC in the setting of chronic colitis, and suggest that the decreased SLC7A2 in inflammatory bowel disease (IBD) may contribute to CAC risk. Strategies to enhance L-Arg availability by supplementing L-Arg and/or increasing L-Arg uptake could represent a therapeutic approach in IBD to reduce the substantial long-term risk of colorectal carcinoma.
Conflict of interest statement
CONFLICT OF INTEREST
The authors declare that no conflict of interest exists.
Figures
References
-
- Brower V Feeding the flame: new research adds to role of inflammation in cancer development. J Natl Cancer Inst 2005; 97: 251–253. - PubMed
-
- Feagins LA, Souza RF, Spechler SJ. Carcinogenesis in IBD: potential targets for the prevention of colorectal cancer. Nat Rev Gastroenterol Hepatol 2009; 6: 297–305. - PubMed
-
- Terzic J, Grivennikov S, Karin E, Karin M. Inflammation and colon cancer. Gastroenterology 2010; 138: 2101–2114 e2105. - PubMed
-
- Herrinton LJ, Liu L, Levin TR, Allison JE, Lewis JD, Velayos F. Incidence and mortality of colorectal adenocarcinoma in persons with inflammatory bowel disease from 1998 to 2010. Gastroenterology 2012; 143: 382–389. - PubMed
Publication types
MeSH terms
Substances
Grants and funding
- T32 DK007673/DK/NIDDK NIH HHS/United States
- P01CA116087/U.S. Department of Health & Human Services | NIH | National Cancer Institute (NCI)/International
- R01 CA190612/CA/NCI NIH HHS/United States
- T32DK007673/U.S. Department of Health & Human Services | NIH | National Institute of Diabetes and Digestive and Kidney Diseases (National Institute of Diabetes & Digestive & Kidney Diseases)/International
- R01 AT004821/AT/NCCIH NIH HHS/United States
- P01CA028842/U.S. Department of Health & Human Services | NIH | National Cancer Institute (NCI)/International
- T32 GM008554/GM/NIGMS NIH HHS/United States
- 1IK2BX002126/U.S. Department of Veterans Affairs (VA)/International
- P50 CA236733/CA/NCI NIH HHS/United States
- P30DK058404/U.S. Department of Health & Human Services | NIH | National Institute of Diabetes and Digestive and Kidney Diseases (National Institute of Diabetes & Digestive & Kidney Diseases)/International
- R01 DK053620/DK/NIDDK NIH HHS/United States
- P01 CA028842/CA/NCI NIH HHS/United States
- R01DK053620/U.S. Department of Health & Human Services | NIH | National Institute of Diabetes and Digestive and Kidney Diseases (National Institute of Diabetes & Digestive & Kidney Diseases)/International
- R01CA190612/U.S. Department of Health & Human Services | NIH | National Cancer Institute (NCI)/International
- P30 DK058404/DK/NIDDK NIH HHS/United States
- F31DK10715/U.S. Department of Health & Human Services | NIH | National Institute of Diabetes and Digestive and Kidney Diseases (National Institute of Diabetes & Digestive & Kidney Diseases)/International
- R01AT004821/U.S. Department of Health & Human Services | NIH | National Institute of Diabetes and Digestive and Kidney Diseases (National Institute of Diabetes & Digestive & Kidney Diseases)/International
- R01AT004821/U.S. Department of Health & Human Services | NIH | National Center for Complementary and Integrative Health (NCCIH)/International
- P01 CA116087/CA/NCI NIH HHS/United States
- I01 BX001453/BX/BLRD VA/United States
- IK2 BX002126/BX/BLRD VA/United States
- I01BX001453/U.S. Department of Veterans Affairs (VA)/International
- 3R01AT004821-02S1/U.S. Department of Health & Human Services | NIH | National Center for Complementary and Integrative Health (NCCIH)/International
LinkOut - more resources
Full Text Sources
Other Literature Sources
Molecular Biology Databases
Research Materials
Miscellaneous
