

Prolonged cognitive-motor impairments in children and adolescents with a history of concussion
- PMID: 30202556
- PMCID: PMC6094154
- DOI: 10.2217/cnc-2016-0001
Prolonged cognitive-motor impairments in children and adolescents with a history of concussion
Abstract
Aim: We investigated whether children and adolescents with concussion history show cognitive-motor integration (CMI) deficits.
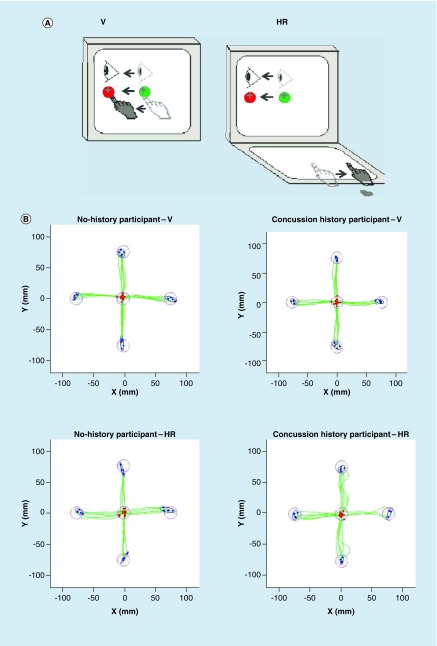
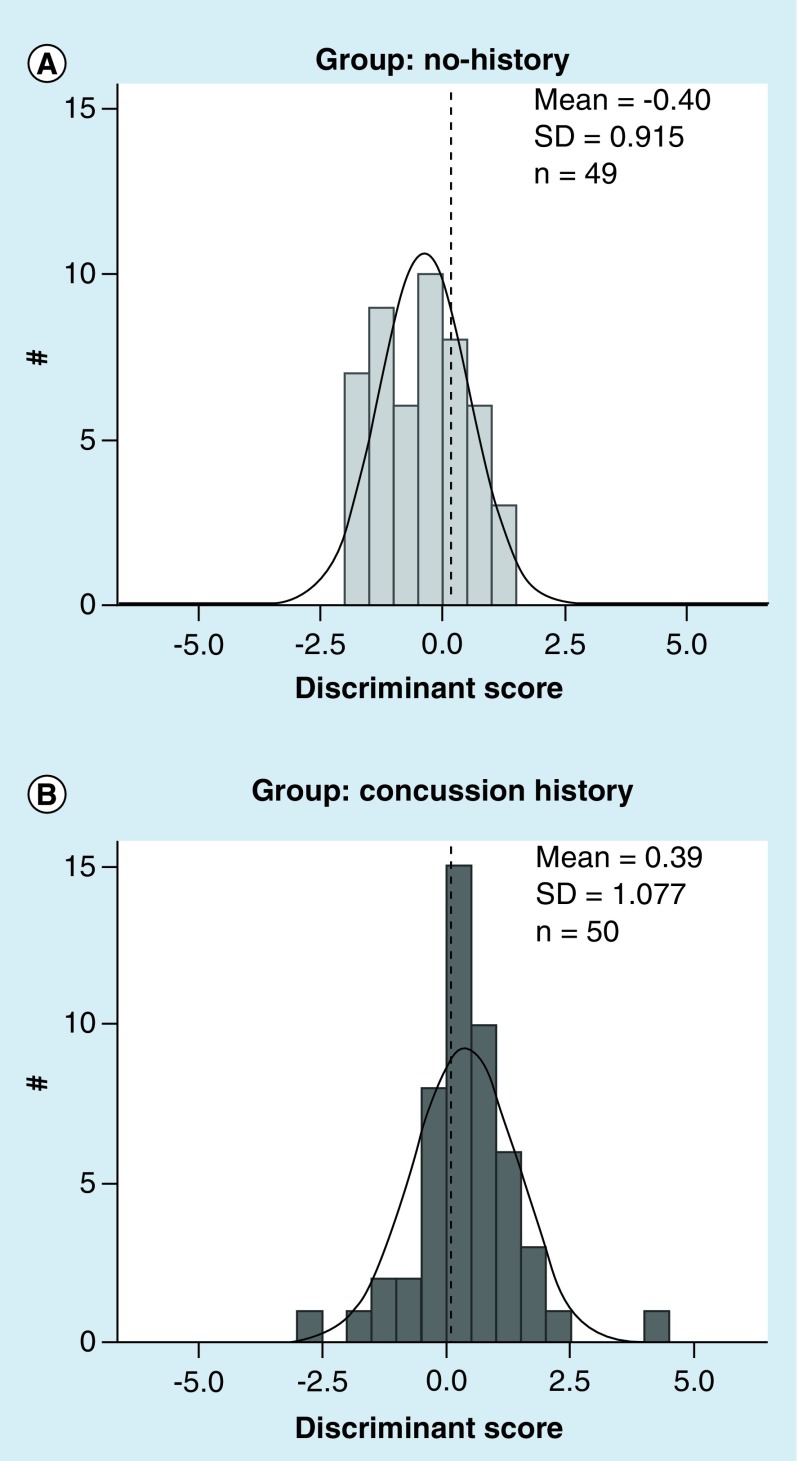
Method: Asymptomatic children and adolescents with concussion history (n = 50; mean 12.84 years) and no history (n = 49; mean: 11.63 years) slid a cursor to targets using their finger on a dual-touch-screen laptop; target location and motor action were not aligned in the CMI task.
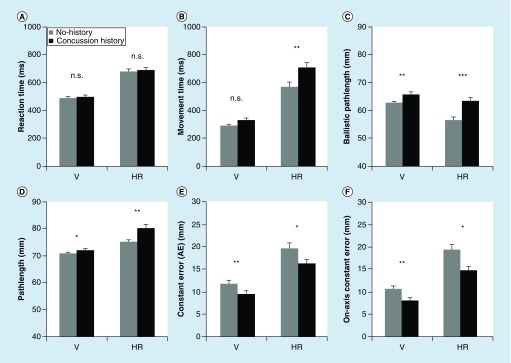
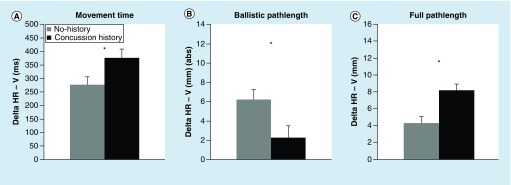
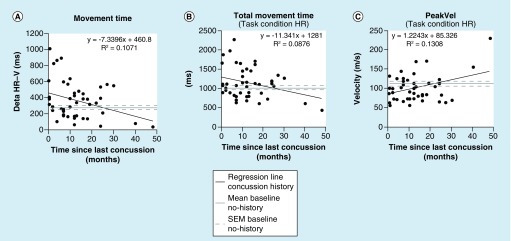
Results: Children and adolescents with concussion history showed prolonged CMI deficits, in that their performance did not match that of no history controls until nearly 2 years postevent.
Conclusion: These CMI deficits may be due to disruptions in fronto-parietal networks, contributing to an increased vulnerability to further injury. Current return-to-play assessments that do not test CMI may not fully capture functional abilities postconcussion.
Keywords: cognitive–motor integration; performance; youth.
Conflict of interest statement
Financial & competing interests disclosure Funding provided by the Canadian Institutes of Health Research operating grant #125915 (L Sergio, A Macpherson), and the Donald Sanderson Memorial Trust. The authors have no other relevant affiliations or financial involvement with any organization or entity with a financial interest in or financial conflict with the subject matter or materials discussed in the manuscript apart from those disclosed. No writing assistance was utilized in the production of this manuscript.
Figures
Similar articles
-
Sport experience is correlated with complex motor skill recovery in youth following concussion.Eur J Sport Sci. 2019 Oct;19(9):1257-1266. doi: 10.1080/17461391.2019.1584249. Epub 2019 Mar 17. Eur J Sport Sci. 2019. PMID: 30880595
-
Cognitive-motor integration deficits in young adult athletes following concussion.BMC Sports Sci Med Rehabil. 2015 Oct 19;7:25. doi: 10.1186/s13102-015-0019-4. eCollection 2015. BMC Sports Sci Med Rehabil. 2015. PMID: 26491541 Free PMC article.
-
White Matter Integrity and Its Relationship to Cognitive-Motor Integration in Females with and without Post-Concussion Syndrome.J Neurotrauma. 2020 Jul 1;37(13):1528-1536. doi: 10.1089/neu.2019.6765. Epub 2020 Mar 18. J Neurotrauma. 2020. PMID: 31928154
-
Cognitive-motor interference during functional mobility after stroke: state of the science and implications for future research.Arch Phys Med Rehabil. 2013 Dec;94(12):2565-2574.e6. doi: 10.1016/j.apmr.2013.08.002. Epub 2013 Aug 20. Arch Phys Med Rehabil. 2013. PMID: 23973751 Free PMC article. Review.
-
American Medical Society for Sports Medicine position statement: concussion in sport.Br J Sports Med. 2013 Jan;47(1):15-26. doi: 10.1136/bjsports-2012-091941. Br J Sports Med. 2013. PMID: 23243113 Review.
Cited by
-
Sex-related differences in visuomotor skill recovery following concussion in working-aged adults.BMC Sports Sci Med Rehabil. 2022 Apr 20;14(1):72. doi: 10.1186/s13102-022-00466-6. BMC Sports Sci Med Rehabil. 2022. PMID: 35443693 Free PMC article.
-
A History of Concussion Affects Relevancy-Based Modulation of Cortical Responses to Tactile Stimuli.Front Integr Neurosci. 2020 Jul 3;14:33. doi: 10.3389/fnint.2020.00033. eCollection 2020. Front Integr Neurosci. 2020. PMID: 32719591 Free PMC article.
-
Potential for the development of light therapies in mild traumatic brain injury.Concussion. 2018 Oct 15;3(3):CNC57. doi: 10.2217/cnc-2018-0006. eCollection 2018 Oct. Concussion. 2018. PMID: 30370058 Free PMC article. Review.
-
Patterns of Change in Functional Connectivity and Motor Performance Are Different in Youth Recently Recovered from Concussion.Neurotrauma Rep. 2025 Jan 22;6(1):53-67. doi: 10.1089/neur.2024.0122. eCollection 2025. Neurotrauma Rep. 2025. PMID: 39882312 Free PMC article.
-
An exploration of the antecedents and mechanisms causing athletes' stress and twisties symptom.Heliyon. 2022 Oct 13;8(10):e11040. doi: 10.1016/j.heliyon.2022.e11040. eCollection 2022 Oct. Heliyon. 2022. PMID: 36276731 Free PMC article.
References
-
- Faul M, Xu L, Wald MM, Coronado VG. GA, USA: Centers for Disease Control and Prevention. Traumatic brain injury in the United States.www.cdc.gov/traumaticbraininjury/pdf/blue_book.pdf
-
- Guskiewicz KM, McCrea M, Marshall SW, et al. Cumulative effects associated with recurrent concussion in collegiate football players: the NCAA Concussion Study. JAMA. 2003;290(19):2549–2555. - PubMed
-
- Karlin AM. Concussion in the pediatric and adolescent population: “different population, different concerns”. PM R. 2011;3(10):S369–S379. - PubMed
-
- Buzzini SRR, Guskiewicz KM. Sport-related concussion in the young athlete. Curr. Opin. Pediatr. 2006;18(4):376–382. - PubMed
-
- Guskiewicz KM, Marshall SW, Bailes J, et al. Association between recurrent concussion and late-life cognitive impairment in retired professional football players. Neurosurgery. 2005;57(4):719–726. - PubMed
LinkOut - more resources
Full Text Sources
Other Literature Sources