Review
. 2017 Aug 3;2(3):CNC36.
doi: 10.2217/cnc-2016-0029. eCollection 2017 Nov.

Understanding the effects of mild traumatic brain injury on the pupillary light reflex

Affiliations
Review

Understanding the effects of mild traumatic brain injury on the pupillary light reflex

Kenneth J Ciuffreda et al. Concussion. .

Abstract

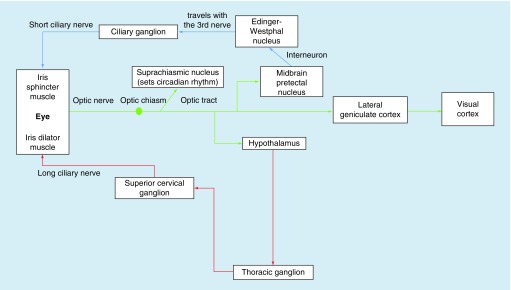
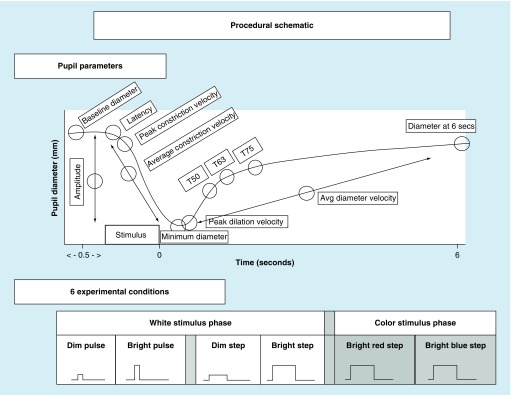
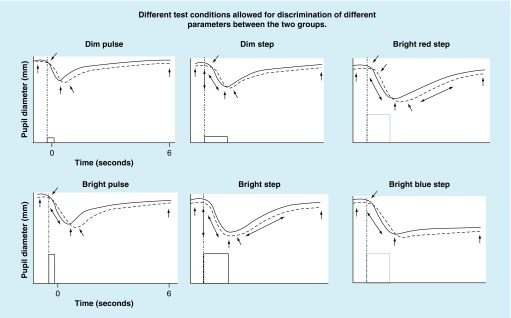
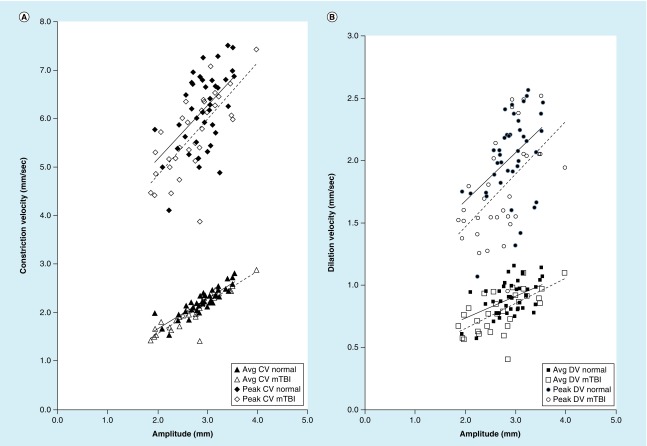
The pupillary light reflex represents an optimal visual system to investigate and exploit in the mild traumatic brain injury (mTBI) population. Static and dynamic aspects of the pupillary light reflex were investigated objectively and quantitatively in the mTBI population. Pupillary responsivity was found to be significantly delayed, slowed and reduced, but symmetrical in nature, and with a smaller baseline diameter, as compared with normals. Several pupillary parameters also discriminated between those with versus without photosensitivity. Thus, dynamic pupillometry provides several objective biomarkers for the presence of mTBI and photosensitivity, gives insight into the global sites of neurological dysfunction and possible related mechanisms, and should result in improved patient care.

Keywords: PLR; mTBI; mild traumatic brain injury; photosensitivity; pupillary light reflex.


Conflict of interest statement

Financial & competing interests disclosure The authors have no relevant affiliations or financial involvement with any organization or entity with a financial interest in or financial conflict with the subject matter or materials discussed in the manuscript. This includes employment, consultancies, honoraria, stock ownership or options, expert testimony, grants or patents received or pending, or royalties. No writing assistance was utilized in the production of this manuscript.

Figures

<b>Figure 1.</b>
Figure 1.. Schematic of the afferent and efferent arms of the sympathetic and parasympathetic neural pathways circuitry of the pupillary light reflex.
Reprinted with permission from [11]
<b>Figure 2.</b>
Figure 2.. Dynamic pupillary response profile and stimulus conditions.
Top: Schematic representation of a pupil response profile and the associated pupil parameters assessed as indicated by the open circles. The prestimulus time is 0.5 s, and the post-stimulus time is 6.0 s. Bottom: Schematic representation of the six possible experimental test stimulus conditions. The x-axis represents the relative time, and the y-axis represents the relative stimulus intensity. Dim = 4 lux, bright = 251 lux, pulse = 100 ms and step = 1000 ms. Reprinted with permission from [11].
<b>Figure 3.</b>
Figure 3.. Schematic representation of pupillary response profiles for the six test conditions and two diagnostic groups.
The solid lines represent the typical normal response, and the broken lines represent the typical mild traumatic brain injury response for each of the six test conditions. The arrows depict the abnormal parameters found in the mild traumatic brain injury group as compared statistically to the normal group (p < 0.05). Reprinted with permission from [11]
<b>Figure 4.</b>
Figure 4.. Main sequence relation.
(A) The main sequence for peak constriction velocity (top), and average constriction velocity (bottom), under the optimal test stimulus condition (bright red step), (B) the main sequence for peak dilation velocity (top) and average dilation velocity (bottom), under the optimal test stimulus condition (bright red step). The solid line represents the normal group, and the broken line represents the mTBI group. All four velocity parameters were significantly different (p < 0.05) under this condition, being slower in the mTBI group. Avg CV: Average constriction velocity; Avg DV: Average dilation velocity; CV: Constriction velocity; DV: Dilation velocity; mTBI: Mild traumatic brain injury. Reprinted with permission from [11]
<b>Figure 5.</b>
Figure 5.. Receiver operating characteristics curve for two selected parameters under different test conditions.
Cutpoints for peak dilation velocity and constriction latency were combined to produce this receiver operating characteristics curve. The latency cutpoint was set at 1 standard deviation longer than the normal mean, while the cutpoint for peak dilation velocity was varied. PDV: Peak dilation velocity; ROC: Receiver operating curve. Reprinted with permission from [11].
<b>Figure 6.</b>
Figure 6.. Plotted is pupil diameter as a function of time.
(A) Schematic representation of the global average of the white and red condition pupil response for the mild traumatic brain injury group. (B) Schematic representation of the average bright blue step condition pupil responses for the mild traumatic brain injury group. (C) Schematic representation of the global average of the white and red condition pupil response for the normal group. (D) Schematic representation of the average bright blue step condition pupil responses for the normal group. The open circles indicate the statistically significant pupil parameters that differentiated those with versus without photosensitivity in both diagnostic groups. The triangles show the T50 and T75 response differences in the two profiles. Reprinted with permission from [11].
<b>Figure 7.</b>
Figure 7.. Proposed photosensitivity flowchart to describe the possible mechanisms that may underlie the findings of the present study in both diagnostic groups.
Reprinted with permission from [11].
<b>Figure 8.</b>
Figure 8.. Selected representative pupillary parameter profiles as a function of refractive error in diopters showing the three general response categories.
Data points represent the mean value for each subject. Closed circles represent the normals, and open circles represent those with mTBI. Solid lines represent the best fit for the normals, and dashed lines represent the best fit for those with mTBI. Time is in seconds. Avg DV: Average dilation velocity in mm/second; Max DV: Maximum dilation velocity in mm/second; RE: Refractive error.

References

    1. Blennow K, Brody DL, Kochanek PM, et al. Traumatic brain injuries. Nat. Rev. Dis. Primer. 2016;2:e16084. - PubMed
    1. Ciuffreda KJ, Ludlam DL, Yadav NK, Thiagarajan P. Traumatic brain injury: visual consequences, diagnosis, and treatment. In: Myron Y, editor. Advances in Ophthalmology and Optometry. Elsevier; PA, USA: 2016. pp. 307–330.
    2. • Provides a comprehensive overview of vision problems in mild traumatic brain injury.

    1. Suchoff IB, Ciuffreda KJ, Kapoor N. Visual and Vestibular Consequences of Acquired Brain Injury. Optometric Extension Program Foundation; CA, USA: 2001.
    1. Thiagarajan P. New York: SUNY College of Optometry; 2013. Oculomotor rehabilitation for reading dysfunction in mild traumatic brain injury.http://hdl.handle.net/1951/60357
    1. Zasler ND, Katz DI, Zafonte RD. Brain Injury Medicine: Principles and Practice. Demos Medical Publishing; OR, USA: 2012.
    2. • Provides a comprehensive overview of the physiological and neurological consequences of traumatic brain injury in general.