. 2018 Aug 23;2(9):1064-1079.
doi: 10.1002/hep4.1210. eCollection 2018 Sep.

Abundance of Cytochromes in Hepatic Extracellular Vesicles Is Altered by Drugs Related With Drug-Induced Liver Injury

Affiliations

Abundance of Cytochromes in Hepatic Extracellular Vesicles Is Altered by Drugs Related With Drug-Induced Liver Injury

Laura Palomo et al. Hepatol Commun. .

Abstract

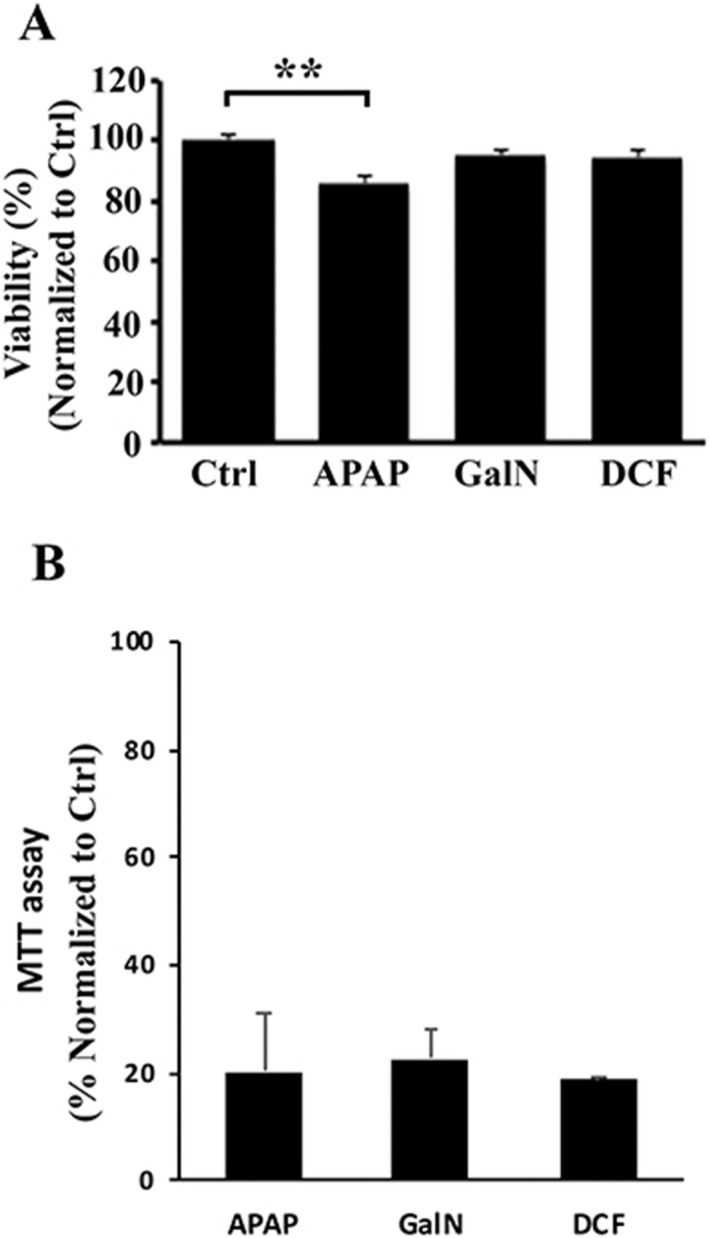
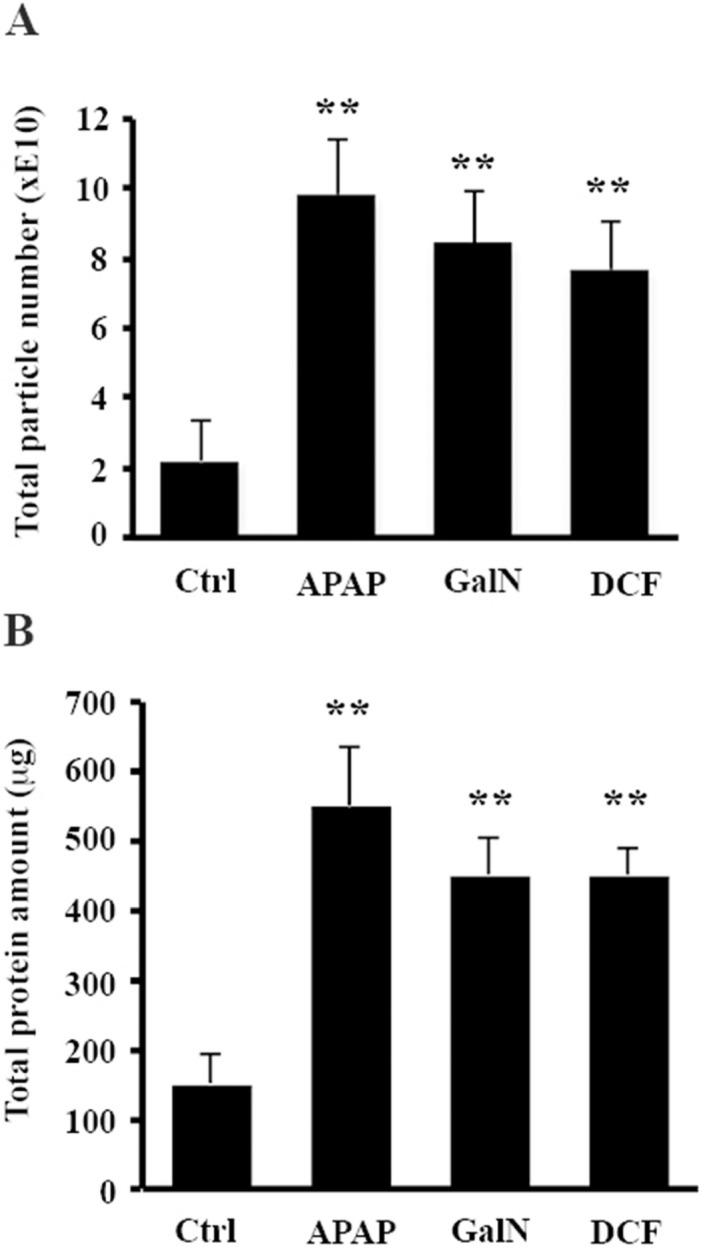
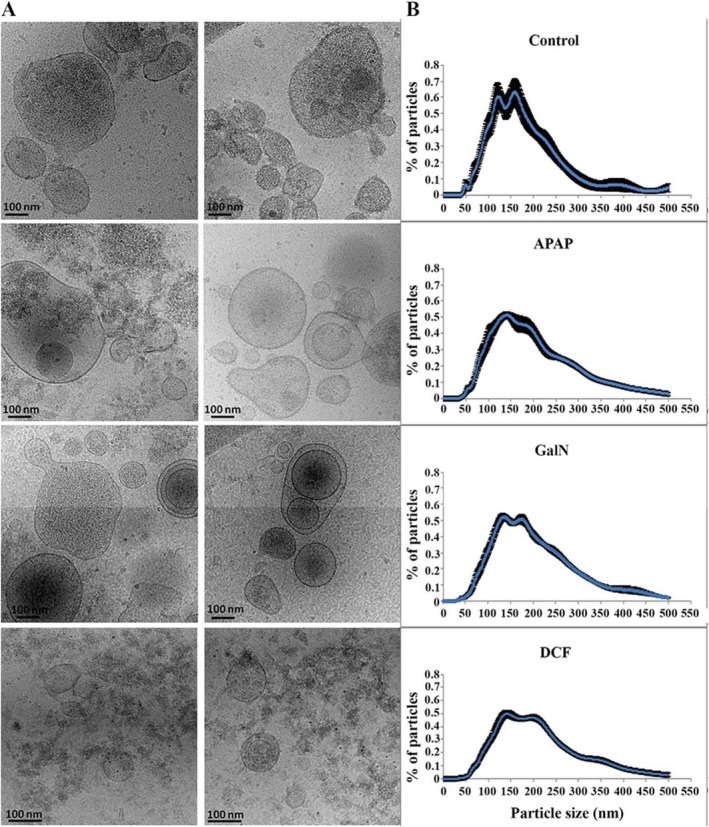
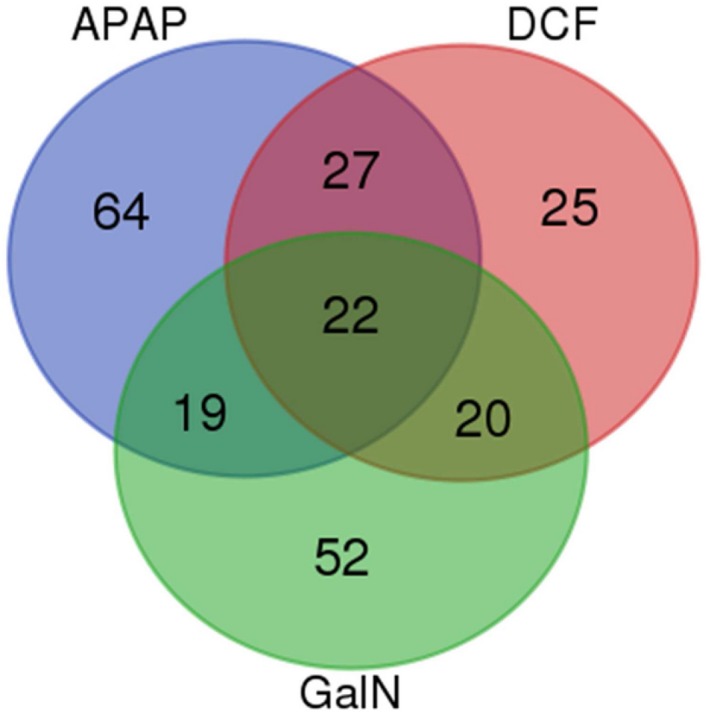
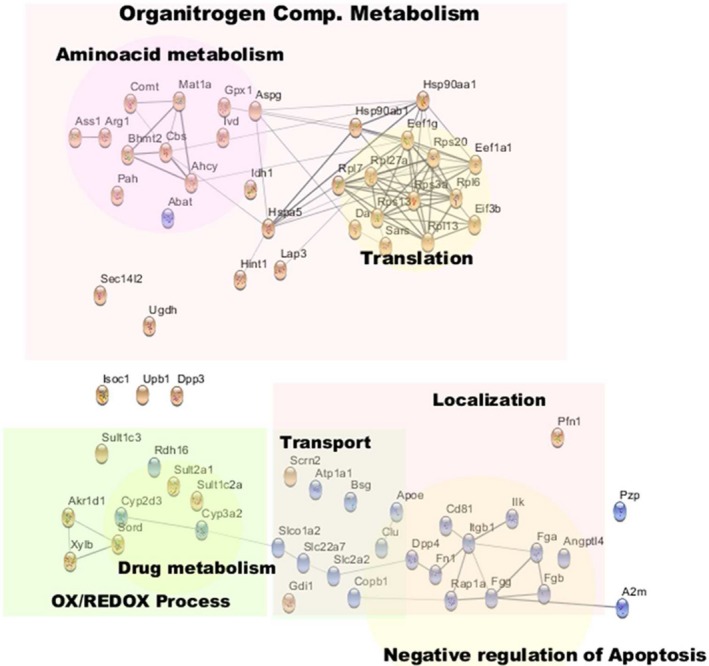
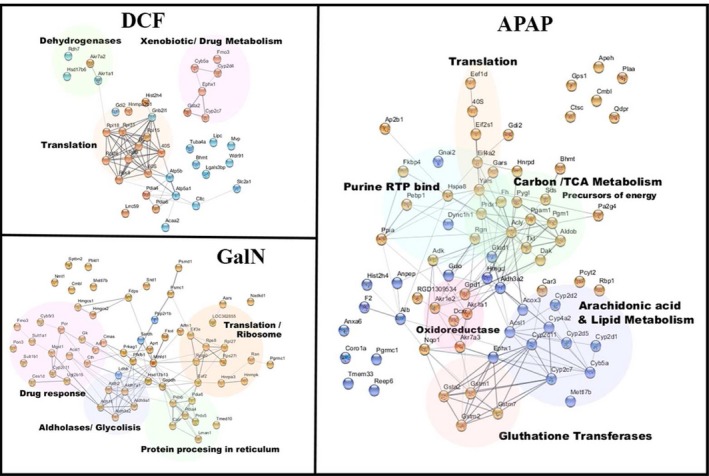
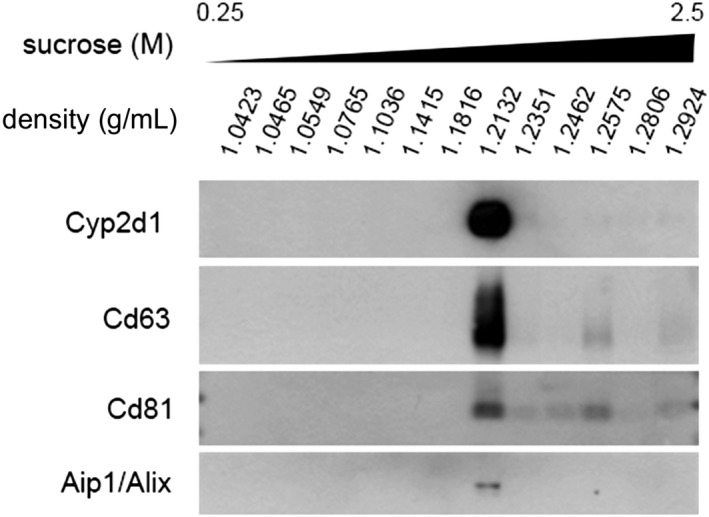
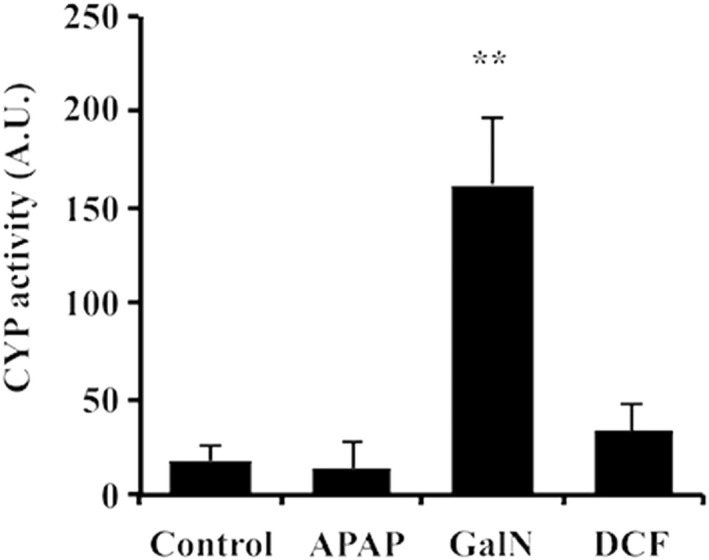
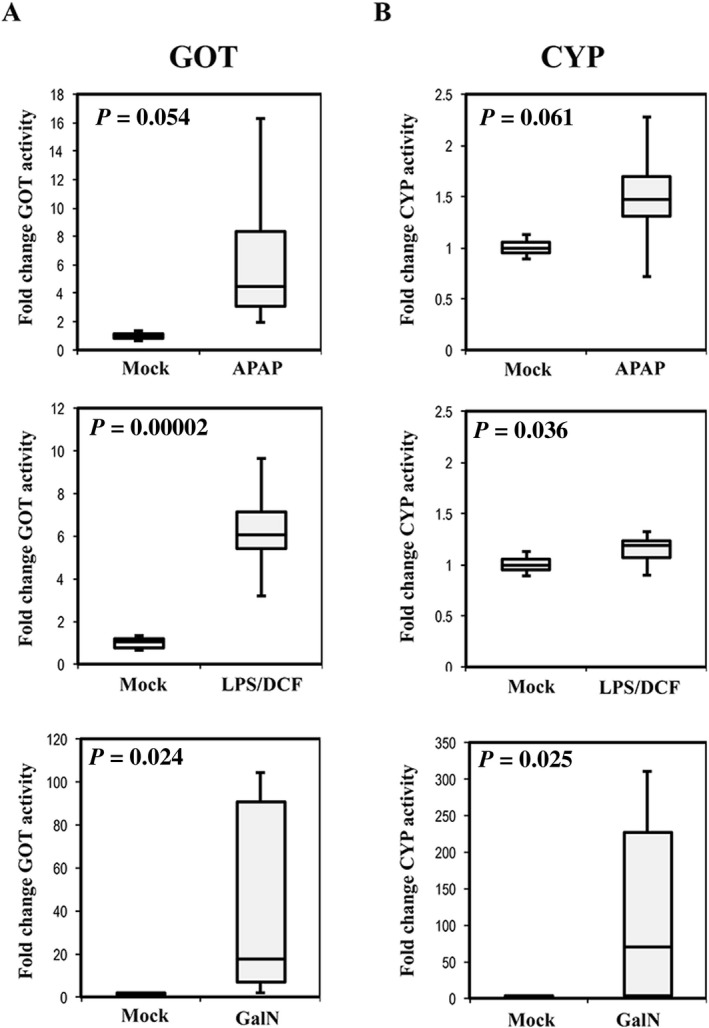
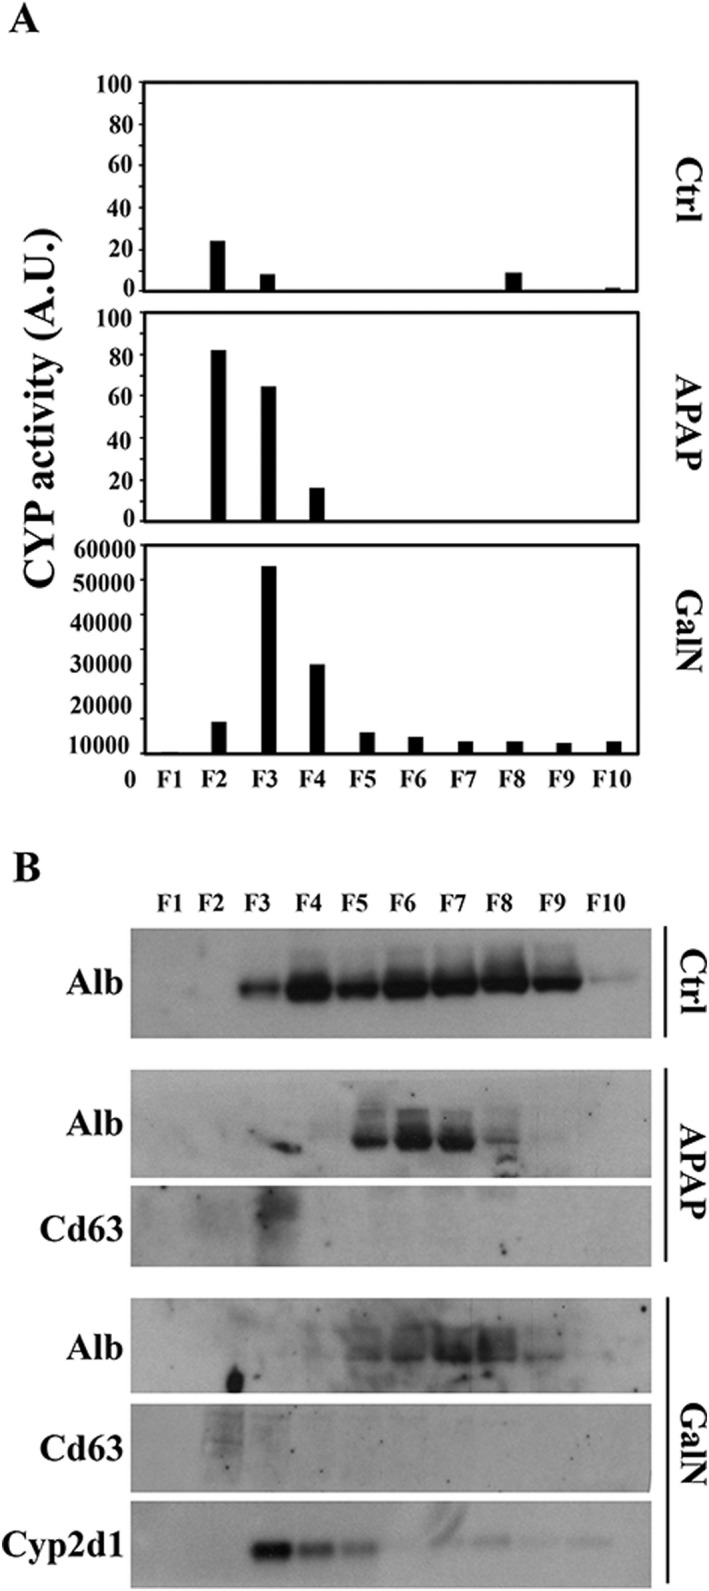
Drug-induced liver injury (DILI) is a serious worldwide health problem that accounts for more than 50% of acute liver failure. There is a great interest in clinical diagnosis and pharmaceutical industry to elucidate underlying molecular mechanisms and find noninvasive biomarkers for this pathology. Cell-secreted extracellular vesicles (EVs) have provided a new biological source to identify low disease invasive markers. Despite the intense research developed on these vesicles, there is currently a gap on their patho-physiological effects. Here, we study EVs secreted by primary rat hepatocytes challenged with galactatosamine (GalN), acetaminophen, or diclofenac as DILI in vitromodels. Proteomics analysis of these EVs revealed an increase in enzymes already associated with liver damage, such as catecholamine-methyl transferase and arginase 1. An increase in translation-related proteins and a decrease in regulators of apoptosis were also observed. In addition, we show the presence of enzymatic activity of P450 cytochrome 2d1 in EVs. The activity specifically is decreased in EVs secreted by hepatocytes after acetaminophen treatment and increased in EVs derived from GalN-treated hepatocytes. By using in vivo preclinical models, we demonstrate the presence of this cytochrome activity in circulation under normal conditions and an increased activity after GalN-induced injury. Conclusion: Hepatocyte-secreted EVs carry active xenobiotic-metabolizing enzymes that might be relevant in extracellular metabolism of drugs and be associated with DILI. (Hepatology Communications 2018;0:00-00).


Figures

Figure 1
Figure 1
Cellular viability analysis of rat hepatocytes exposed to liver‐damaging drugs. (A) Cell viability of primary rat hepatocytes was evaluated by trypan‐blue exclusion method after culture for 36 hours in the presence of APAP (10 mM), GalN (10 mM), or DCF (0.4 mM). Error bars represent standard error of 10 biological replicates (n = 10) for each condition. **P < 0.01. (B) Cell toxicity of primary rat hepatocytes was evaluated by MTT assay after culture for 36 hours in the presence of APAP (10 mM), GalN (10 mM), or DCF (0.4 mM). Error bars represent SD of two independent experiments done in triplicate for each condition.
Figure 2
Figure 2
Drug effects on hepatocytes' EV secretion. (A) Total number of secreted particles was estimated by means of NTA. (B) Total protein amount contained in EV preparation was determined by Bradford assay. Error bars represent SD of 10 biological replicates (n = 10) for each condition. **P< 0.01.
Figure 3
Figure 3
Effects on morphology and size distribution of EVs secreted by hepatocytes exposed to the drugs. Representative cryo‐electron micrographs (A) and size distribution (B) determined by NTA of EV preparations secreted by hepatocytes challenged by the indicated compounds. Bar: 100 nm. Size distribution shows the analysis of 10 biological replicates (n = 10) for each condition.
Figure 4
Figure 4
Venn diagram of EV proteomics analysis. Comparison of the proteins regulated for each treatment with respect to the proteomics analysis of EVs obtained from untreated hepatocytes.
Figure 5
Figure 5
Annotated network of common molecules regulated by hepatotoxic treatments. The network included all of those molecules found significantly regulated for all three treatments, plus those molecules found to be significantly regulated in two treatments and regulated with the same trend for the other treatment. Red and blue colors denote, respectively, an increase or decrease in the amount of each protein in EVs secreted by drug‐treated hepatocytes, in comparison to untreated cells. Abbreviations: Ahcy, S‐adenosylhomocysteine hydrolase; Angptl4, angiopoietin‐like 4; Asgp, L‐asparaginase; Ass1, argininosuccinate synthase 1; Bhmt2, betaine‐homocysteine S‐methyltransferase 2; Bsg, basigin; Cbs, cystathionine‐beta‐synthase; Copb1, beta‐subunit of coatomer; Fga, Fgb, Fgg, fibrinogens; Fn1, fibronectin; Itgb1, integrin 1b; Ilk, integrin‐linked kinase; Mat1a, S‐adenosyl‐methyl transferase; Rap1a, Ras‐related protein.
Figure 6
Figure 6
Annotated network of regulated molecules specific for each treatment. The network included for each treatment, all those molecules found to be significant only for that treatment, those molecules found to be significantly regulated in just another treatment, and the direction of regulation are not congruent among the three treatments.
Figure 7
Figure 7
Effect on protein content of EVs secreted by exposed hepatocytes. Representative western‐blot analysis of primary rat hepatocyte exposure to the drugs and their corresponding secreted EVs. Protein extracts (10 ug) were analyzed by western blotting using antibodies against the indicated proteins. Molecular weights are indicated in kDa.
Figure 8
Figure 8
Sucrose‐density analysis of EVs secreted by hepatocytes. Based on their density, EVs were separated by ultracentrifugation in a density gradient of sucrose. Afterward, the fractions were analyzed by western blotting using antibodies against the indicated proteins.
Figure 9
Figure 9
Cytochrome P450 2d1 activity associated with hepatocyte‐derived EVs exposed to the drugs. The activity of P450 2d1 was measured using a commercial fluorometric assay available for the CYP P450 2D6 (the human orthologous of the rat CYP P450 2d1). The activity expressed as an arbitrary unit was corrected by protein concentration. Error bars represent the standard error of three independent biological replicates (n = 3). **P< 0.01.
Figure 10
Figure 10
Serum levels of GOT and CYP activities in rats treated with different hepatotoxic compounds. Box plots of the transaminase GOT (A) and CYP P450 2d1 (B) activities were determined in serum of mock‐treated rats or those treated with APAP, LPS/DCF, or GalN. Activities were referred to the average activity obtained in mock group. Each experimental group was formed by eight animals (n = 8). P values of t test analysis are indicated.
Figure 11
Figure 11
SEC analysis of rat serum samples. (A) CYP P450 2d1 activity was determined in each fraction of the SEC performed with 200 µL of serum from rats treated with the indicated compounds. (B) Western blot analysis of albumin (Alb), Cd63, and Cyp2d1 proteins was performed by loading the same volume of each fraction after concentration.

References

    1. Sturgill MG, Lambert GH. Xenobiotic‐induced hepatotoxicity: mechanisms of liver injury and methods of monitoring hepatic function. Clin Chem 1997;43:1512‐1526. - PubMed
    1. Ostapowicz G, Fontana RJ, Schiodt FV, Larson A, Davern TJ, Han SH, et al. Results of a prospective study of acute liver failure at 17 tertiary care centers in the United States. Ann Intern Med 2002;137:947‐954. - PubMed
    1. Larrey D. Drug‐induced liver diseases. J Hepatol 2000;32:77‐88. - PubMed
    1. Gunawan B, Kaplowitz N. Clinical perspectives on xenobiotic‐induced hepatotoxicity. Drug Metab Rev 2004;36:301‐312. - PubMed
    1. Holt MP, Ju C. Mechanisms of drug‐induced liver injury. AAPS J 2006;8:E48‐E54. - PMC - PubMed