

Suboptimal Level of Bone-Forming Cells in Advanced Cirrhosis are Associated with Hepatic Osteodystrophy
- PMID: 30202823
- PMCID: PMC6128237
- DOI: 10.1002/hep4.1234
Suboptimal Level of Bone-Forming Cells in Advanced Cirrhosis are Associated with Hepatic Osteodystrophy
Abstract
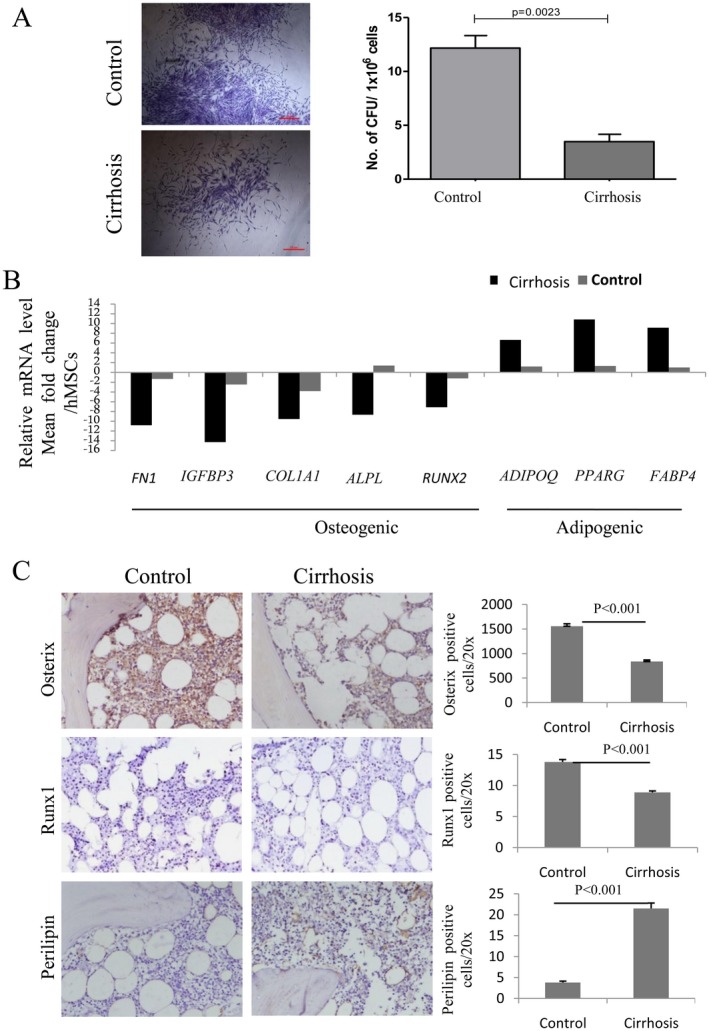
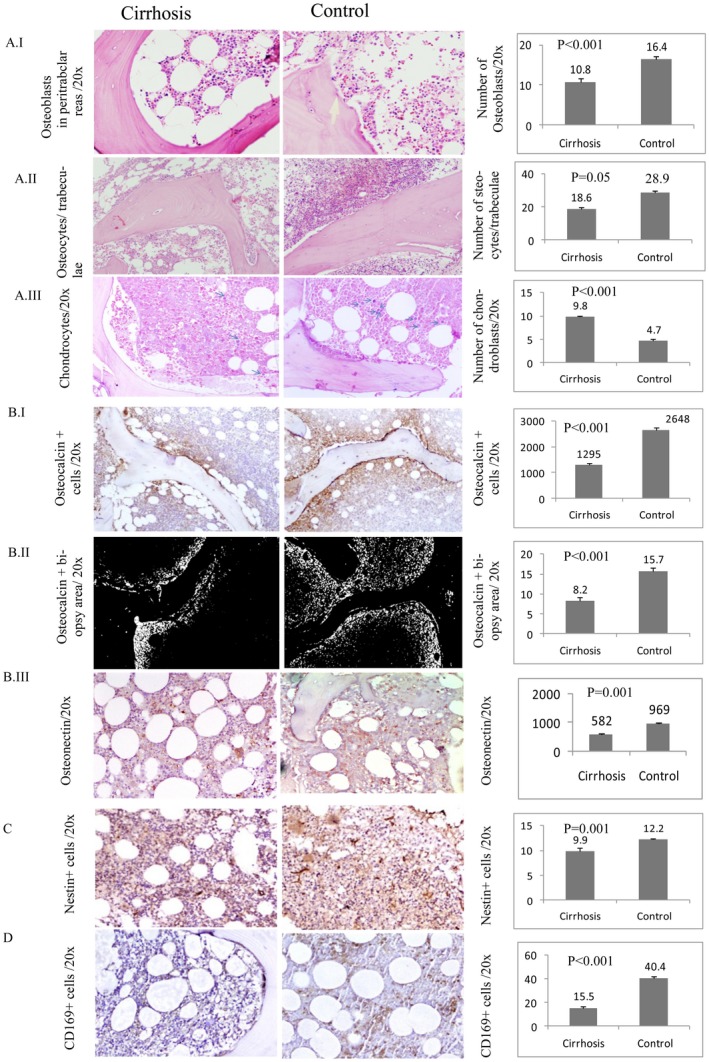
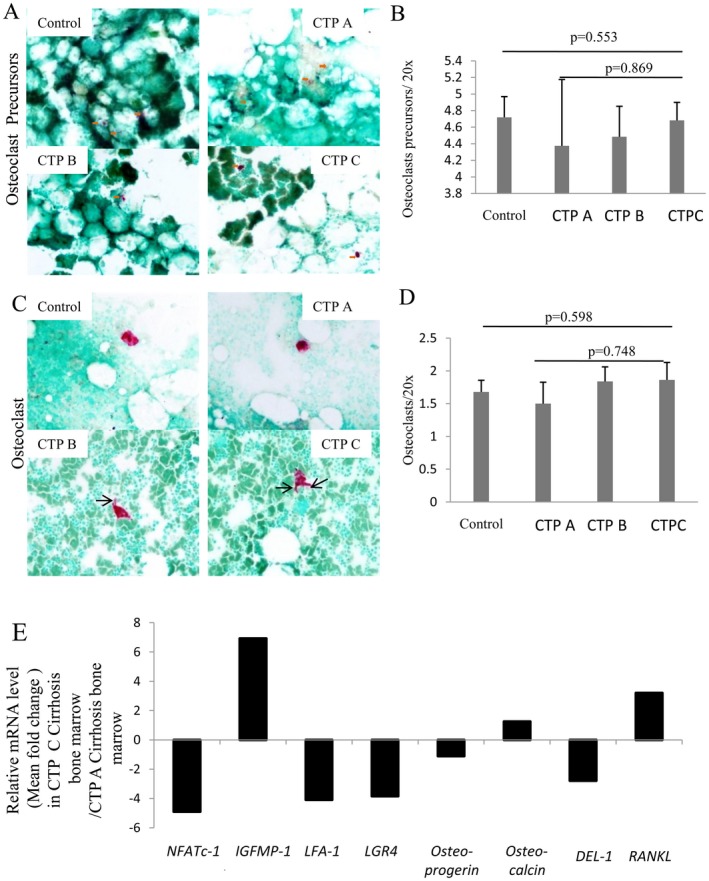
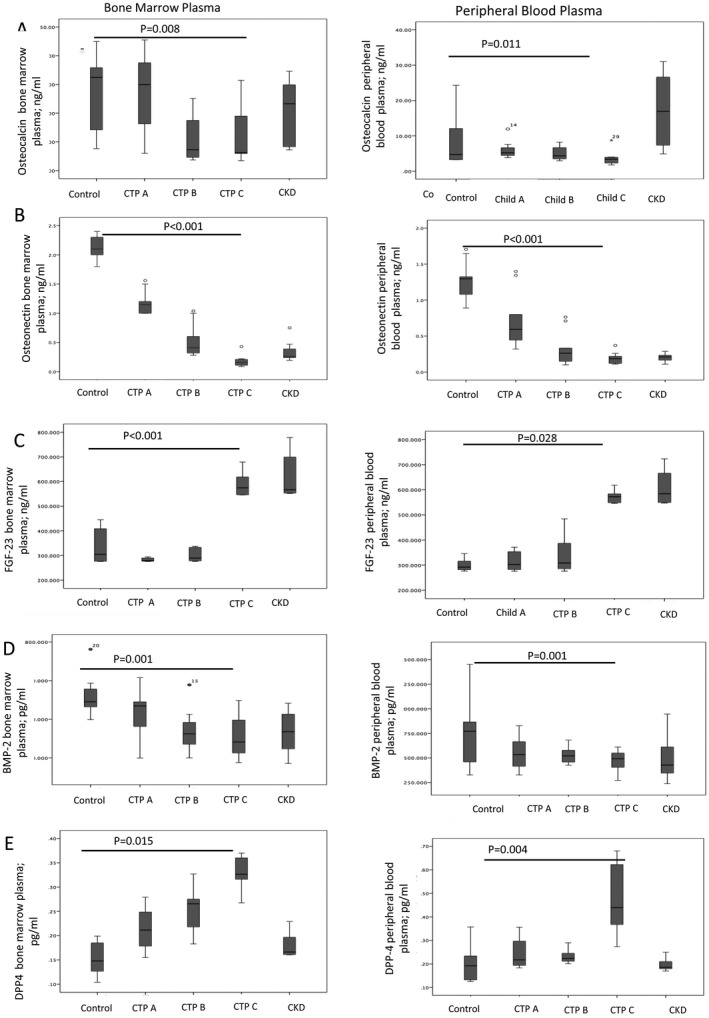
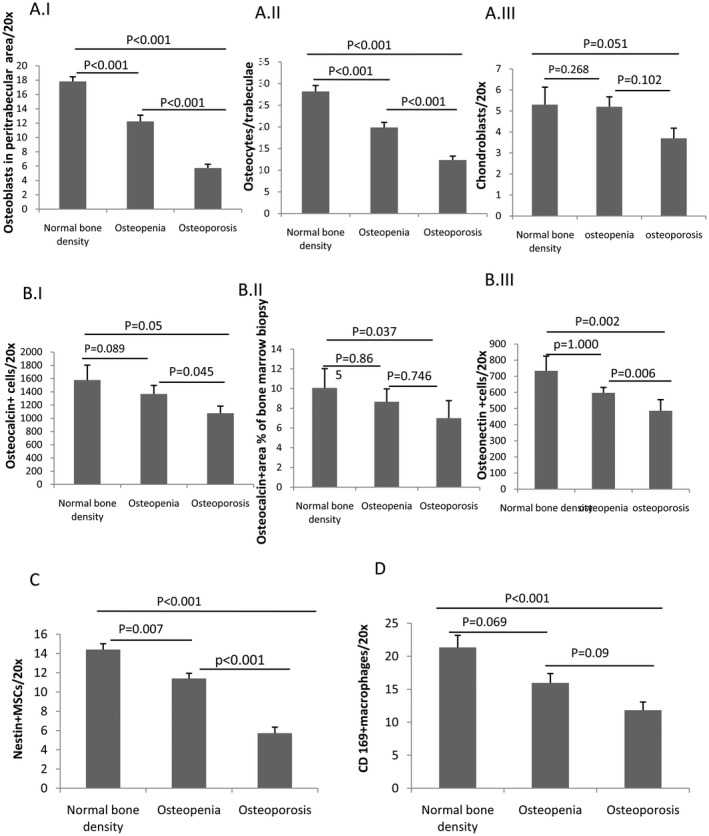
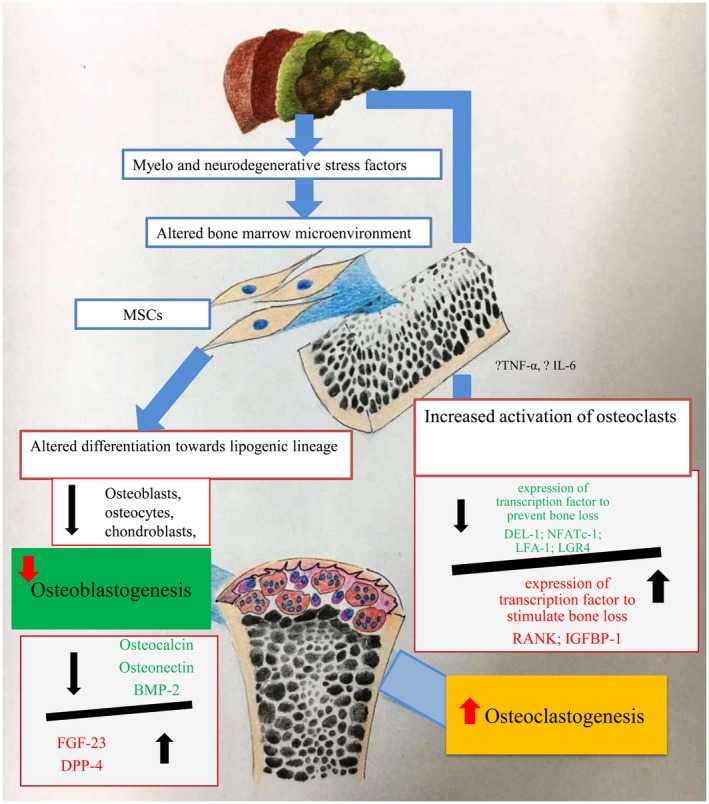
Bone loss is common in advanced cirrhosis, although the precise mechanisms underlying bone loss in cirrhosis are unknown. We studied the profile and functionality of bone-forming cells and bone-building proteins in bone marrow (BM) of individuals with cirrhosis (n = 61) and individuals without cirrhosis as normal controls (n = 50). We also performed dual energy X-ray absorptiometry for clinical correlation. BM mesenchymal cells (MSCs) were analyzed for colony-forming units-fibroblasts and their osteogenic (fibronectin-1 [FN1], insulin-like growth factor binding protein 3 [IGFBP3], collagen type 1 alpha 1 chain [COL1A1], runt-related transcription factor 2 [RUNX2], and alkaline phosphatase, liver [ALPL]) and adipogenic ( adiponectin, C1Q, and collagen domain containing [ADIPOQ], peroxisome proliferator-activated receptor gamma [PPARγ], and fatty acid binding protein 4 [FABP4]) potentials. Colony-forming units-fibroblasts were lower in patients with cirrhosis (P = 0.002) than in controls. Cirrhotic BM-MSCs showed >2-fold decrease in osteogenic markers. Compared to controls, patients with cirrhosis showed fewer osteocytes (P = 0.05), osteoblasts, chondroblasts, osteocalcin-positive (osteocalcin+) area, clusters of differentiation (CD)169+ macrophages (P < 0.001, each), and nestin+ MSCs (P = 0.001); this was more apparent in Child-Turcotte-Pugh (CTP) class C than A (P < 0.001). Multivariate logistic regression showed low nestin+ MSCs (P = 0.004) as a predictor of bone loss. Bone-resolving osteoclasts were comparable among CTP groups, but >2-fold decreased anti-osteoclastic and increased pro-osteoclastic factors were noted in patients with CTP C compared to CTP A. Bone-building proteins (osteocalcin [P = 0.008], osteonectin [P < 0.001], and bone morphogenic protein 2 [P = 0.001]) were decreased while anti-bone repair factors (fibroblast growth factor 23 [P = 0.015] and dipeptidyl peptidase 4 [P < 0.001]) were increased in BM and peripheral blood; this was more apparent in advanced cirrhosis. The dual energy X-ray absorptiometry scan T score significantly correlated with the population of osteoblasts, osteocytes, MSCs, and CD169+ macrophages. Conclusion: Osteoprogenitor cells are substantially reduced in patients with cirrhosis and more so in advanced disease. Additionally, increased anti-bone repair proteins enhance the ineffective bone repair and development of osteoporosis in cirrhosis. Hepatology Communications 2018;0:0-0).
Figures
Similar articles
-
Autophagy receptor OPTN (optineurin) regulates mesenchymal stem cell fate and bone-fat balance during aging by clearing FABP3.Autophagy. 2021 Oct;17(10):2766-2782. doi: 10.1080/15548627.2020.1839286. Epub 2020 Nov 4. Autophagy. 2021. PMID: 33143524 Free PMC article.
-
Defects in energy metabolism are associated with functional exhaustion of bone marrow mesenchymal stem cells in cirrhosis.Am J Stem Cells. 2022 Feb 15;11(1):12-27. eCollection 2022. Am J Stem Cells. 2022. PMID: 35295591 Free PMC article.
-
Regulation of human bone marrow-derived osteoprogenitor cells by osteogenic growth factors.J Clin Invest. 1995 Feb;95(2):881-7. doi: 10.1172/JCI117738. J Clin Invest. 1995. PMID: 7860771 Free PMC article.
-
Effect of Nano-HA/Collagen Composite Hydrogels on Osteogenic Behavior of Mesenchymal Stromal Cells.Stem Cell Rev Rep. 2016 Jun;12(3):352-64. doi: 10.1007/s12015-016-9644-x. Stem Cell Rev Rep. 2016. PMID: 26803618 Free PMC article.
-
At the Crossroads of the Adipocyte and Osteoclast Differentiation Programs: Future Therapeutic Perspectives.Int J Mol Sci. 2020 Mar 26;21(7):2277. doi: 10.3390/ijms21072277. Int J Mol Sci. 2020. PMID: 32224846 Free PMC article. Review.
Cited by
-
Serum levels of sclerostin reflect altered bone microarchitecture in patients with hepatic cirrhosis.Wien Klin Wochenschr. 2020 Jan;132(1-2):19-26. doi: 10.1007/s00508-019-01595-8. Epub 2020 Jan 7. Wien Klin Wochenschr. 2020. PMID: 31912287 Free PMC article.
-
CEACAM-1 Induced CSF3-receptor Downregulation in Bone Marrow Associated With Refractory Neutropenia in Advanced Cirrhosis.J Clin Transl Hepatol. 2022 Feb 28;10(1):53-62. doi: 10.14218/JCTH.2021.00331. Epub 2022 Jan 4. J Clin Transl Hepatol. 2022. PMID: 35233373 Free PMC article.
-
Association of Bone Metabolism with Fatty Liver Disease in the Elderly in Japan: A Community-based Study.Intern Med. 2020 May 15;59(10):1247-1256. doi: 10.2169/internalmedicine.3906-19. Epub 2020 Feb 26. Intern Med. 2020. PMID: 32101831 Free PMC article.
-
Seropositive for hepatitis B and C viruses is associated with the risk of decreased bone mineral density in adults: An analysis of studies from the NHANES database.Front Med (Lausanne). 2023 Mar 22;10:1120083. doi: 10.3389/fmed.2023.1120083. eCollection 2023. Front Med (Lausanne). 2023. PMID: 37035336 Free PMC article.
-
Bile Acid Network and Vascular Calcification-Associated Diseases: Unraveling the Intricate Connections and Therapeutic Potential.Clin Interv Aging. 2023 Oct 21;18:1749-1767. doi: 10.2147/CIA.S431220. eCollection 2023. Clin Interv Aging. 2023. PMID: 37885621 Free PMC article. Review.
References
-
- Leslie WD, Bernstein CN. Leboff MS; American Gastroenterological Association Clinical Practice Commitee. AGA technical review on osteoporosis in hepatic disorders. Gastroenterology 2003;125:941‐966. - PubMed
-
- Nakchbandi IA, van der Merwe SW. Current understanding of osteoporosis associated with liver disease. Nat Rev Gastroenterol Hepatol 2009;6:660‐670. - PubMed
-
- Blachier M, Leleu H, Peck‐Radosavljevic M, Valla DC, Roudot‐Thoraval F. The burden of liver disease in Europe: a review of available epidemiological data. J Hepatol 2013;58:593‐608. - PubMed
LinkOut - more resources
Full Text Sources
Other Literature Sources
Research Materials
Miscellaneous
