. 2019 Jan 1;167(1):172-189.
doi: 10.1093/toxsci/kfy231.

Chemical Activation of the Constitutive Androstane Receptor Leads to Activation of Oxidant-Induced Nrf2

Affiliations

Chemical Activation of the Constitutive Androstane Receptor Leads to Activation of Oxidant-Induced Nrf2

John P Rooney et al. Toxicol Sci. .

Abstract

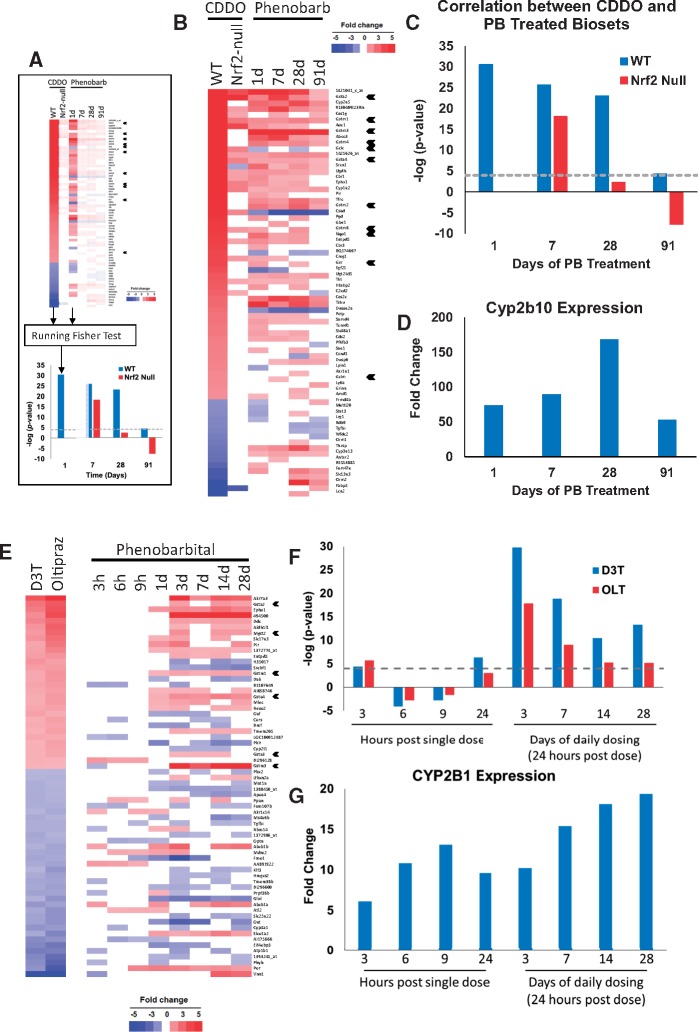
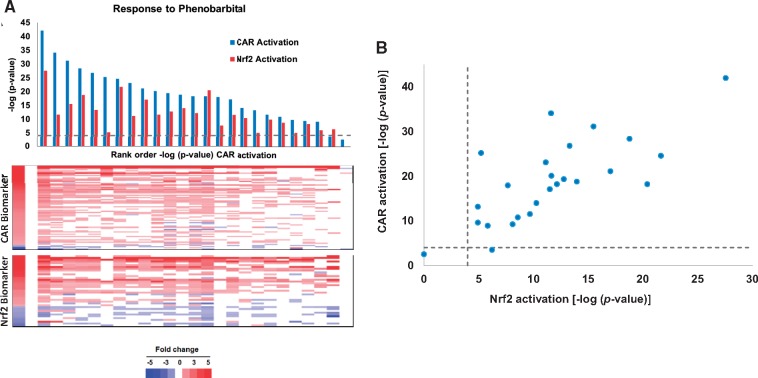
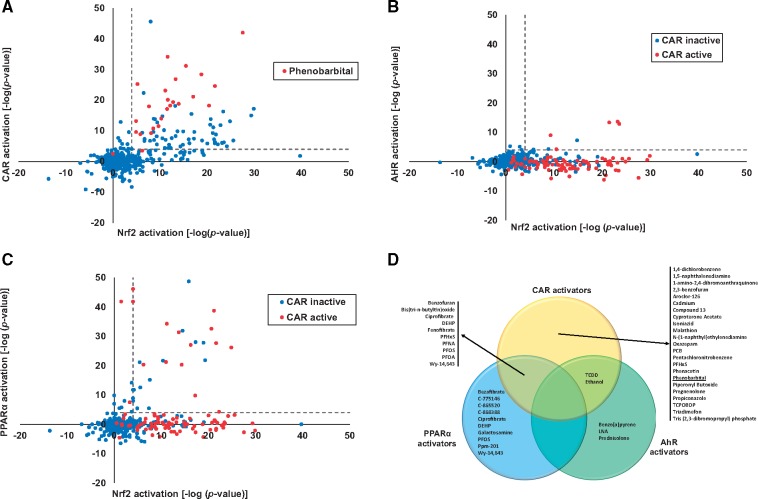
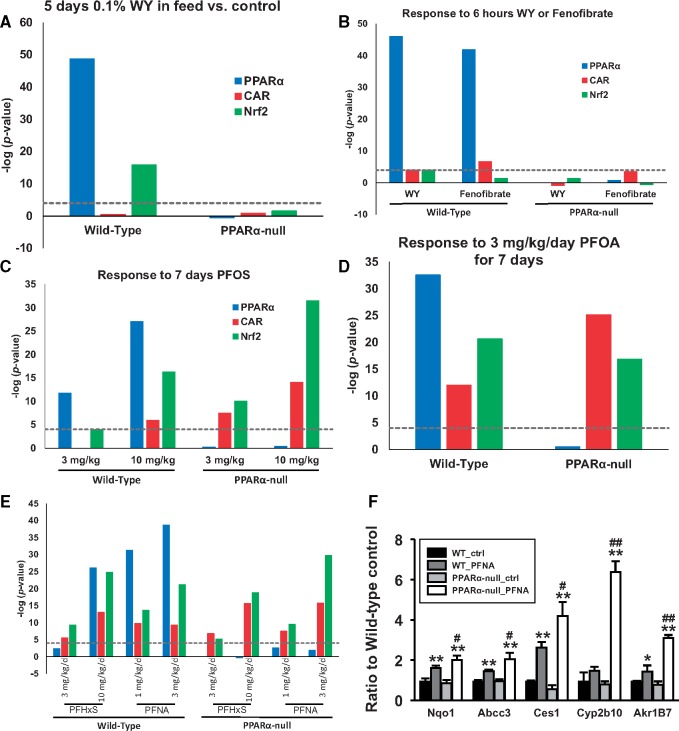
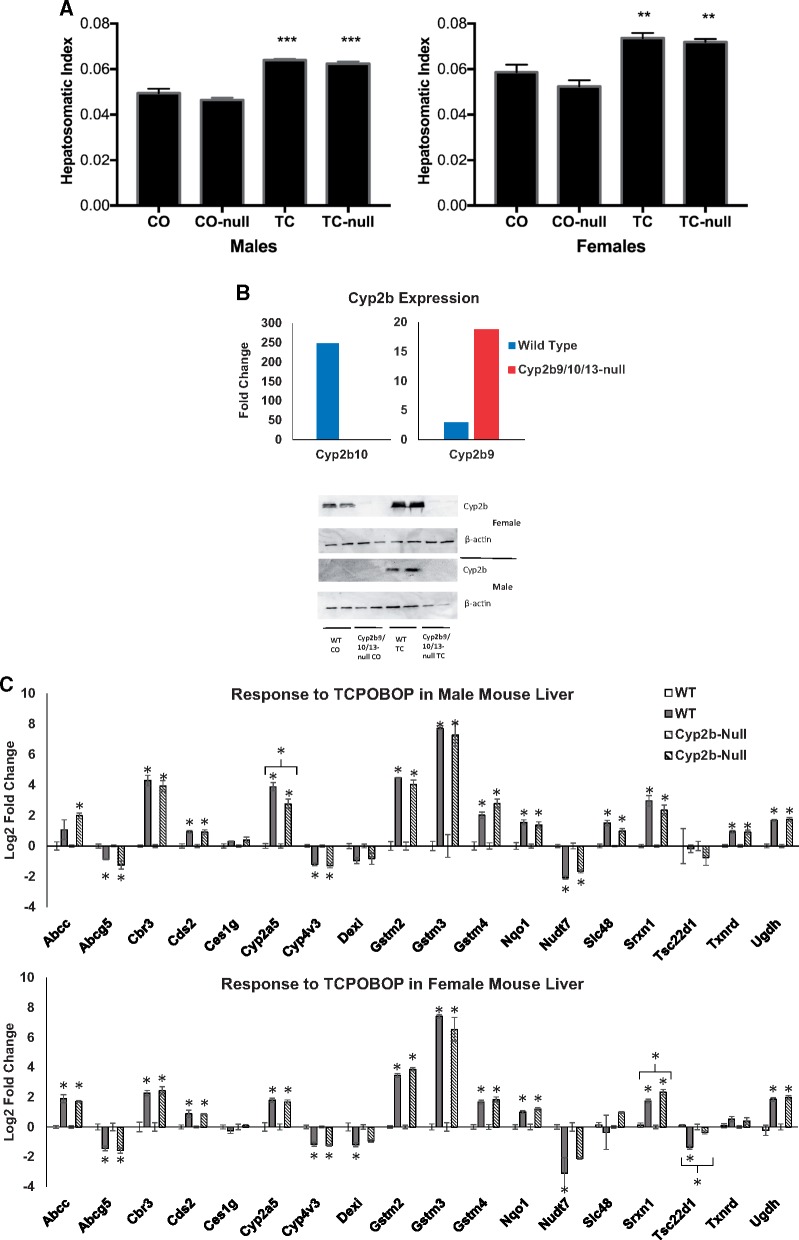
Exposure to environmentally relevant chemicals that activate the xenobiotic receptors aryl hydrocarbon receptor (AhR), constitutive androstane receptor (CAR), and peroxisome proliferator-activated receptor alpha (PPARα) in rodent test systems often leads to increases in oxidative stress (OS) that contributes to liver cancer induction. We hypothesized that activation of the oxidant-induced transcription factor Nrf2 could be used as a surrogate endpoint for increases in OS. We examined the relationships between activation of xenobiotic receptors and Nrf2 using previously characterized gene expression biomarkers that accurately predict modulation. Using a correlation approach (Running Fisher Test), the biomarkers were compared with microarray profiles in a mouse liver gene expression compendium. Out of the 163 chemicals examined, 47% from 53 studies activated Nrf2. We found consistent coupling between CAR and Nrf2 activation. Out of the 41 chemicals from 32 studies that activated CAR, 90% also activated Nrf2. CAR was activated earlier and at lower doses than Nrf2, indicating CAR activation preceded Nrf2 activation. Nrf2 activation by 2 CAR activators was abolished in CAR-null mice. We hypothesized that Nrf2 is activated by reactive oxygen species from the increased activity of enzymes encoded by Cyp2b family members. However, Nrf2 was similarly activated in the livers of both TCPOBOP-treated wild-type and Cyp2b9/10/13-null mice. This study provides evidence that Nrf2 activation (1) often occurs after exposure to xenobiotic chemicals, (2) is tightly linked to activation of CAR, and (3) does not require induction of 3 Cyp2b genes secondary to CAR activation.


Figures

Figure 1.
Figure 1.
Exposure to PB alters expression of Nrf2-regulated genes. A, Using the Running Fisher test to determine correlation between 2 gene lists (biosets). The p-value of the correlation test is converted to a −log(p-value) and to a negative number if there is negative correlation. B, Expression of genes after exposure to CDDO-Im or PB. Biosets were from a PB study (0.05% (w/v) in drinking water for 1, 7, 28, or 91 days; from GSE45465) and from WT or Nrf2-null mice treated with CDDO-Im (30 µM) for 6 h (Yates et al., 2009). Genes regulated by CDDO-Im in WT mice and by 1 or more of the PB biosets are shown. Nqo1, glutathione synthesis genes, and Gst family member genes are indicated with arrowheads. C, Significance of the correlation between biosets from the studies described in (B). D, Changes in the expression of the CAR marker gene Cyp2b10 derived from the PB microarray study. The gene expression changes shown were significantly different from the corresponding controls (p < .05). E, Expression of genes after exposure to D3T, oltipraz or PB. Rats were given 100 mg/kg PB by gavage and sacrificed at the indicated times (from the TG-GATES study) or treated with D3T (600 mg/kg) or oltipraz (500 mg/kg) for 24 days (Phan et al., 2009). The genes examined were selected as they exhibited consistent expression by D3T and oltipraz and were altered in expression in at least 3 or more of the 8 PB treatments. GST family member genes are indicated with arrowheads. F, Significance of the correlation between biosets derived from the PB time course study and the Nrf2 activators described in (E). G, Changes in the expression of the CAR marker gene CYP2B1 derived from the microarray study. The gene expression changes shown were significantly different from the corresponding controls (p < .05).
Figure 2.
Figure 2.
Coordinate activation of CAR and Nrf2 by PB across studies. A, (Top) Significance of the correlation between biomarkers for CAR or Nrf2 and 25 biosets from the livers of WT mice treated with PB from 12 studies (GSE16777; GSE34423; GSE40120; GSE40773; GSE43977; GSE44783; GSE45465; GSE51355; GSE55084; GSE57055; GSE60684; GSE6721). Biosets were rank ordered by the significance of the similarity of the biosets to the CAR biomarker. (Bottom) Expression of the genes in the biomarkers across the studies. B, Relationships between the −log(p-value)s of the correlations described in (A).
Figure 3.
Figure 3.
Nrf2 activation by chemical activators of xenobiotic receptors. A, Activation of Nrf2 by chemical activators of CAR in the mouse liver compendium. A total of 471 biosets from chemically treated WT mice representing 167 chemicals were examined for activation of CAR or Nrf2 based on biomarker correlation. The biosets from PB studies are indicated in red. B, Activation of AhR and Nrf2. Biosets described in (A) were examined for activation of AhR and Nrf2 using the respective biomarkers. The conditions in red (5 with significant AhR activation) are those with significant activation of CAR as assessed by the CAR biomarker. C, Activation of PPARα and Nrf2. Biosets described in (A) were examined for activation of PPARα and Nrf2 using the respective biomarkers. The exposure conditions in red (13 with significant PPARα activation) are those with significant activation of CAR as assessed by the CAR biomarker. D, Summary of chemicals that activate Nrf2 and 1 or more xenobiotic receptors. Chemicals which result in activation of Nrf2 and activate one or more of the indicated receptors were grouped in the Venn diagram. Details of each experiment are found in Supplementary Material 1.
Figure 4.
Figure 4.
Dose-dependent activation of Nrf2 by PB. A, (Top) Significance of the correlation between CAR or Nrf2 biomarkers and the biosets derived from the livers of male and female mice treated for 2 or 7 days with PB (Geter et al., 2014). (Bottom) Expression of the genes in the biomarkers across the treatments. Positions of Cyp genes are indicated. B, Transcriptional AC50 levels (mg/kg-day) for genes in the CAR or Nrf2 biomarkers. The 4 sex-time groups are indicated. Cyp2b10 AC50 levels are shown indicated as red circles.
Figure 5.
Figure 5.
Divergent nuclear receptor dependence of Nrf2 activation by fibrates and perfluorinated compounds. Activation of PPARα, CAR, and Nrf2 biomarkers were examined in the livers of WT and PPARα-null mice after treatment with fibrates and perfluorinated compounds. A, Mice were treated with WY for 5 days at 0.1% w/w in the feed (from GSE8295). B, Mice were treated with WY or fenofibrate for 6 h with 400 μl of 10 mg/ml in 0.5% carboxymethyl cellulose (from GSE8396). C, Mice were treated with PFOS at 3 and 10 mg/kg for 7 days (from GSE22871). D, Mice were treated with PFOA at 3 mg/kg for 7 days (from GSE9786). E, Mice were treated with PFHxS at 3 and 10 mg/kg or PFNA at 1 and 3 mg/kg for 7 days (from GSE55756). F, Expression of Nrf2 and CAR biomarker genes by qPCR in the livers of WT and PPARα-null mice treated with 10 mg/kg/day for 7 days with PFNA (Rosen et al., 2017; GSE55756). Values for Cyp2b10 and Akr1b7 came from Oshida et al. (2015b) and are shown for comparison. Significantly different between control and chemical treatment within strains: *p ≤ .05, **p ≤ .01. Significantly different between PFNA-treated in WT and PFNA-treated in nullizygous mice: #p ≤ .05, ##p ≤ .01.
Figure 6.
Figure 6.
Activation of Nrf2 by PB and TCPOBOP is CAR-dependent. A, Assessment of CAR and Nrf2 activation in the livers of WT, CAR/PXR-null and humanized CAR/PXR (hCAR/hPXR) mice treated for up to 91 days with 0.05% PB (wt/vol) in drinking water (Luisier et al., 2014). Reversibility of responses was examined in mice treated for 91 days followed by a 28 days recovery time (119 days time point). B, Assessment of CAR and Nrf2 activation in the livers of WT, CAR-null and hCAR mice exposed to PB, TCPOBOP or CITCO for 3 days (data from GSE40120). C, Gene expression was examined in the livers from WT or CAR-null mice by qPCR after exposure to PB (0.085% w/w diet for 28 days; Ross et al., 2009). Expression analysis of Cyp2b10 and Akr1b7 has been previously published (Oshida et al., 2015b) and are shown for comparison. Significantly different between control and chemical treatment within strains: *p ≤ .05, **p ≤ .01. Significantly different between PB-treated in WT and PB-treated in nullizygous mice: #p ≤ .05, ##p ≤ .01.
Figure 7.
Figure 7.
Relationship between expression of Cyp genes and activation of Nrf2 by CAR activators. A, Heat map showing the expression of Cyp family members after exposure to PB from the 25 biosets in the same order as Figure 2. The graph shows the average expression of each Cyp across the 25 biosets. (Inset) Relationship between average expression of the top 5 ranking Cyp genes and Nrf2 activation for the 25 biosets from PB-treated mice. B, Relationship between average expression of the top 5 ranking Cyp genes and Nrf2 activation in the livers of mice treated with 135 chemicals from 318 biosets.
Figure 8.
Figure 8.
Activation of Nrf2 by TCPOBOP in WT and Cyp2b9/10/13-null mice. Male and female mice were treated with 1 dose of TCPOBOP (3 mg/kg) for 48 h. A, Liver to body weight changes (hepatosomatic index). **p < .01. ***p < .0001. Significantly different between controls and TCPOBOP-treated mice. B, (Top) Cyp2b gene expression changes after exposure to TCPOBOP. Fold-change values are relative to control treated mice. The gene expression changes shown were significantly different from corresponding controls (p < .05). (Bottom) Cyp2b protein expression after exposure to TCPOBOP as determined by Western blot. C, qPCR analysis of Nrf2 biomarker genes. Significantly different from corresponding control: *p < .05, **p < .01.
Figure 9.
Figure 9.
Model for Nrf2 induction by CAR activators and relationship to the MOA for liver cancer. See text for explanation.

Similar articles

Cited by

References

    1. Ahmed S. S., Napoli K. L., Strobel H. W. (1995). Oxygen radical formation during cytochrome P450-catalyzed cyclosporine metabolism in rat and human liver microsomes at varying hydrogen ion concentrations. Mol. Cell Biochem. 151, 131–140. - PubMed
    1. Aleksunes L. M., Klaassen C. D. (2012). Coordinated regulation of hepatic phase I and II drug-metabolizing genes and transporters using AhR-, CAR-, PXR-, PPARα-, and Nrf2-null mice. Drug Metab. Dispos. 40, 1366–1379. - PMC - PubMed
    1. Ashino T., Ohkubo-Morita H., Yamamoto M., Yoshida T., Numazawa S. (2014). Possible involvement of nuclear factor erythroid 2-related factor 2 in the gene expression of Cyp2b10 and Cyp2a5. Redox. Biol. 2, 284–288. - PMC - PubMed
    1. Becuwe P., Dauça M. (2005). Comparison of cytotoxicity induced by hypolipidemic drugs via reactive oxygen species in human and rodent liver cells. Int. J. Mol. Med. 16, 483–492. - PubMed
    1. Bondy S. C., Naderi S. (1994). Contribution of hepatic cytochrome P450 systems to the generation of reactive oxygen species. Biochem. Pharmacol. 48, 155–159. - PubMed

Publication types

MeSH terms