. 2018 Nov 1;42(6):829-856.
doi: 10.1093/femsre/fuy034.

Role of plasmid plasticity and mobile genetic elements in the entomopathogen Bacillus thuringiensis serovar israelensis

Affiliations

Role of plasmid plasticity and mobile genetic elements in the entomopathogen Bacillus thuringiensis serovar israelensis

Annika Gillis et al. FEMS Microbiol Rev. .

Abstract

Bacillus thuringiensis is a well-known biopesticide that has been used for more than 80 years. This spore-forming bacterium belongs to the group of Bacillus cereus that also includes, among others, emetic and diarrheic pathotypes of B. cereus, the animal pathogen Bacillus anthracis and the psychrotolerant Bacillus weihenstephanensis. Bacillus thuringiensis is rather unique since it has adapted its lifestyle as an efficient pathogen of specific insect larvae. One of the peculiarities of B. thuringiensis strains is the extent of their extrachromosomal pool, with strains harbouring more than 10 distinct plasmid molecules. Among the numerous serovars of B. thuringiensis, 'israelensis' is certainly emblematic since its host spectrum is apparently restricted to dipteran insects like mosquitoes and black flies, vectors of human and animal diseases such as malaria, yellow fever, or river blindness. In this review, the putative role of the mobile gene pool of B. thuringiensis serovar israelensis in its pathogenicity and dedicated lifestyle is reviewed, with specific emphasis on the nature, diversity, and potential mobility of its constituents. Variations among the few related strains of B. thuringiensis serovar israelensis will also be reported and discussed in the scope of this specialised insect pathogen, whose lifestyle in the environment remains largely unknown.


Figures

Figure 1.
Figure 1.
(A) Circular and unrooted tree representing the phylogeny of genomic sequences of the B. thuringiensis strains. The strain names correspond to their labelling in NCBI genomic database. The colours are arbitrary assigned to clearly distinct formal clusters. Pale orange colour corresponds to the cluster closely related to three B. thuringiensis sv. israelensis reference strains, AM65–52, 4Q7 and HD-789. (B) Unrooted tree is drawn for better presentation of differences between clades. See the text for more detailed comments.
Figure 2.
Figure 2.
Circular maps of the three small plasmids pTX14–1, pTX14–2 and pTX14–3 from B. thuringiensis sv. israelensis. The block arrows in the outer circles indicate the predicted CDSs in their direction of transcription. The black circle represents the GC content plotted using a sliding window, as the deviation from the average GC content of the entire sequence. The green/magenta circles represent the GC-skew calculated using a sliding window, as (G-C)/(G+C), and plotted as the deviation from the average GC skew of the entire sequence. Double-strand origins (dso) and single-strand origins (sso) are presented as rose block arrows; origins of transfer (oriT) are indicated by the orange bar. CDSs encoding for putative ‘Bacillus-collagen-like’, Rep and Mob proteins are highlighted by blue, grey and purple block arrows, respectively. CDSs encoding for hypothetical proteins are indicated in light green. Other relevant loci are indicated. Maps were generated by CGView (Grant and Stothard 2008) using the sequences of B. thuringiensis subsp. israelensis plasmids pTX14–1 (Acc. #: NC_002091), pTX14–2 (Acc. #: NC_004334) and pTX14–3 (Acc. #: NC_001446).
Figure 3.
Figure 3.
Functional map of B. thuringiensis sv. israelensis linear plasmidial prophage pGIL01. Predicted CDSs and their direction of transcription are represented as block arrows and are divided into two lines for figure display. The graphs below the block arrows represent the %GC content plotted using a sliding window, as the deviation from the average GC content (red) of the entire sequence [GC(blue)/AT(green)]. CDS numbers are indicated above the block arrows. CDSs previously shown or suggested function (Fornelos et al.; Jalasvuori et al.; Gillis and Mahillon ; Berjón-Otero et al.2017) are colour-coded: rose, regulatory element; grey, unknown function; blue, replication; purple, DNA packaging and assembly; orange, capsid structural component; yellow, membrane structural component; green, lysis. Inverted terminal repeats (ITR) are highlighted by the red block arrows at both ends of the genome. Promoters P1, P2 and P3 are indicated by angled arrows, whereas putative Pho-independent transcription terminators are depicted as open stem loops downstream CDSs 8 and 30. Three gene modules based on functional grouping are indicated. The rulers represent base pairs. Map was generated using Geneious 11.1.2 (http://www.geneious.com; Kearse et al.2012) and the sequence of Bacillus phage pGIL01 (Acc. #: AJ536073) (Verheust et al.2003).
Figure 4.
Figure 4.
Circular map of B. thuringiensis sv. israelensis plasmid pBtoxis. The block arrows in the outer circles indicate the predicted CDSs in their direction of transcription, with or without functional annotation or relevant homologues. The black circle represents the GC content plotted using a sliding window, as the deviation from the average GC content of the entire sequence. The green/magenta circles represent the GC-skew calculated using a sliding window, as (G-C)/(G+C), and plotted as the deviation from the average GC skew of the entire sequence. CDSs encoding for mosquitocidal toxins (Cry and Cyt) and other accessory proteins (P19 and P20) with relevant roles in promoting pesticidal crystal formation are indicated by green block arrows. MGE including IS and transposons are highlighted by rose block arrows. CDSs potentially involved in peptide antibiotic production and export are indicated in blue. Remaining predicted CDSs are indicated in purple. Map was generated by CGView (Grant and Stothard 2008) using the sequence of B. thuringiensis subsp. israelensis plasmid pBtoxis (Acc. #: AL731825) (Berry et al.2002).
Figure 5.
Figure 5.
Circular map of B. thuringiensis sv. israelensis plasmid pBtic100. The block arrows in the outer circles indicate the predicted CDSs in their direction of transcription. The black circle represents the GC content plotted using a sliding window, as the deviation from the average GC content of the entire sequence. The green/magenta circles represent the GC-skew calculated using a sliding window, as (G-C)/(G+C), and plotted as the deviation from the average GC skew of the entire sequence. CDSs with functional annotation are indicated in purple block arrows. CDSs in grey represent genes coding for hypothetical proteins. CDSs encoding for pesticidal toxins are indicated by green block arrows. Transposases, recombinases and integrases are highlighted by rose block arrows. Map was generated by CGView (Grant and Stothard 2008) using the sequence of B. thuringiensis subsp. israelensis AM65–52 plasmid pAM65–52-5–100K (Acc. #: CP013280) (Bolotin et al.2017).
Figure 6.
Figure 6.
Circular map B. thuringiensis sv. israelensis plasmid pBtic235. The block arrows in the outer circles indicate the predicted CDSs in their direction of transcription, with or without functional annotation or relevant homologues. The black circle represents the GC content plotted using a sliding window, as the deviation from the average GC content of the entire sequence. The green/magenta circles represent the GC-skew calculated using a sliding window, as (G-C)/(G+C), and plotted as the deviation from the average GC skew of the entire sequence. The orange and blue semi-circles indicate the phage- and plasmid-like modules, respectively. CDSs in light blue represent genes coding for proteins found in phages. Enzymes commonly associated with excision of MGE are highlighted by rose block arrows. tRNAs are presented as red block arrows. Remaining predicted CDSs are indicated in purple. Map was generated by CGView (Grant and Stothard 2008) using the sequence of B. thuringiensis subsp. israelensis plasmid pBTHD789–2 (Acc. #: NC_018509) (Doggett et al.2013) and the functional annotation described by Gillis et al. (2017b).
Figure 7.
Figure 7.
Circular map of pXO16, the conjugative plasmid of B. thuringiensis sv. israelensis. The purple block arrows in the outer circle indicate the predicted CDSs in their direction of transcription, with or without functional annotation or relevant homologues. The black circle represents the GC content plotted using a sliding window, as the deviation from the average GC content of the entire sequence. The green/magenta circles represent the GC-skew calculated using a sliding window, as (G-C)/(G+C), and plotted as the deviation from the average GC skew of the entire sequence. The orange and blue bars represent the aggregation and replication regions, respectively. The ‘transfer israelensis plasmid’ (tip) region (Makart et al.2018) is highlighted by the cyan bar inside the replication region. Map was generated by CGView (Grant and Stothard 2008) by using the reverse complement sequence of B. thuringiensis subsp. israelensis plasmid pBTHD789–1 (Acc. #: NC_018516) (Doggett et al.2013) and submitting it to RAST server based on SEED subsystems for CDSs prediction and functional (re-)annotation (Aziz et al.; Overbeek et al.2014). Then, CDSs (re-) annotations were manually verified and compared with those of plasmid pBTHD789–1.
Figure 8.
Figure 8.
Circular map B. thuringiensis sv. israelensis plasmid pBtic360. The block arrows in the outer circles indicate the predicted CDSs in their direction of transcription. The black circle represents the GC content plotted using a sliding window, as the deviation from the average GC content of the entire sequence. The green/magenta circles represent the GC-skew calculated using a sliding window, as (G-C)/(G+C), and plotted as the deviation from the average GC skew of the entire sequence. CDSs with functional annotation are indicated in purple block arrows, and CDSs putatively involved in replication and/or regulation are highlighted by gray block arrows. CDS encoding for a putative mosquitocidal toxin is indicated in green. Transposases, recombinases and integrases enzymes are highlighted by rose block arrows. Map was generated by CGView (Grant and Stothard 2008) using the sequence of B. thuringiensis subsp. israelensis AM65–52 plasmid pAM65–52-5–360K (Acc. #: CP013276) (Bolotin et al.2017).
Figure 9.
Figure 9.
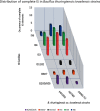
Distribution of complete IS family members among the three complete genomes of B. thuringiensis sv. israelensis strains. The ISsaga web tool (Varani et al.2011) was used for IS annotation. The number of complete IS was detected in each strain genome. Only the families with at least one complete IS located on either the chromosome or the plasmids are shown in this graphic representation.
Figure 10.
Figure 10.
Distribution of all B. cereus repeats in the complete genomes of B. thuringiensis sv. israelensis HD-789, AM65–52 and HD 1002 strains. Note that the number of complete and partial B. cereus repeats in these genomes is shown in Table 5.
Figure 11.
Figure 11.
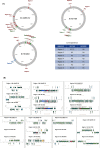
Detection of prophage-like regions in the completed genomes of B. thuringiensis sv. israelensis strains. The FASTER web tool (Zhou et al.2011) was used for prophage region detection. (A) Direct outputs of PHASTER tool representing circular chromosomes of analysed genomes. Coordinate numbering corresponds to GenBank entries (Acc. ##: CP013275 for AM65–52, NC_018508 for HD-789 and NZ_CP009351 for HD 1002). The detected regions were automatically numbered by the PHASTER tool and the colours correspond to reliability of prediction (green > blue > brown). The estimated region correspondence is indicated in the bottom right corner. Region X indicates that no corresponding prediction was provided by the tool for the given strain, question mark indicates that predicted regions cannot be unambiguously counter parted. (B) Each panel represents CDS maps of counter parted regions as provided and coloured by the PHASTER tool. Pale and dark green colours correspond to hypothetical and phage-related functions. Other colours indicate identified and annotated phage functions. The maps for strain HD 1002 are reverse complemented in relation to other two genomes in concordance with the GenBank entry, as the corresponding circular map in A. See additional explanations in the text.

Similar articles

Cited by

References

    1. Abdoarrahem MM, Gammon K, Dancer BN et al. . Genetic basis for alkaline activation of germination in Bacillus thuringiensis subsp. israelensis. Appl Environ Microb 2009;75:6410–3. - PMC - PubMed
    1. Adriaenssens EM, Wittmann J, Kuhn JH et al. . Taxonomy of prokaryotic viruses: 2017 update from the ICTV Bacterial and archaeal viruses subcommittee. Arch Virol 2018;163:1125–9. - PubMed
    1. Ackermann HW, Roy R, Martin M et al. . Partial characterization of a cubic Bacillus phage. Can J Microbiol 1978;24:986–93. - PubMed
    1. Ahn C, Collins-Thompson D, Duncan C et al. . Mobilization and location of the genetic determinant of chloramphenicol resistance from Lactobacillus plantarum caTC2R. Plasmid 1992;27:169–76. - PubMed
    1. Akhter S, Aziz RK, Edwards RA. PhiSpy: A novel algorithm for finding prophages in bacterial genomes that combines similarity- and composition-based strategies. Nucleic Acids Res 2012;40:e126. - PMC - PubMed

Publication types