

Patient-Centered Insights: Using Health Care Complaints to Reveal Hot Spots and Blind Spots in Quality and Safety
- PMID: 30203606
- PMCID: PMC6131356
- DOI: 10.1111/1468-0009.12338
Patient-Centered Insights: Using Health Care Complaints to Reveal Hot Spots and Blind Spots in Quality and Safety
Abstract
Policy Points: Health care complaints contain valuable data on quality and safety; however, there is no reliable method of analysis to unlock their potential. We demonstrate a method to analyze health care complaints that provides reliable insights on hot spots (where harm and near misses occur) and blind spots (before admissions, after discharge, systemic and low-level problems, and errors of omission). Systematic analysis of health care complaints can improve quality and safety by providing patient-centered insights that localize issues and shed light on difficult-to-monitor problems.
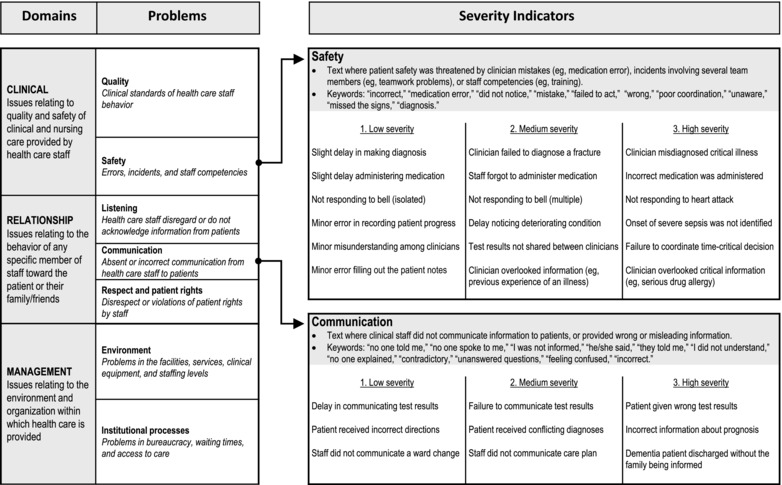
Context: The use of health care complaints to improve quality and safety has been limited by a lack of reliable analysis tools and uncertainty about the insights that can be obtained. The Healthcare Complaints Analysis Tool, which we developed, was used to analyze a benchmark national data set, conceptualize a systematic analysis, and identify the added value of complaint data.
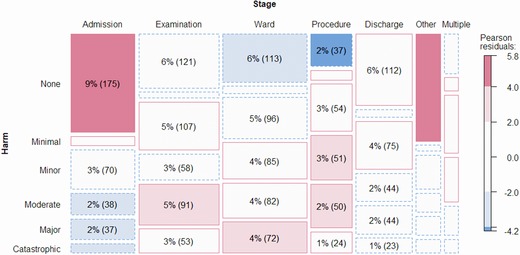
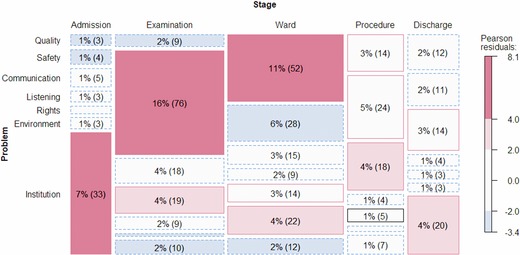
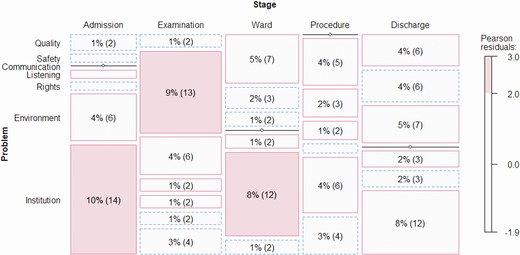
Methods: We analyzed 1,110 health care complaints from across England. "Hot spots" were identified by mapping reported harm and near misses onto stages of care and underlying problems. "Blind spots" concerning difficult-to-monitor aspects of care were analyzed by examining access and discharge problems, systemic problems, and errors of omission.
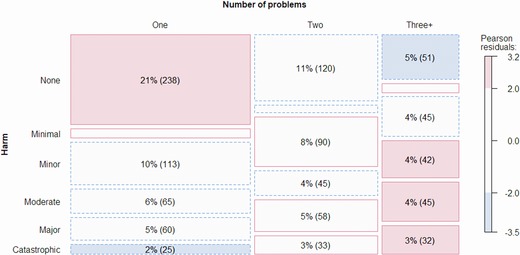
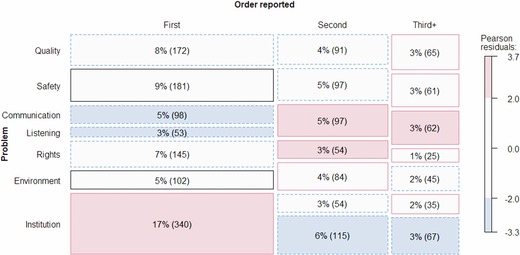
Findings: The tool showed moderate to excellent reliability. There were 1.87 problems per complaint (32% clinical, 32% relationships, and 34% management). Twenty-three percent of problems entailed major or catastrophic harm, with significant regional variation (17%-31%). Hot spots of serious harm were safety problems during examination, quality problems on the ward, and institutional problems during admission and discharge. Near misses occurred at all stages of care, with patients and family members often being involved in error detection and recovery. Complaints shed light on 3 blind spots: (1) problems arising when entering and exiting the health care system; (2) systemic failures pertaining to multiple distributed and often low-level problems; and (3) errors of omission, especially failure to acknowledge and listen to patients raising concerns.
Conclusions: The analysis of health care complaints reveals valuable and uniquely patient-centered insights on quality and safety. Hot spots of harm and near misses provide an alternative data source on adverse events and critical incidents. Analysis of entry-exit, systemic, and omission problems provides insight on blind spots that may otherwise be difficult to monitor. Benchmark data and analysis scripts are downloadable as supplementary files.
Keywords: health care complaints; patient participation; patient safety; patient-centered care; risk management.
© 2018 The Authors The Milbank Quarterly published by Wiley Periodicals, Inc.
Figures
Comment in
-
Health Care Complaints and Adverse Events as a Means of User Involvement for Quality and Safety Improvement.Milbank Q. 2019 Mar;97(1):346-349. doi: 10.1111/1468-0009.12377. Milbank Q. 2019. PMID: 30883957 Free PMC article. No abstract available.
References
Publication types
MeSH terms
Grants and funding
LinkOut - more resources
Full Text Sources
Other Literature Sources
Medical
