. 2018 Dec;32(4):336-352.
doi: 10.1080/01677063.2018.1493479. Epub 2018 Sep 11.

Zebrafish expression reporters and mutants reveal that the IgSF cell adhesion molecule Dscamb is required for feeding and survival

Affiliations

Zebrafish expression reporters and mutants reveal that the IgSF cell adhesion molecule Dscamb is required for feeding and survival

Donald P Julien et al. J Neurogenet. 2018 Dec.

Abstract

Down syndrome cell adhesion molecules (DSCAMs) are broadly expressed in nervous systems and play conserved roles in programmed cell death, neuronal migration, axon guidance, neurite branching and spacing, and synaptic targeting. However, DSCAMs appear to have distinct functions in different vertebrate animals, and little is known about their functions outside the retina. We leveraged the genetic tractability and optical accessibility of larval zebrafish to investigate the expression and function of a DSCAM family member, dscamb. Using targeted genome editing to create transgenic reporters and loss-of-function mutant alleles, we discovered that dscamb is expressed broadly throughout the brain, spinal cord, and peripheral nervous system, but is not required for overall structural organization of the brain. Despite the absence of obvious anatomical defects, homozygous dscamb mutants were deficient in their ability to ingest food and rarely survived to adulthood. Thus, we have discovered a novel function for dscamb in feeding behavior. The mutant and transgenic lines generated in these studies will provide valuable tools for identifying the molecular and cellular bases of these behaviors.

Keywords: Dscam; Zebrafish; behavior; expression pattern; feeding; genome editing.


Figures
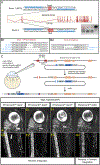
Figure 1 –
Figure 1 –. Using targeted mutagenesis to generate dscamb loss-of-function mutants and enhancer trap reporters
A) The dscamb locus, including TALEN target sites in exon 1 (top) and exon 2 (bottom). Blue boxes indicate TALEN binding sites. Red boxes indicate restriction enzyme sites used for RFLP genotyping. Inset is an example of RFLP genotyping for mutations at exon 2 using genomic DNA from pooled embryos injected with TALEN-encoding mRNA or uninjected. The upper, uncut band in TALEN-injected embryos indicates mutation of the NsiI site. Gene diagram adapted from Ensembl. B) TALEN-generated germline mutations at exon 1 (B1) and exon 2 (B2) sites. C) CRISPR/Cas9 strategy for enhancer trap insertion. D-G) Representative confocal images of independent enhancer trap lines, showing reporter expression in the head (D1, E1, F1, G1) and trunk (D2, E2, F2, G2). Scale bars = 100 um.
Figure 2 –
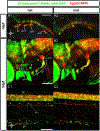
Figure 2 –. dscamb enhancer trap reporter is expressed broadly throughout the CNS and PNS, but homozygous mutant embryos lack obvious structural defects
A-C) Et1(dscambt2b:Gal4) enhancer trap (green) crossed to pan-neuronal Tg(nbt:RFP) in heterozygous (left) and homozygous (right) mutants. A1, A2) Lateral view of the head in 1dpf embryos. gV: trigeminal ganglion, gLLa: anterior lateral line ganglion, gVIII: statoacoustic ganglion, gLLp: posterior lateral line ganglion. B1, B2) Lateral view of head in 5dpf larvae. e: eye, gVIII: statoacoustic ganglion, gX: vagal ganglia, gLLp: posterior lateral line ganglion, arrowheads: otic vesicle hair cell patches, arrows: jaw muscles. C1, C2) Lateral view of trunk in 5dpf larvae. SC: spinal cord, pLL: posterior lateral line axons, asterisks: motor neuron axons, gut: intestine. Scale bars: 100μm.
Figure 3 –
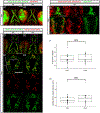
Figure 3 –. dscamb expression and function in specialized cell types
A) Dorsal view of spinal cord in 2dpf embryo showing Et1(dscambt2b:Gal4) in red and BAC(trpa1b:GFP) in green. Scale bar: 100μm. Anterior is to the left. B1-B3) Higher magnification of box in A. Yellow arrowheads: GFP+/RFP+ RBs, white arrowheads: GFP+/RFP-RBs, white arrows: GFP-/RFP+ RBs, asterisks: other RFP+ neurons. C) Et1(dscambt2b:Gal4) driving expression of KikGR in 3dpf heterozygous (C1) and homozygous (C2) larvae. KikGR in ORNs (yellow dashed region) was photoconverted from green to red to delineate axon terminals in glomeruli (magenta dashed region). Yellow arrow: ORN axon coursing to the olfactory bulb. Scale bar: 50μm. Dorsal is up, medial is right. D) Distal portion of gut in a 5dpf heterozygous dscamb mutant; Et1(dscambt2b:Gal4) expression in green and Tg(nbt:RFP) expression in red. Asterisks: GFP+/RFP+ enteric neurons, arrowheads: GFP+ only enteric neurons, arrows: RFP+ only enteric neurons. Scale bar: 50μm E) Number of enteric neurons in the terminal 250μm of the gut. Each point represents one larvae. Mann-Whitney-Wilcoxon test: p = 0.68. Middle box line is the median; lower and upper ends of boxes are 25th and 75th percentiles.
Figure 4 –
Figure 4 –. Jaw muscle fibers and branchiomotor innervation are intact in dscamb mutants
A) Ventral view of head in 4dpf larvae with Et1(dscambt2b:Gal4) expression in jaw muscle fibers in heterozygous (A1) and homozygous (A2) mutants. Arrowheads: BMN axons, dotted lines: jaw muscle fibers (MFs). Scale bar: 100μm B, C) Dorsal images of hindbrain regions in 4dpf larvae with Et1(dscambt2b:Gal4) in red and BMNs in green [Tg(isl1:GFP)]. Confocal projections of the facial (B) and vagal (C) BMN nuclei. Arrowheads: examples of mCherry+/GFP+ BMNs. Scale bars: 50μm D) Confocal projections of ventral head in 7dpf heterozygous (D1, E1) and homozygous (D2, E2) mutants with NMJs labeled presynaptically (SV2, red) and postsynaptically (aBTX, green). E1, E2 are magnifications of dashed boxes in D1, D2, showing NMJs on the INTM-A and INTMP muscles. Scale bar D1: 100μm, scale bar E1: 50μm F, G) Quantification of aBTX-stained object number (F) and median volume on the INTM-A and INTM-P of 7dpf heterozygous and homozygous mutant larvae. N = 16 hets and 13 muts. Mann-Whitney-Wilcoxon test: p = 0.98 for F and p = 0.46 for G. Middle line is the median; lower and upper ends of boxes are 25th and 75th percentiles.
Figure 5 –
Figure 5 –. dscamb is expressed in ACs and RGCs subtypes, but is not required for IPL lamination
A1) Et1(dscambt2b:Gal4) expression in retinal section from 5dpf larva. Dorsal is left, medial is up. Scale bars: 100μm. A2) Higher magnification image of A1. Arrowheads: BCs, arrows: ACs. ONL: outer nuclear layer, OPL: outer plexiform layer, INL: inner nuclear layer, IPL: inner plexiform layer, RGL: retinal ganglion cell layer. Scale bar: 50μm. B-D) Confocal images of IPL in sections from 5dpf heterozygous larvae. Scale bar: 20μm. B) Et1(dscambt2b:Gal4) compared to pan-AC marker (5E11; red). Asterisks: GFP+/5E11+ ACs. C) Et1(dscambt2b:Gal4) compared to Parv+ AC marker (red). Asterisks: GFP+/Parv+ ACs. D) Et1(dscambt2b:Gal4) compared to pan-RGC marker (Hermes; red). E) s25, s45, and s85 Parv+ sublaminae in the IPL. Triangles indicate sublaminae that are GFP+/Parv+ (yellow), GFP+ only (green), Parv+ only (red), or negative for both (empty). Scale bar: 5um. F,G) Images of IPL in 5dpf heterozygous (F) and homozygous (G) dscamb mutant larvae. White dashed lines outline region containing s25 and s45 Parv+ sublaminae. Scale bar: 5um.
Figure 6 –
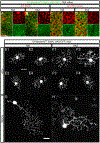
Figure 6 –. dscamb is not required for PR mosaic spacing or RGC/AC self-avoidance
A-D) Confocal projection through the base of zpr3+ rod outer segments (red A,B) or zpr1+ R/G cone cell bodies (red C,D) in retinas from 7dpf heterozygous (A, C) and homozygous (B, D) dscamb mutant larvae. Et1(dscambt2b:Gal4) expression is green. Insets on the right side of each panel are single-color continuations of the left side. Scale bar in A: 10μm. E-H) Sparse Et1(dscambt2b:Gal4) labeling in individual ACs (E and F) or RGCs (G and H) in 5dpf heterozygous (E and G) and homozygous (F and H) dscamb mutant retinas. Scale bars: 10μm.
Figure 7 –
Figure 7 –. Sensory-evoked behavior in dscamb mutants
A) Percentage of 3 dpf wild-type, heterozygous, and homozygous dscamb mutant larvae responding with 0, 1, 2, or 3 escape behaviors in three 3 tail touch trials. Fisher’s exact test of independence: p = 0.40. B1) Auditory startle response latency in 6–8dpf larvae. Middle bar: mean. Grey boxes: 95% confidence intervals. Outer black boxes: one standard deviation. ANOVA: p = 0.46. B2) Pre-pulse inhibition (PPI) of 6–8dpf larvae. ANOVA: p = 0.98. C) Visually-mediated background adaptation. Percentage of 7dpf larvae that adapted pigmentation (light) or failed to adapt pigmentation (dark) to a bright background. Fisher’s exact test: p = 0.72. D) Optomotor response (OMR). Percentage of trials in which 7dpf heterozygous and homozygous mutant dscamb larvae responded to a rotating visual stimulus by moving in the same, opposite, or uncertain direction. 31 hetorozygous larvae were tested in 186 trials. 40 mutant larvae were tested in 240 trials. Fisher’s exact test of independence: p = 0.39. E, F) Light (E) and dark (F) flash responses. Light flashes elicit turning responses and dark flashes elicit O-bends. The percentage of trials with responses (E1, F1) and response latency during individual trials for each 5dpf larva (E2, F2). Error = SEM. ANOVA: **p < 0.01, ***p<0. N ≥ 17 animals, ≥ 94 responses for each experiment.
Figure 8 –
Figure 8 –. dscamb mutants have defective feeding behavior and die at 2–3 weeks of age
A) Percentage of offspring of each genotype from heterozygous dscamb mutant crosses that survived to different time points. Multinomial exact test for goodness-of-fit (predicted proportions wt:het:mut = 0.25:0.75:0.25) p-value: 7dpf = 0.80, 10dpf =0.74, 13dpf =0.73, 16dpf =0.046, 19dpf =0.25, 34dpf =0.0013, 60dpf =0.0017. B) Representative images of 7dpf larvae in three categories of fluorescent food intake. C) Percentage of each genotype in each food intake category. Fisher’s exact test of independence across all groups: p = 0.00050. Post-hoc Fisher’s exact test with Bonferroni correction: full × partial p = 1.2e-10, full × empty p = 4.1e-13, partial × empty p = 1.0. D) Percentage of each food intake category in each genotype. Fisher’s exact test of independence across all groups: p = 0.00050. Post-hoc Fisher’s exact test with Bonferroni correction: wt × het p = 0.81, wt × mut p = 2.2e-12, het × mut p = 1.8e-13. E) Quantification of number of gulps during a 20sec movie for 7dpf heterozygous and homozygous mutants. Each data point represents one fish. Mann-Whitney-Wilcoxon test: p = 0.99. Middle line is the median; lower and upper ends of boxes are 25th and 75th percentiles.

Similar articles

Cited by

References

    1. Agarwala KL, Ganesh S, Amano K, Suzuki T, & Yamakawa K (2001). DSCAM, a Highly Conserved Gene in Mammals, Expressed in Differentiating Mouse Brain. Biochemical and Biophysical Research Communications, 281(3), 697–705. - PubMed
    1. Agarwala KL, Ganesh S, Tsutsumi Y, Suzuki T, Amano K, & Yamakawa K (2001). Cloning and functional characterization of DSCAML1, a novel DSCAM-like cell adhesion molecule that mediates homophilic intercellular adhesion. Biochemical and Biophysical Research Communications, 285(3), 760–772. - PubMed
    1. Allen JR, Bhattacharyya KD, Asante E, Almadi B, Schafer K, Davis J, … Chandrasekhar A (2017). Role of branchiomotor neurons in controlling food intake of zebrafish larvae. Journal of Neurogenetics, 1–10. - PMC - PubMed
    1. Amano K, Fujii M, Arata S, Tojima T, Ogawa M, Morita N, … Yamakawa K (2009). DSCAM deficiency causes loss of pre-inspiratory neuron synchroneity and perinatal death. The Journal of Neuroscience: The Official Journal of the Society for Neuroscience, 29(9), 2984–2996. - PMC - PubMed
    1. Asakawa K, & Kawakami K (2009). The Tol2-mediated Gal4-UAS method for gene and enhancer trapping in zebrafish. Methods, 49(3), 275–281. - PMC - PubMed

Publication types