Clinical Trial
. 2019 Dec;39(12):2471-2485.
doi: 10.1177/0271678X18798441. Epub 2018 Sep 11.

Breath hold effect on cardiovascular brain pulsations - A multimodal magnetic resonance encephalography study

Affiliations
Clinical Trial

Breath hold effect on cardiovascular brain pulsations - A multimodal magnetic resonance encephalography study

Lauri Raitamaa et al. J Cereb Blood Flow Metab. 2019 Dec.

Abstract

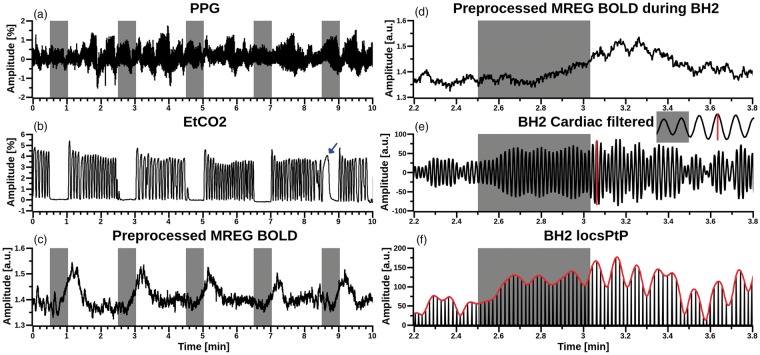
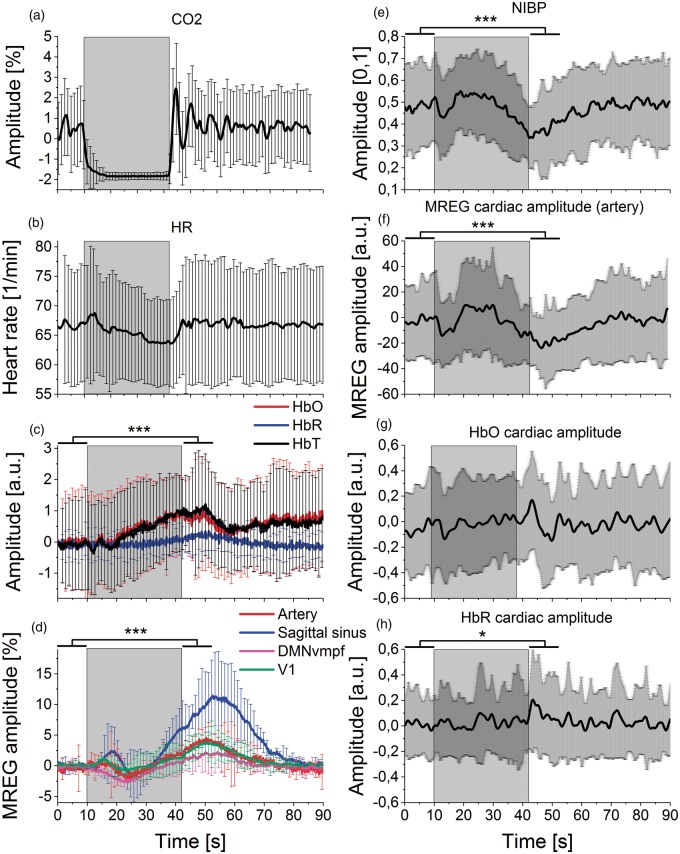
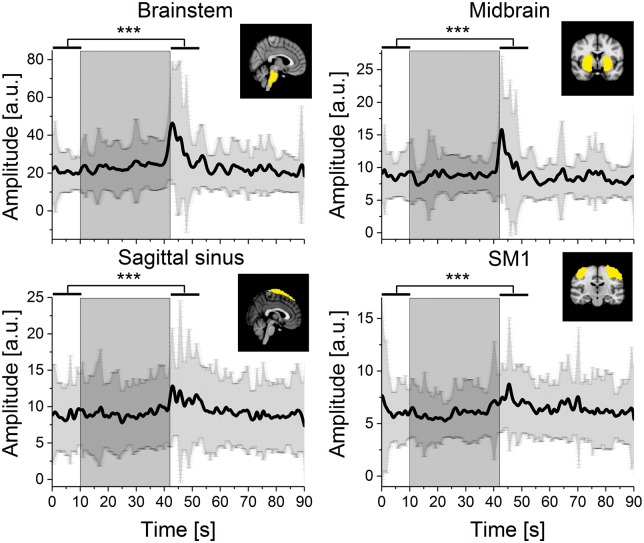
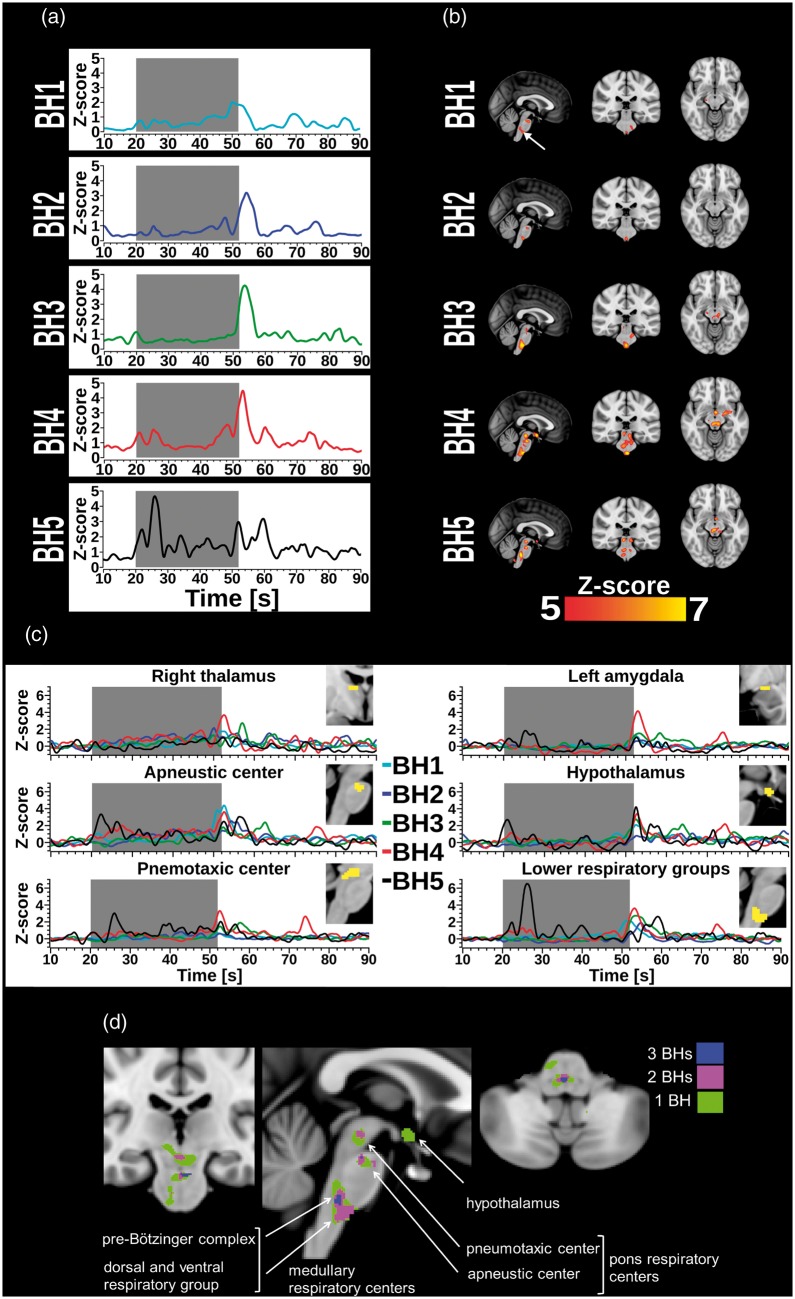
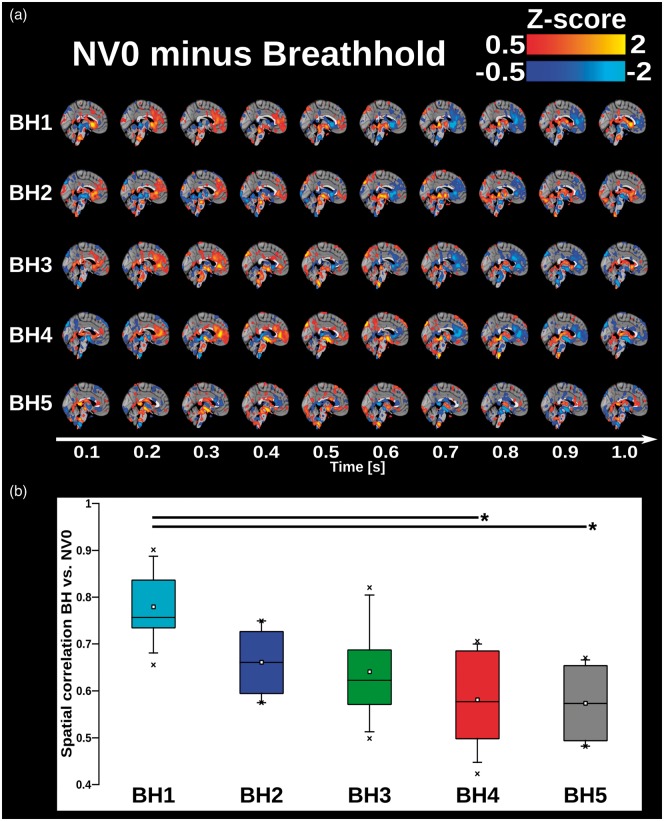
Ultra-fast functional magnetic resonance encephalography (MREG) enables separate assessment of cardiovascular, respiratory, and vasomotor waves from brain pulsations without temporal aliasing. We examined effects of breath hold- (BH) related changes on cardiovascular brain pulsations using MREG to study the physiological nature of cerebrovascular reactivity. We used alternating 32 s BH and 88 s resting normoventilation (NV) to change brain pulsations during MREG combined with simultaneously measured respiration, continuous non-invasive blood pressure, and cortical near-infrared spectroscopy (NIRS) in healthy volunteers. Changes in classical resting-state network BOLD-like signal and cortical blood oxygenation were reproduced based on MREG and NIRS signals. Cardiovascular pulsation amplitudes of MREG signal from anterior cerebral artery, oxygenated hemoglobin concentration in frontal cortex, and blood pressure decreased after BH. MREG cardiovascular pulse amplitudes in cortical areas and sagittal sinus increased, while cerebrospinal fluid and white matter remained unchanged. Respiratory centers in the brainstem - hypothalamus - thalamus - amygdala network showed strongest increases in cardiovascular pulsation amplitude. The spatial propagation of averaged cardiovascular impulses altered as a function of successive BH runs. The spread of cardiovascular pulse cycles exhibited a decreasing spatial similarity over time. MREG portrayed spatiotemporally accurate respiratory network activity and cardiovascular pulsation dynamics related to BH challenges at an unpreceded high temporal resolution.

Keywords: Breath hold; cardiovascular pulsations; cerebrovascular reactivity; magnetic resonance encephalography; respiratory centers.


Figures

Figure 1.
Figure 1.
Multimodal data from one arbitrarily selected subject, with grey bars indicating subsequent BHs. (a) Aestiva/5 continuous fingertip PPG pulsations, (b) Aestiva/5 monitor etCO2 signal for respiration from nasal cannula. For this subject, BH5 was excluded due to spontaneous inhalation (marked with blue arrow). (c) Amplitude of preprocessed MREG BOLD signal from anterior cingulate cortex (x = −6 mm, y = 39 mm, z = 0 mm, 4 mm spherical ROI in MNI space). (d) Magnified view of preprocessed MREG BOLD signal during BH2. (e) Band-pass filtered cardiovascular MREG signal during BH2. Inlay depicts a single pulse amplitude peak-to-peak (red vertical line) calculation. (f) Red envelope curve of cardiovascular pulse amplitude peak to peak (PtP) signal derived from (e).
Figure 2.
Figure 2.
Mean signal amplitude changes during BH. The grey rectangle background marks the averaged BH period (32 s). Lines represent mean of signal amplitude and error bars represent standard deviation over subjects. Significance levels p < 0.05* and p < 0.001***. (a) Breathing with carbon dioxide (CO2), (b) heart rate (HR) from non-invasive blood pressure (NIBP) pulse data. (c) Left frontobasal NIRS measurements (fullband): oxyhemoglobin (HbO, red), deoxyhemoglobin (HbR, blue), total blood volume (HbT, black). HbO steadily increases during BH. (d) Mean MREG BOLD signals in resting-state detected using FSL Melodic PICA: anterior and both median cerebral arteries (Artery, red), sagittal sinus (blue) DMNvmpf = ventromedial part of the default mode network (magenta), primary visual network (V1, green). MREG signal amplitudes showed an initial decrease and a subsequent increase that peaked during NV after BH. (e) Continuous non-invasive blood pressure (NIBP) signal. (F) Cardiovascular pulse amplitude of MREG signal from PICA-derived IC (artery) presents two drops after the onset and end of BH. Amplitude was normalized to the first BH timepoint by subtraction. (g–h) Mean NIRS cardiovascular signal pulsation amplitudes of HbO and HbR show a modulated effect of the pressure drops seen in measures above where NIBP, MREG (artery) and HbO decrease in the early stage and after BH. Amplitudes were normalized to the first BH timepoint by subtraction.
Figure 3.
Figure 3.
Cardiovascular pulse amplitude of MREG signal during BH from ICA-based ROIs (Sagittal sinus, primary somatosensory network (SM1), midbrain and brainstem). The grey box marks the 32 s BH period. Black lines represent mean signal amplitude and the shaded dark grey error bars represent standard deviation. All selected ROIs showed significant increases in signal amplitude following BH compared to preceding NV. Significance level after Bonferroni correction p < 0.0056***.
Figure 4.
Figure 4.
(a) For each BH run, plot shows mean time course of cardiac pulse amplitude extracted from an arbitrarily selected 4 mm spherical ROI located in lower brainstem (0, −30, −51 mm in MNI). The grey box marks the 32 s BH period. Cardiac pulse amplitude increases first manifest in the lower brainstem, but start to occur in the midbrain (thalamus, hypothalamus, and amygdala) with increasing number of BH runs. (b) Panel depicts the highest cardiac pulse amplitude maps threshold at z-score > 5 (p < 0.05, FWE corrected). Cardiac pulse amplitude increases first manifest in the lower brainstem, but start to occur in the midbrain (thalamus, hypothalamus, and amygdala) with increasing number of BH runs. (c) Mean cardiovascular pulse amplitudes of respiratory network ROIs (thalamus, amygdala, hypothalamus, and brainstem regions; z > 5) varied across repeated BH runs. The grey box marks the 32 s BH period. (d) General effect of repeated BH on cardiac pulse amplitudes in the respiratory centers of the brain displayed in coronal view (y = −24 mm), sagittal view (x = 0 mm), and coronal view (y = −4, in MNI). Green, magenta, and blue voxels indicate a significant z-score>6 (threshold was raised to display contoured clusters) in 1, 2, or 3 of the 5 BH runs, respectively. Labels were added in the style of Sherwood's description of respiratory centers in “Fundamentals of Human Physiology”.
Figure 5.
Figure 5.
(a) 3D time lapsed group averaged and phase-matched differential QPP maps of cardiac pulsations of the human brain calculated by subtracting each BH run from NV0. Pulse represented in 1 s time frame with time steps of 0.1 s corresponding MREG TR. Red colors show areas where amplitude of NV0 is greater compared to BH and blue colors show areas where amplitude of BH is greater compared to NV0. (b) 4D spatial correlation of cardiovascular QPP map between BH1–5 and NV0 (colored boxes) On each box, the line and square indicate the median and mean, respectively, and the bottom and top edges of the box indicate the 25th and 75th percentiles, respectively. Whiskers extend to the 5th and 95th percentiles and minimum and maximum values are plotted as ‘x'. Significance bars indicate a significant difference between respective BHs runs, with *:p < 0.01 and **p < 0.001, uncorrected (Supplementary Table 1).

References

    1. Biswal B, Zerrin Yetkin F, Haughton VM, et al. Functional connectivity in the motor cortex of resting human brain using echo-planar MRI. Magn Reson Med 1995; 34: 537–541. - PubMed
    1. Assländer J, Zahneisen B, Hugger T, et al. Single shot whole brain imaging using spherical stack of spirals trajectories. Neuroimage 2013; 73: 59–70. - PubMed
    1. Kiviniemi V, Wang X, Korhonen V, et al. Ultra-fast magnetic resonance encephalography of physiological brain activity – glymphatic pulsation mechanisms? J Cereb Blood Flow Metab 2016; 36: 1033–1045. - PMC - PubMed
    1. Nedergaard M. Garbage truck of the brain. Science 2013; 340: 1529–1530. - PMC - PubMed
    1. Bandettini PA, Wong EC. A hypercapnia-based normalization method for improved spatial localization of human brain activation with fMRI. NMR Biomed 1997; 10: 197–203. - PubMed

Publication types

LinkOut - more resources