. 2018 Sep 11:7:e38097.
doi: 10.7554/eLife.38097.

Identification of cryptic subunits from an apicomplexan ATP synthase

Affiliations

Identification of cryptic subunits from an apicomplexan ATP synthase

Diego Huet et al. Elife. .

Abstract

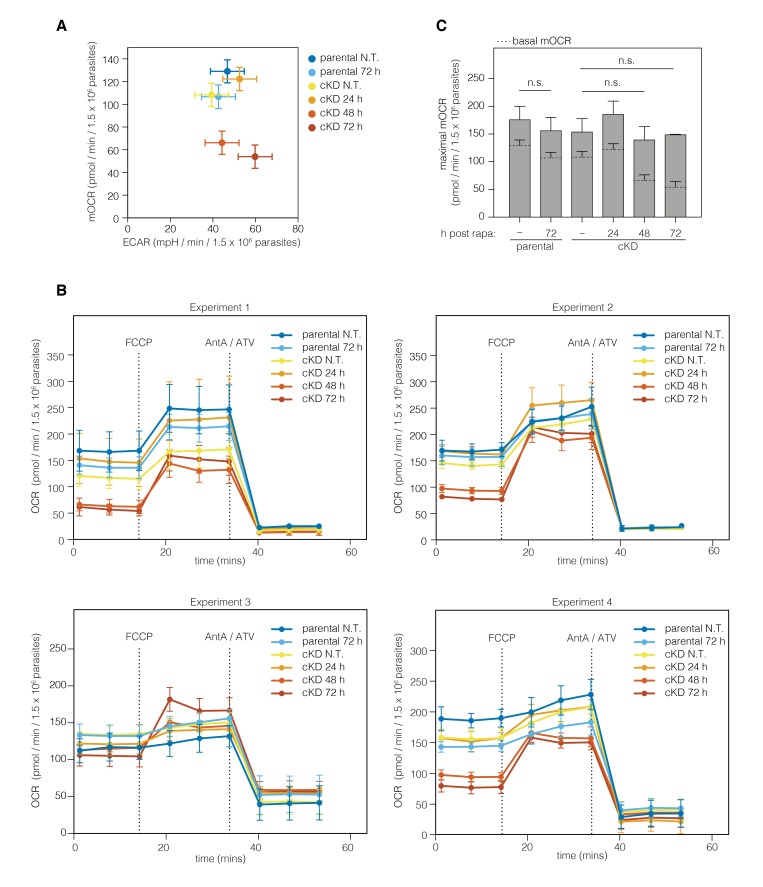
The mitochondrial ATP synthase is a macromolecular motor that uses the proton gradient to generate ATP. Proper ATP synthase function requires a stator linking the catalytic and rotary portions of the complex. However, sequence-based searches fail to identify genes encoding stator subunits in apicomplexan parasites like Toxoplasma gondii or the related organisms that cause malaria. Here, we identify 11 previously unknown subunits from the Toxoplasma ATP synthase, which lack homologs outside the phylum. Modeling suggests that two of them, ICAP2 and ICAP18, are distantly related to mammalian stator subunits. Our analysis shows that both proteins form part of the ATP synthase complex. Depletion of ICAP2 leads to aberrant mitochondrial morphology, decreased oxygen consumption, and disassembly of the complex, consistent with its role as an essential component of the Toxoplasma ATP synthase. Our findings highlight divergent features of the central metabolic machinery in apicomplexans, which may reveal new therapeutic opportunities.

Keywords: ATP synthase; Apicomplexa; Toxoplasma gondii; cell biology; infectious disease; microbiology; mitochondria.


Conflict of interest statement

DH, ER, Gv, SL No competing interests declared

Figures

Figure 1.
Figure 1.. ICAP2 is a conserved apicomplexan protein with structural similarity to ATP synthase b subunits.
(A) Schematic of the Bos taurus ATP synthase b subunit (BtATPb) and ICAP2 showing the mitochondrial targeting signal (MTS), transmembrane domains (TM), and the putative Ca2+-binding domain of ICAP2. The position of the region of similarity (dark blue) is numbered according to the amino acid sequence. (B) Percent identity plot of the aligned ICAP2 homologs from diverse apicomplexans (shown in Figure 1—figure supplement 1). Mean identity within a rolling window of ten residues is plotted. Domains are colored according to the schematic (A) following the positions of the T. gondii residues in the alignment. (C) Neighbor-joining tree showing the phylogenetic relationships of ICAP2 homologs analyzed in (B). Bootstrap values for 10,000 trials are displayed. (D) Immunoblot showing expression of Ty-tagged ICAP2 from its endogenous locus in the ICAP2-Ty strain. ALD serves as a loading control. (E) Intracellular parasites from the parental and ICAP2-Ty strains fixed and stained for Ty (green), HSP70 (red), and DAPI (blue). Scale bar is 10 µm.
Figure 1—figure supplement 1.
Figure 1—figure supplement 1.. Alignment of ICAP2 and its homologs in different apicomplexan and other alveolate species.
The putative Ca2+-binding domain (green) and the region structurally similar to BtATPb (blue) found in Residues that are identical to or chemically similar to the consensus amino acid are shown in a colored background.
Figure 2.
Figure 2.. ICAP2 associates with known components of the ATP synthase.
(A) Immunoprecipitation of Ty from the parental and ICAP2-Ty strains. Immunoblot for Ty, F1β, and ALD in the input, unbound, and eluted fractions. (B) Following Ty immunoprecipitation, the ICAP2-Ty eluted fraction was separated by SDS-PAGE and proteins were visualized by silver staining. The eight gel fractions analyzed by mass spectrometry are labeled according to the known ATP synthase subunits identified in them, along with ICAP2 and ICAP18. Asterisks indicate bands where no known ATP synthase subunits could be identified. (C) Schematic representation of the Bos taurus ATP synthase d subunit (BtATPd) and ICAP18 showing the MTS, TMs, and the region of similarity (dark blue). (D) Percent identity plot of the aligned ICAP18 homologs from diverse apicomplexans (shown in Figure 2—figure supplement 1). Mean identity within a rolling window of ten residues is plotted. Domains are colored according to the diagram (C), and numbered according to the positions of the T. gondii residues in the alignment. (E) Neighbor-joining tree showing the phylogenetic relationships of the ICAP18 homologs analyzed in (D). Bootstrap values for 10,000 trials are displayed. (F) Intracellular parasites from parental and ICAP18-Ty strains fixed and stained for Ty (green), HSP70 (red), and DAPI (blue). Scale bar is 10 µm.
Figure 2—figure supplement 1.
Figure 2—figure supplement 1.. Alignment of ICAP18 and its homologs found in different apicomplexans and other alveolates.
The region sharing structural similarity between BtATPd, and ICAP18 is highlighted in blue. Residues that are identical to or chemically similar to the consensus amino acid are shown with a colored background.
Figure 3.
Figure 3.. The T. gondii ATP synthase associates with proteins conserved among apicomplexans.
(A) Immunoprecipitation of Ty from the ICAP18-Ty strain. Immunoblot for Ty, F1β, and ALD in the input, unbound, and eluted fractions. (B) Following Ty immunoprecipitation, the eluates of the parental, ICAP2-Ty and ICAP18-Ty strains were separated by SDS-PAGE and visualized by silver staining. (C) Table showing the known and novel ATP synthase subunits, including ICAP2 (red) and ICAP18 (green). The table lists the proposed annotation of each gene and the number of times each protein was identified in the MS experiments. Proteins in grey represent candidates that did not meet the analysis criteria, or were clear contaminants. The homology indicates the BLAST expected value (E value) between each T. gondii protein sequence and that of its closest match in Plasmodium falciparum (Pf), Cryptosporidium muris (Cm), Cryptosporidium parvum (Cp), or Chromera velia (Cv). Cases in which a close match could not be identified (E value <0.0001) are indicated in black. The predicted subcellular localization (‘M’ for mitochondrial or ‘–’ for another location) was determined using TargetP and iPSORT. (D) Relative expression pattern of known ATP synthase subunits (blue), ICAP2 (red), ICAP18 (green), and other novel associated proteins (yellow). Proteins that did not meet the analysis criteria are colored grey. The dotted line represents the mean relative expression of the known ATP synthase subunits. Cell-cycle stages are indicated above the plot. (E) Model of the ATP synthase including the known subunits (blue) and the predicted position of ICAP2 (red), ICAP18 (green), and the putative a subunit (orange). See also Figure 3—source data 1.
Figure 3—figure supplement 1.
Figure 3—figure supplement 1.. Co-immunoprecipitations of ICAP2 and ICAP18.
Eluted fractions from Ty immunoprecipitation experiments using the ICAP2Ty and ICAP18Ty strains separated by SDS-PAGE and visualized by silver stain. The four experiments (three with ICAP2Ty, one with ICAP18Ty) along the excised bands used for MS analysis found in Supplementary file 1 are indicated.
Figure 3—figure supplement 2.
Figure 3—figure supplement 2.. Alignment of putative a subunit and its homologs found in different apicomplexans and other alveolates.
The predicted TM domains and conserved arginine residue are highlighted. Residues that are identical to or chemically similar to the consensus amino acid are shown with a colored background.
Figure 4.
Figure 4.. Functional characterization of ICAP2.
(A) Schematic of the ICAP2 locus in the ICAP2-Ty cKD strain indicating the U1-mediated mRNA degradation following the rearrangement caused by a brief pulse of rapamycin (rapa). (B) Immunoblot of the ICAP2-Ty cKD strain monitoring degradation of ICAP2-Ty at different time points following a 2 hr pulse with rapa. ALD serves as a loading control. (C) At different time points following treatment with rapa or vehicle (N.T.), intracellular ICAP2-Ty cKD parasites were fixed and stained for Ty (green), ALD (red), and DAPI (blue). Scale bar is 10 µm. (D) Plaque assay of the parental and ICAP2-Ty cKD strains after treatment with rapa or a vehicle control (DMSO). (E) The parental and ICAP2-Ty cKD strains were pulsed with rapa or a vehicle control 24 hr prior to passaging. Samples were fixed 24 or 48 hr post infection (hpi) and stained for Ty and ALD. The distribution of parasites per vacuole was determined. Bars represent mean ± SD for n = 2 independent biological replicates. At least 150 vacuoles were counted per condition in 2 or more technical replicates. See also Figure 4—source data 1.
Figure 5.
Figure 5.. ICAP2 depletion alters mitochondrial morphology.
(A) Mitochondrial morphology in the ICAP2-Ty cKD parasites visualized by staining for HSP70 (red), ICAP2-Ty (green), and DAPI (blue), at various time points following a 2 hr pulse with rapa. Scale bar is10 µm. (B–C) Changes in mitochondrial volume following ICAP2 depletion. Representative panels displaying the maximum intensity projections and mitochondrial volume from ICAP2-Ty cKD parasites expressing SOD2-GFP and IMC1-TdTomato (B). Live intracellular parasites were imaged following the various treatments. Scale bar is 10 µm. The experiment consisted of two biological replicates, and at least 100 vacuoles from three technical replicates were analyzed per condition (C). Boxplot, *p≤0.05; Student's t-test. (D–F) Electron micrographs of ICAP2-Ty cKD parasites 48 hr after a rapa pulse or treatment with a vehicle control. Insets show representative mitochondria. Scale bars are 500 nm. Blinded analysis of measured mitochondrial area and the number of cristae per µm2 within those areas. Mean ± SD, n.s. p>0.05, ***p<0.0001 by a Mann-Whitney test. See also Figure 5—source data 1.
Figure 6.
Figure 6.. Loss of ICAP2 affects the function and integrity of ATP synthase.
(A–B) Mitochondrial oxygen consumption (mOCR in pmol/min/1.5 × 106 parasites) was determined for the parental and ICAP2-Ty cKD strains at various time points following a 2 hr pulse with vehicle (–) or rapa. Basal mOCR (A) was compared to the maximum mOCR obtained after treating with the uncoupling agent FCCP to calculate the spare capacity (B). Data represent mean ± SEM for n = 4 independent experiments: **p<0.005; ****p<0.0001; n.s. not significant; one-way ANOVA followed by Tukey’s test. (C) Relative ATP concentration for the parental and cKD strain cultured for 72 hr following a 2 hr pulse with vehicle (–) or rapa. ATP concentrations were measured following a 1 hr treatment with the indicated compounds and carbon sources and normalized to the initial ATP concentration of each strain (100%). Data represent mean ± SEM for n = 3 independent experiments for all treatments except glucose, which was only repeated twice; n.s. not significant; *p≤0.05; Student's t-test. (D–E) Lysates from the parental and ICAP2-Ty cKD strains were prepared at various time points following a 2 hr rapa pulse. Lysates were resolved by SDS-PAGE (C) or blue native PAGE (BN-PAGE) and blotted to probe for Ty, F1β, ALD, or TUB1. See also Figure 6—source data 1.
Figure 6—figure supplement 1.
Figure 6—figure supplement 1.. ECAR and OCR following downregulation of ICAP2.
(A) Comparison of mOCR (pmol/min/1.5 × 106 parasites) and ECAR (mpH/min/1.5 × 106 parasites) for parental and cKD strains following the indicated times after a 2 hr rapa pulse. (B) OCR measurements of the four independent experiments for Figure 6 with the parental and cKD strains following the indicated times after a 2 hr rapa pulse. Dotted lines represent the FCCP and antimycin A/atovaquone (AntA/ATV) treatments. (C) Maximal mOCR obtained after treating each strain with the uncoupling agent FCCP. Data represent mean ±SEM in (A, C), n = 4 independent experiments, and mean ± SD in (B): n.s. not significant; one-way ANOVA followed by Tukey’s test.

Similar articles

Cited by

References

    1. Andenmatten N, Egarter S, Jackson AJ, Jullien N, Herman JP, Meissner M. Conditional genome engineering in Toxoplasma gondii uncovers alternative invasion mechanisms. Nature Methods. 2013;10:125–127. doi: 10.1038/nmeth.2301. - DOI - PMC - PubMed
    1. Balabaskaran Nina P, Dudkina NV, Kane LA, van Eyk JE, Boekema EJ, Mather MW, Vaidya AB. Highly divergent mitochondrial ATP synthase complexes in Tetrahymena thermophila. PLoS Biology. 2010;8:e1000418. doi: 10.1371/journal.pbio.1000418. - DOI - PMC - PubMed
    1. Balabaskaran Nina P, Morrisey JM, Ganesan SM, Ke H, Pershing AM, Mather MW, Vaidya AB. ATP synthase complex of plasmodium falciparum: dimeric assembly in mitochondrial membranes and resistance to genetic disruption. The Journal of Biological Chemistry. 2011;286:41312–41322. doi: 10.1074/jbc.M111.290973. - DOI - PMC - PubMed
    1. Bannai H, Tamada Y, Maruyama O, Nakai K, Miyano S. Extensive feature detection of N-terminal protein sorting signals. Bioinformatics. 2002;18:298–305. doi: 10.1093/bioinformatics/18.2.298. - DOI - PubMed
    1. Baracca A, Sgarbi G, Mattiazzi M, Casalena G, Pagnotta E, Valentino ML, Moggio M, Lenaz G, Carelli V, Solaini G. Biochemical phenotypes associated with the mitochondrial ATP6 gene mutations at nt8993. Biochimica Et Biophysica Acta (BBA) - Bioenergetics. 2007;1767:913–919. doi: 10.1016/j.bbabio.2007.05.005. - DOI - PubMed

Publication types

MeSH terms

Substances