. 2018 Sep 10;34(3):499-512.e9.
doi: 10.1016/j.ccell.2018.08.005.

Mutant NPM1 Maintains the Leukemic State through HOX Expression

Affiliations

Mutant NPM1 Maintains the Leukemic State through HOX Expression

Lorenzo Brunetti et al. Cancer Cell. .

Abstract

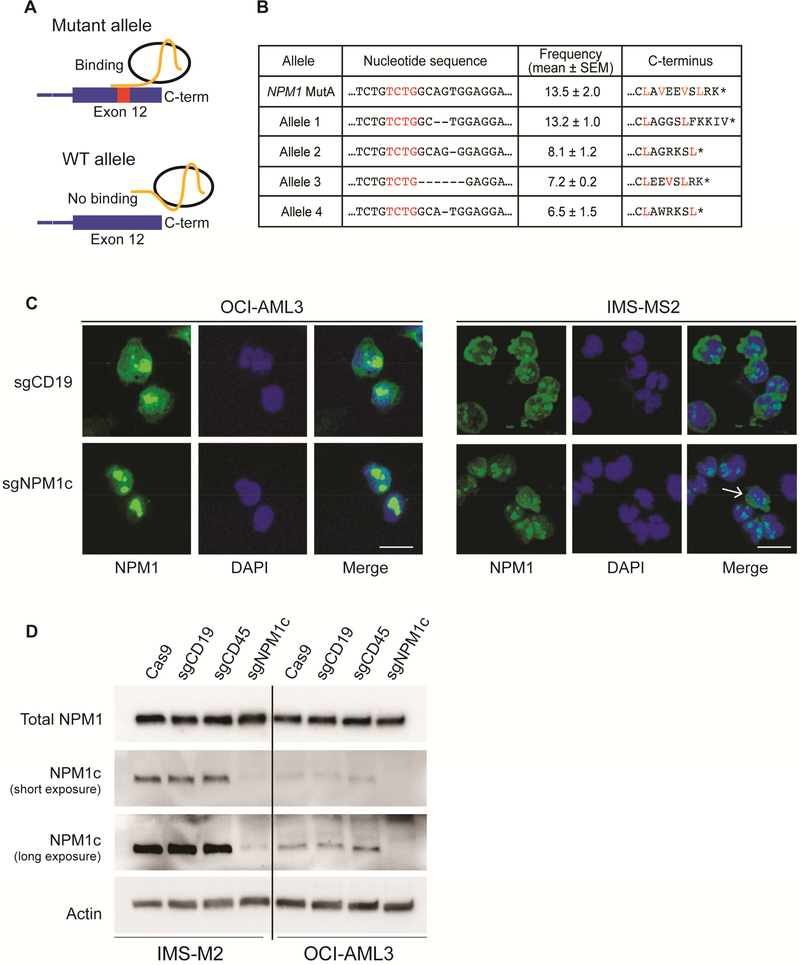
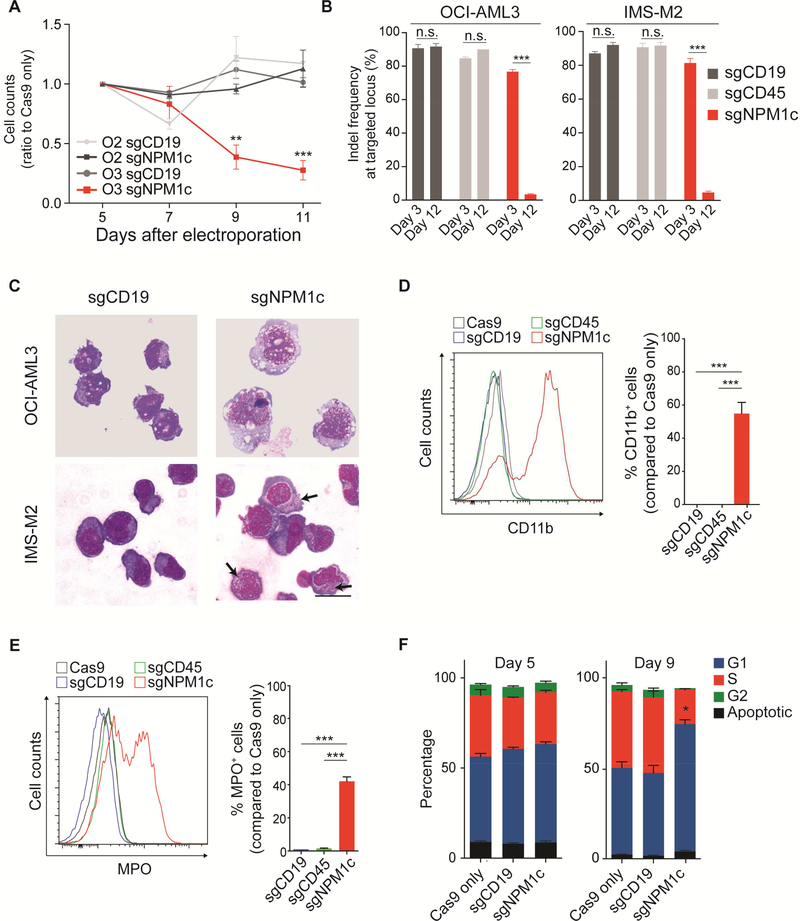
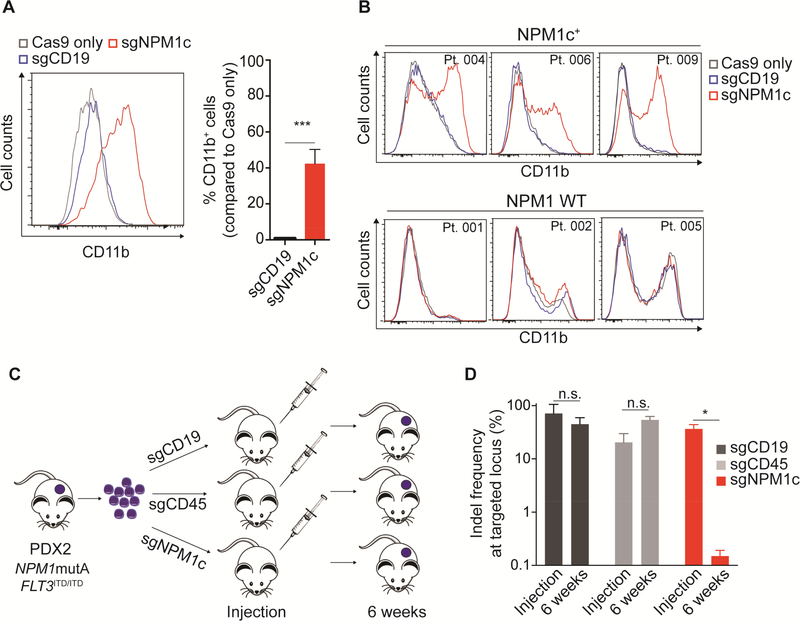
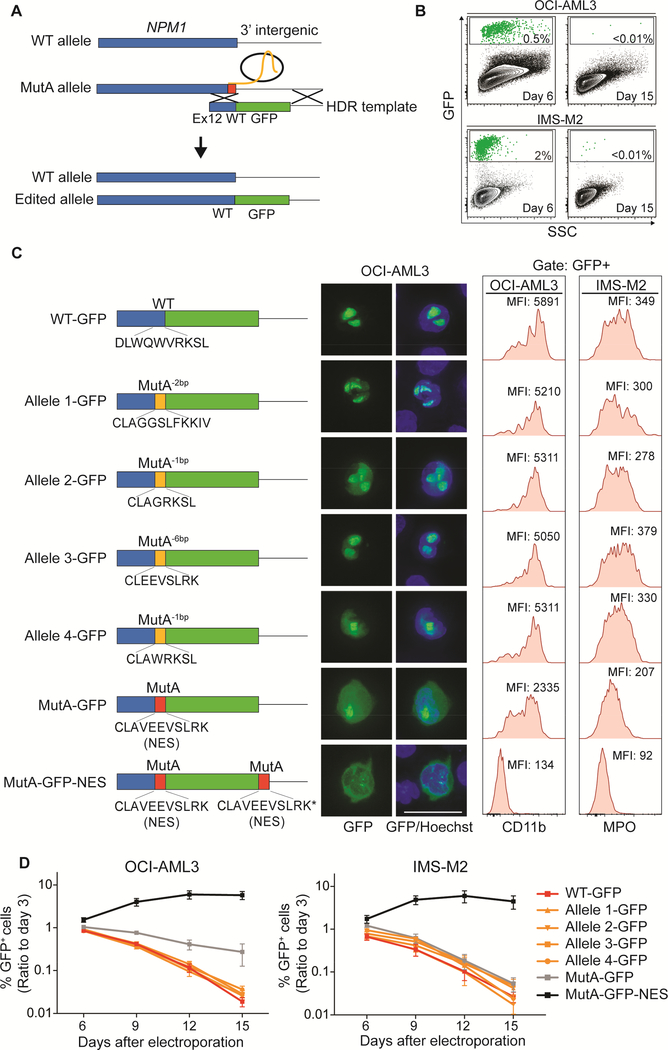
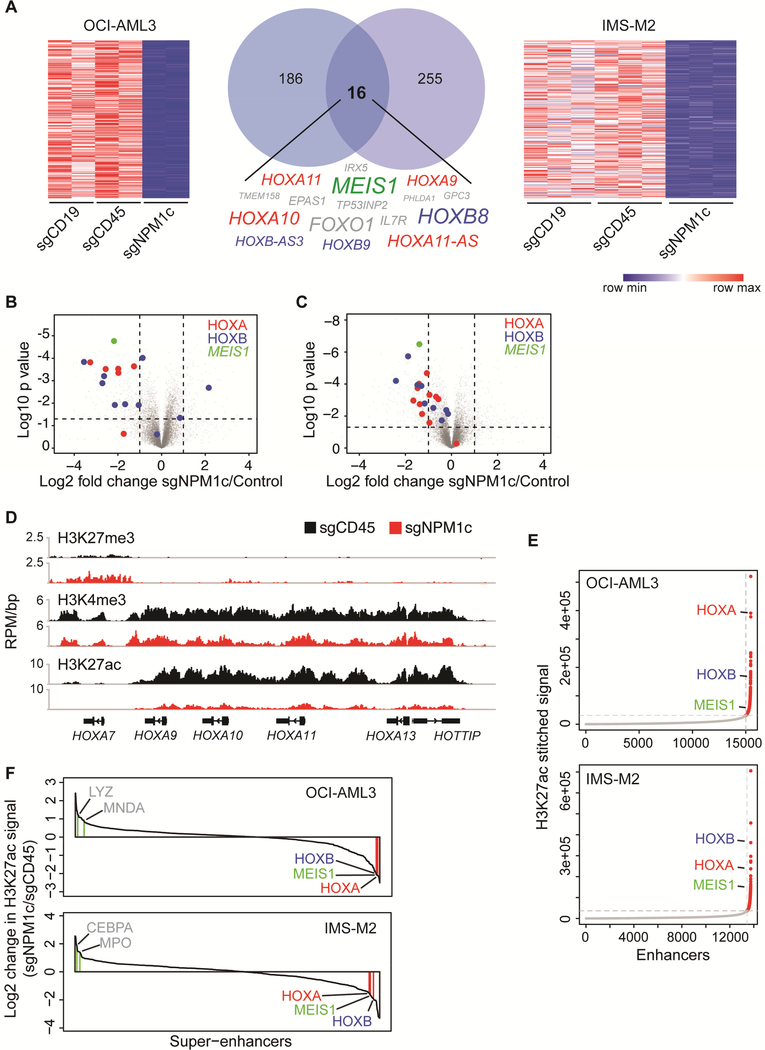
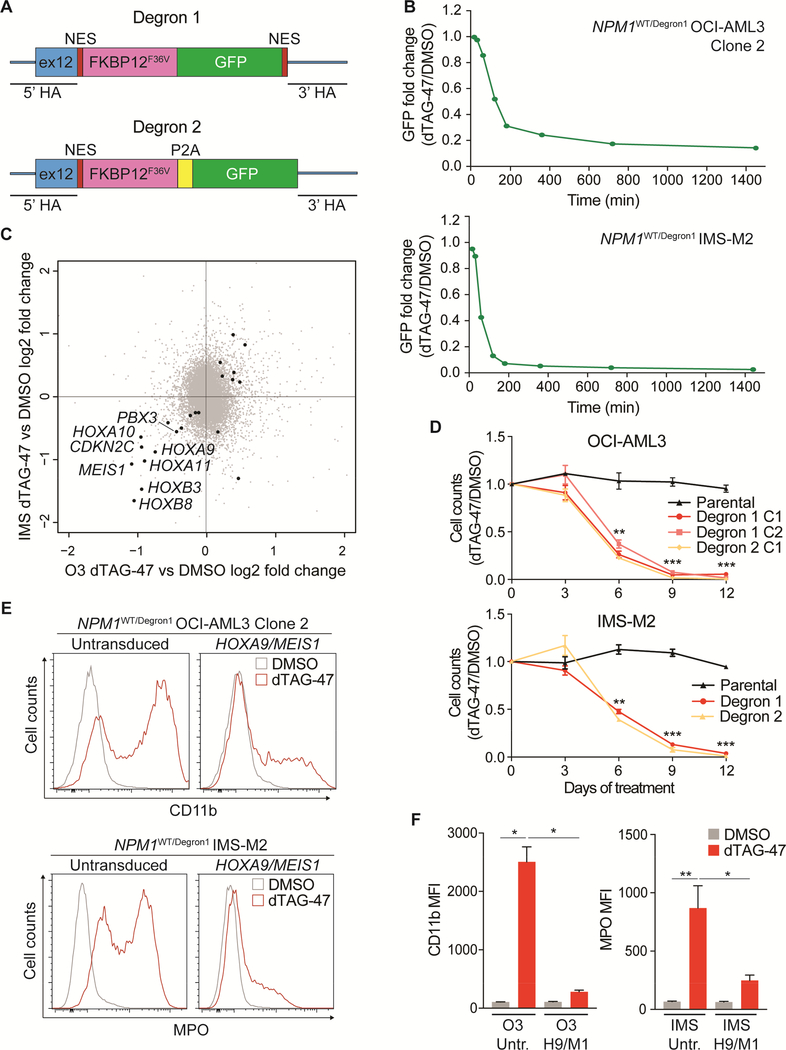
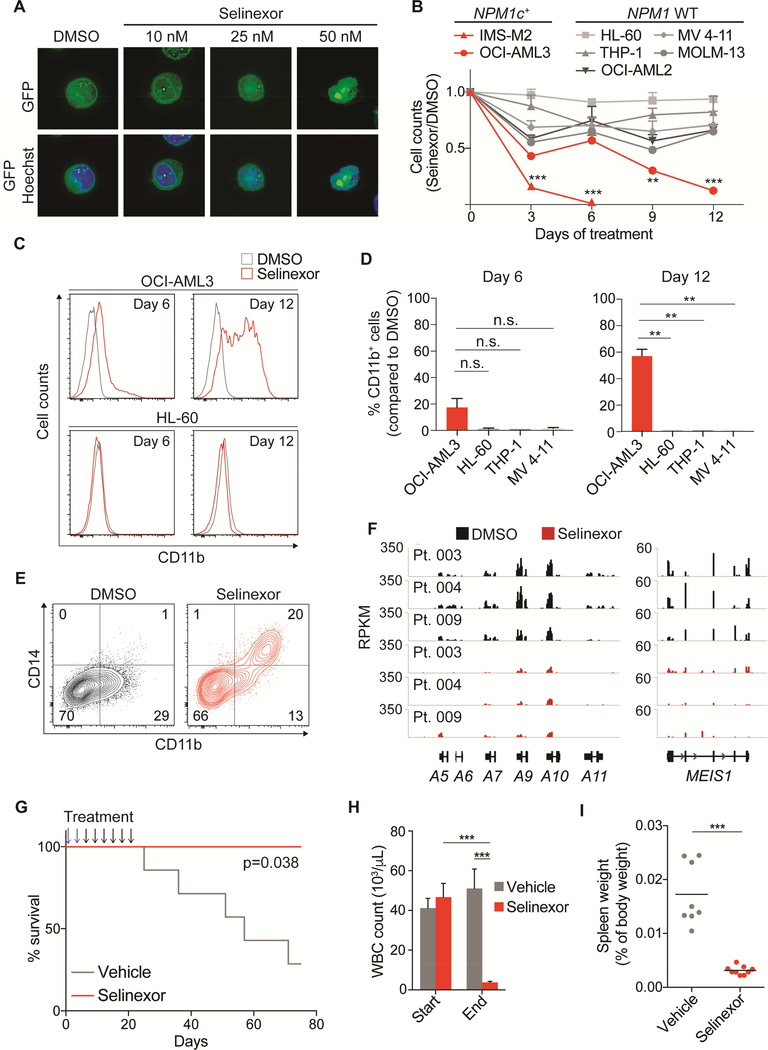
NPM1 is the most frequently mutated gene in cytogenetically normal acute myeloid leukemia (AML). In AML cells, NPM1 mutations result in abnormal cytoplasmic localization of the mutant protein (NPM1c); however, it is unknown whether NPM1c is required to maintain the leukemic state. Here, we show that loss of NPM1c from the cytoplasm, either through nuclear relocalization or targeted degradation, results in immediate downregulation of homeobox (HOX) genes followed by differentiation. Finally, we show that XPO1 inhibition relocalizes NPM1c to the nucleus, promotes differentiation of AML cells, and prolongs survival of Npm1-mutated leukemic mice. We describe an exquisite dependency of NPM1-mutant AML cells on NPM1c, providing the rationale for the use of nuclear export inhibitors in AML with mutated NPM1.

Keywords: AML; CRISPR; HOX; MEIS1; NPM1; XPO1; acute myeloid leukemia; dTAG; nuclear export; selinexor.


Conflict of interest statement

Declaration of interests

D.L.B. is now an employee at Novartis.

Figures

Figure 1.
Figure 1.. Allele-specific targeting of NPM1c relocalizes mutant NPM1 to the nucleus.
(A) Schematic representation of the allele-specific editing strategy. An sgRNA spanning the 4 bp insertion of NPM1 mutant A (sgNPM1c) was designed to specifically target the mutant allele. (B) The nucleotide sequence, C-terminal amino-acid sequence, and corresponding allele frequency (n=3; mean ± SEM) of the most represented mutant alleles observed following amplicon sequencing of OCI-AML3 cells transfected with sgNPM1c. (C) Immunofluorescence with an antibody against the N-terminus of NPM1 (total NPM1) 4 days after transfection with the indicated sgRNA. An unedited cell with cytoplasmic protein is shown (white arrow). Scale bar: 20 μm. (D) Immunoblot of total NPM1 (top) and NPM1c C-terminal epitope (middle) 4 days after transfection with the indicated sgRNA. See also Figure S1 and Table S1.
Figure 2.
Figure 2.. Nuclear relocalization of NPM1c induces cell growth arrest and differentiation in AML cell lines.
(A) Viable cell counts by trypan blue exclusion of OCI-AML3 (O3; NPM1c+) and OCI-AML2 (O2; NPM1 WT) cells transfected with Cas9 only, a guide targeting CD19 (sgCD19), or sgNPM1c. Equal numbers of cells were plated 5 days after electroporation. Results are reported as ratio to Cas9 only control. (OCI-AML3 n=3, OCI-AML2 n=2; mean ± SEM). (B) Indel frequencies at targeted loci (i.e. CD19, CD45 and NPM1c) calculated by highthroughput amplicon sequencing at days 3 and 12 after electroporation with indicated sgRNAs (n=3, mean ± SEM). (C) May-Grünwald Giemsa staining of OCI-AML3 and IMS-M2 cells 9 and 6 days, respectively, after transfection with the indicated sgRNA. Arrows indicate azurophilic granules. Scale bar: 20 μm. (D) Flow cytometry analysis of CD11b expression in OCI-AML3 cells 9 days after electroporation. Left panel shows distribution of CD11b signal in cells transfected with sgRNAs against the indicated genes (CD19 and CD45 serving as controls). Right panel shows the percentage of CD11b+ cells (n=6; mean ± SEM). The cut-off point for CD11b positivity was set at the last one percentile of the gaussian curve of Cas9 only controls. (E) Flow cytometry analysis of myeloperoxidase (MPO) expression in IMS-M2 cells 6 days after electroporation. Left panel shows distribution of MPO signal for indicated sgRNA. Right panel shows the percentage of MPO+ cells (n=6; mean ± SEM). The cut-off point for MPO positivity was set at the last one percentile of the gaussian curve of Cas9 only controls. (F) Cell cycle analysis by BrdU incorporation and 7-AAD 5 and 9 days following electroporation with sgNPM1c and controls (n=3, mean ± SEM). * p<0.05, ** p<0.01, *** p<0.001; unpaired t-test with Welch’s correction. See also Figure S2 and Table S2.
Figure 3.
Figure 3.. Nuclear relocalization of NPM1c induces cell growth arrest and differentiation in primary AML cells.
(A) Flow cytometry analysis of CD11b expression in PDX2 cells 9 days after electroporation. Left panel shows distribution of CD11b signal after treatment with the indicated sgRNA. Right panel shows the percentage of CD11b+ cells (n=4; mean ± SEM). The cut-off point for CD11b positivity was set at the last percentile of the gaussian curve of Cas9 only controls. (B) CD11b expression analysis by flow cytometry in 3 NPM1-mutant primary AML samples (top) and 3 NPM1 WT samples (bottom) transfected with sgNPM1c or control sgRNA targeting CD19 (sgCD19), analyzed at day 12 following electroporation. A table with the genetic characteristics of the primary samples is provided in Table S3. (C) Schematic representation of the in vivo experiment with PDX2 cells. Cells were harvested from subcutaneous masses and cultured for 48 hr. For each replicate 6×10⁵ cells were electroporated with sgCD19, sgCD45 or sgNPM1c and left in culture for additional 24 hr. Each one of replicates was subcutaneously injected into NSG recipients. Resulting masses were allowed to grow for 6 weeks and then harvested for DNA purification. (D) Indel frequencies at targeted loci (i.e. CD19, CD45 and NPM1c) calculated by highthroughput amplicon sequencing at the time of transplant and on leukemic cells harvested from masses (purple circles in Figure 3C) (n=3; mean ± SEM). * p<0.05, ** p<0.01, *** p<0.001; unpaired t-test with Welch’s correction. See also Figure S3 and Tables S3 and S4.
Figure 4.
Figure 4.. Leukemic phenotype of AML with mutated NPM1 is dependent on the nuclear/cytoplasmic ratio of NPM1c.
(A) Schematic representation of precise editing strategy of the C-terminus of the NPM1c allele through homology-directed repair (HDR). (B) Flow cytometry plots showing precisely edited OCI-AML3 and IMS-M2 cells (GFP+) at days 6 and15 following correction of the NPM1 mutant allele to the WT sequence. (C) HDR templates used for precise editing of the NPM1c allele (left). Fluorescence microscopy showing sub-cellular localization (middle) and flow cytometry showing immunophenotypic differentiation features including CD11b (OCI-AML3) and MPO (IMS-M2) (right). MFI=median fluorescence intensity. Scale bar: 25 μm. (D) Percentages of edited cells (GFP+) over 15 days. The cut-off point for GFP positivity was set at the last percentile of the gaussian curve of sgNPM1c-only transfected cells (n=7 for OCIAML3, n=5 for IMS-M2; mean ± SEM). See also Figure S4.
Figure 5.
Figure 5.. Nuclear relocalization of NPM1c induces HOX/MEIS1 downregulation.
(A) Heatmaps and Venn diagram showing genes downregulated >2 fold (p<0.01) in OCI-AML3 and IMS-M2 cells 3 days after transfection with sgNPM1c, compared to control sgRNAs (sgCD19 and sgCD45). The 16 genes downregulated in both cell lines are listed. Size of text corresponds to significance of downregulation. (n=2 for OCI-AML3, n=3 for IMS-M2; p value derived from two-tailed Student’s t-test). (B) Volcano plots depicting differentially expressed genes in OCI-AML3 cells transfected with sgNPM1c compared with control sgRNAs. (n=2; p value derived from two-tailed Student’s ttest). (C) Volcano plot depicting differentially expressed genes in IMS-M2 cells transfected with sgNPM1c compared with control sgRNAs. (n=3; p value derived from two-tailed Student’s ttest). (D) Gene track view of H3K27me3, H3K4me3, and H3K27ac ChIP-seq signal at distal HOXA locus 3 days after transfection of sgCD45 (black) or sgNPM1c (red) into OCI-AML3 cells. (E) Enhancers in OCI-AML3 or IMS-M2 cells ranked by increasing H3K27ac signal. The cut-off discriminating typical enhancers (grey) from super-enhancers (red) is depicted with vertical and horizontal dashed lines. (F) Waterfall plot depicting change in H3K27ac ChIP-seq signal at super-enhancers 3 days after transfection of sgNPM1c or sgCD45 control in OCI-AML3 and IMS-M2 cells. Genes associated with myeloid differentiation are depicted in grey. See also Figure S5 and Table S5.
Figure 6.
Figure 6.. Targeted degradation of NPM1c induces cell growth arrest, differentiation and rapid downregulation of HOX/MEIS1.
(A) Homology recombination templates used for targeted degradation of mutant NPM1. (B) Kinetics of Degron1 fusion protein degradation in NPM1WT/Degron1 OCI-AML3 (Clone 2) and IMS-M2 cells (bulk) following treatment with 500 nM dTAG-47 or DMSO as assessed by flow cytometry at multiple time points. Fold changes were calculated as ratio of GFP median fluorescence intensity (MFI) of dTAG-47-treated and DMSO-treated cells. (n=3; mean ± SEM). (C) Scatter plot showing differentially expressed genes in NPM1WT/Degron1 OCI-AML3 (Clone 2) and NPM1WT/Degron1 IMS-M2 (bulk) cells after 6 hr treatment with 500 nM dTAG-47 or DMSO. Black dots indicate genes with significant (p<0.01) differential expression (n=3; p value derived from two-tailed Student’s t-test). (D) Viable cell counts by trypan blue exclusion of NPM1WT/Degron1 and NPM1WT/Degron2 OCIAML3 (clones) and IMS-M2 (bulk) cells treated with 500 nM dTAG-47 for up to 12 days. Results are reported as ratio to DMSO-treated cells (n=3; mean ± SEM). (E) Distribution of CD11b signal in untransduced and HOXA9/MEIS1-transduced NPM1WT/Degron1 OCI-AML3 (Clone 2) cells after 9 days of treatment with 500 nM dTAG-47 or DMSO (top). Distribution of MPO signal in untransduced and HOXA9/MEIS1-transduced NPM1WT/Degron1 IMS-M2 (bulk) cells after 6 days of treatment with 500 nM dTAG-47 or DMSO (bottom). (F) CD11b levels expressed as MFI in untransduced (Untr.) and HOXA9/MEIS1-transduced (H9/M1) NPM1WT/Degron1 OCI-AML3 (Clone 2) cells after 9 days of treatment with 500 nM dTAG-47 or DMSO (left). MPO levels expressed as MFI in NPM1WT/Degron1 IMS-M2 cells (bulk) transduced as above after 6 days of treatment with 500 nM dTAG-47 or DMSO (right) (n=3 for OCI-AML3, n=6 for IMS-M2; mean ± SEM). HA=homology arm; O3=OCI-AML3; IMS=IMS-M2; C1=Clone 1; C2=Clone 2. * p<0.05, ** p<0.01, *** p<0.001; unpaired t-test with Welch’s correction. See also Figure S6.
Figure 7.
Figure 7.. XPO1 inhibition recapitulates genetic disruption of mutant NPM1 nuclear export signal.
(A) Fluorescence microscopy of NPM1WT/MutA-GFP-NES OCI-AML3 cells treated with increasing concentrations of Selinexor for 12 hr. Scale bar 20 μM (B) Cell counts of indicated NPM1 WT and NPM1c+ cell lines treated with either 50 nM Selinexor or DMSO for 12 days. Cells were counted and replated at equal concentrations with fresh drugs every 3 days. (n=6 for OCI-AML3, n=2 for MOLM-13, n=4 for all other cell lines; mean ± SEM) (C) Flow cytometry analysis of CD11b expression in OCI-AML3 (NPM1c+) and HL-60 (NPM1 WT) cells after 6 and 12 days of treatment with 50 nM Selinexor or DMSO. (D) Percentage of CD11b+ cells by flow cytometry analysis in OCI-AML3, HL-60, THP-1 and MV 4–11 cells after 6 and 12 days of treatment with 50 nM Selinexor. The cut-off point for CD11b positivity was set at the last one percentile of the Gaussian curve of DMSO-treated cells. (E) Flow cytometry contour plot showing CD14 and CD11b expression levels in a primary AML sample (Pt. 004) treated for 12 days with 50 nM Selinexor or DMSO. (F) RNA-sequencing data showing distal HOXA and MEIS1 locus in 3 primary AML samples treated with 100 nM Selinexor or DMSO for 24 hr. (G) Kaplan-Meier survival curves of Npm1c/Flt3-ITD leukemic mice treated with Selinexor or vehicle. Selinexor was administered every 3 days at 25 mg/kg for the first two doses (blue arrows) and at 20 mg/kg for the following six doses (black arrows) for a total of eight administrations over 21 days (n=7 for vehicle, n=4 for Selinexor; log-rank test). (H) White blood cell counts of Npm1c/Flt3-ITD leukemic mice analyzed at the time of the last administration of Selinexor or vehicle (n=14 for vehicle, n=17 for Selinexor; mean ± SEM). (I) Spleen weight of Npm1c/Flt3-ITD leukemic mice analyzed at the time of the last administration of Selinexor or vehicle. Horizontal line depicts mean. * p<0.05, ** p<0.01, *** p<0.001; unpaired t-test with Welch’s correction. See also Figure S7.

Comment in

References

    1. Abdul Razak AR, Mau-Soerensen M, Gabrail NY, Gerecitano JF, Shields AF, Unger TJ, Saint-Martin JR, Carlson R, Landesman Y, McCauley D, et al. (2016). First-in-Class, First-in-Human Phase I Study of Selinexor, a Selective Inhibitor of Nuclear Export, in Patients With Advanced Solid Tumors. J Clin Oncol 34, 4142–4150. - PMC - PubMed
    1. Alcalay M, Tiacci E, Bergomas R, Bigerna B, Venturini E, Minardi SP, Meani N, Diverio D, Bernard L, Tizzoni L, et al. (2005). Acute myeloid leukemia bearing cytoplasmic nucleophosmin (NPMc+ AML) shows a distinct gene expression profile characterized by upregulation of genes involved in stem-cell maintenance. Blood 106, 899–902. - PubMed
    1. Argiropoulos B, and Humphries RK (2007). Hox genes in hematopoiesis and leukemogenesis. Oncogene 26, 6766–6776. - PubMed
    1. Balusu R, Fiskus W, Rao R, Chong DG, Nalluri S, Mudunuru U, Ma H, Chen L, Venkannagari S, Ha K, et al. (2011). Targeting levels or oligomerization of nucleophosmin 1 induces differentiation and loss of survival of human AML cells with mutant NPM1. Blood 118, 3096–3106. - PMC - PubMed
    1. Bolli N, Nicoletti I, De Marco MF, Bigerna B, Pucciarini A, Mannucci R, Martelli MP, Liso A, Mecucci C, Fabbiano F, et al. (2007). Born to be exported: COOH-terminal nuclear export signals of different strength ensure cytoplasmic accumulation of nucleophosmin leukemic mutants. Cancer Res 67, 6230–6237. - PubMed

Publication types

MeSH terms