

Response of Cisplatin Resistant Skov-3 Cells to [Pt(O,O'-Acac)(γ-Acac)(DMS)] Treatment Revealed by a Metabolomic ¹H-NMR Study
- PMID: 30205612
- PMCID: PMC6225129
- DOI: 10.3390/molecules23092301
Response of Cisplatin Resistant Skov-3 Cells to [Pt(O,O'-Acac)(γ-Acac)(DMS)] Treatment Revealed by a Metabolomic ¹H-NMR Study
Abstract
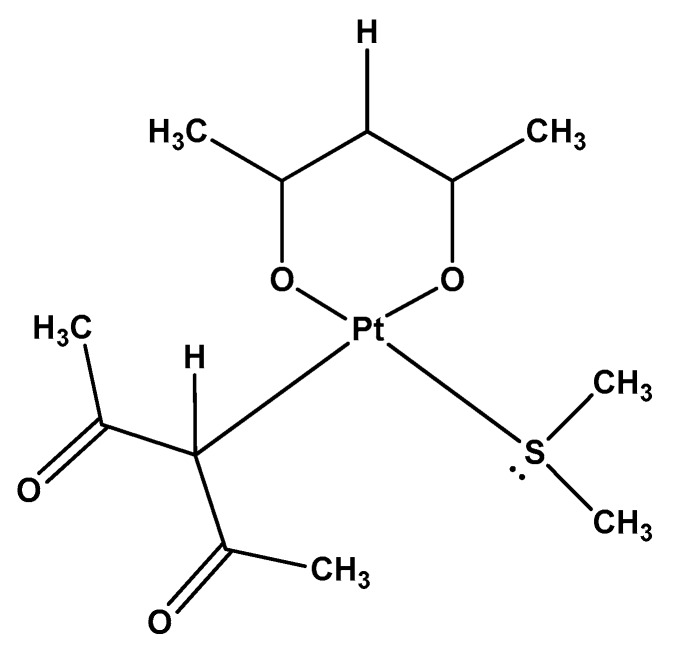
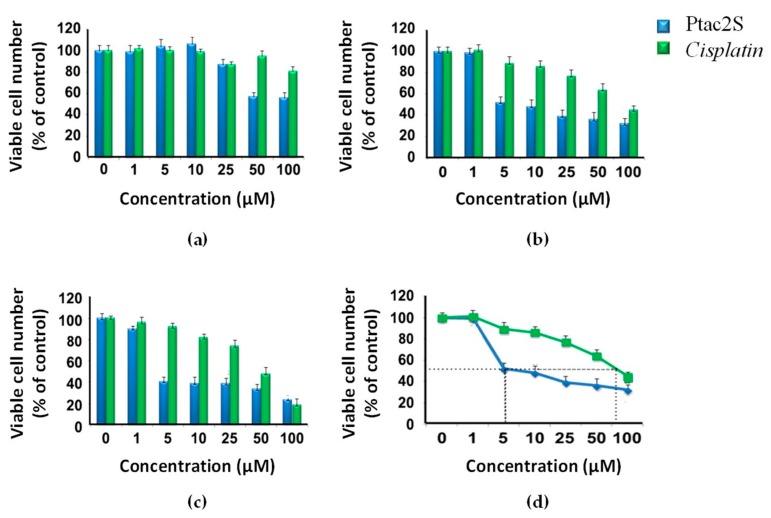
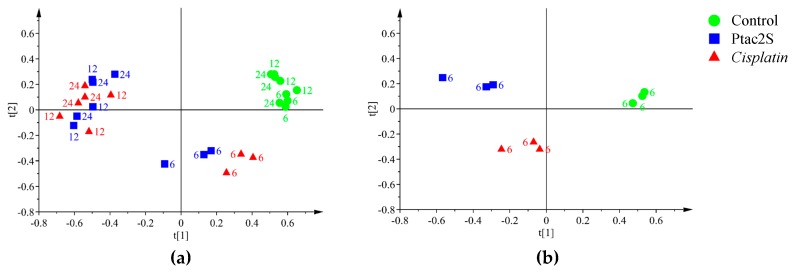
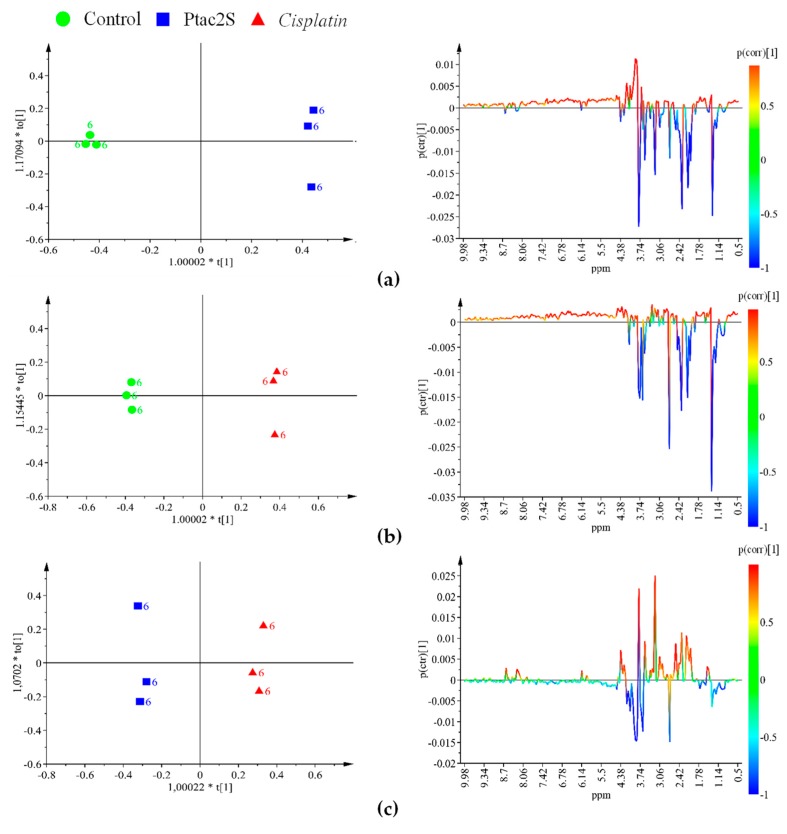
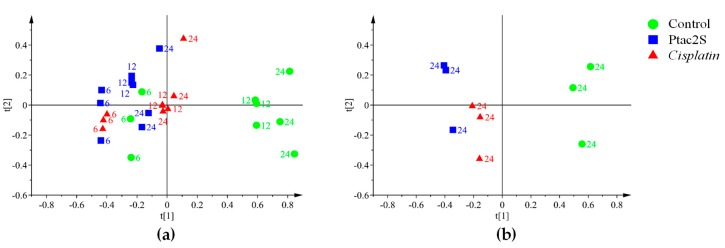
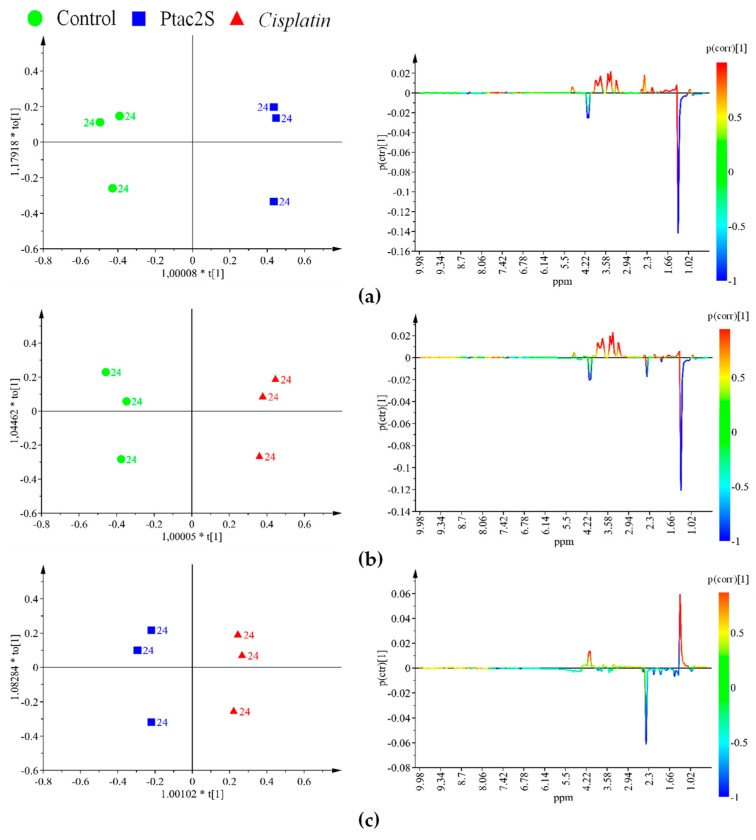
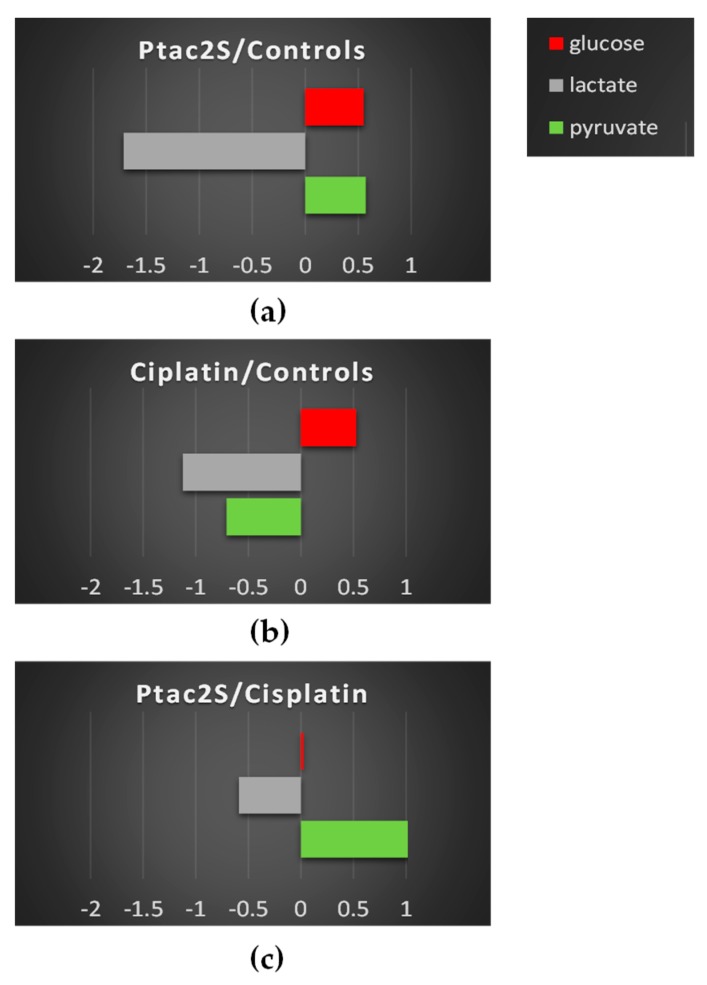
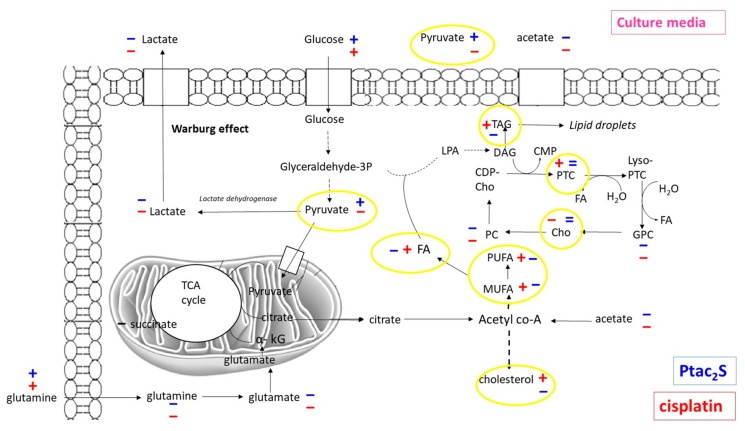
The novel [Pt(O,O'-acac)(γ-acac)(DMS)], Ptac2S, Pt(II) complex has recently gained increasing attention as a potential anticancer agent for its pharmacological activity shown in different tumor cell lines, studied both in vitro and in vivo. The mechanism of action of Ptac2S, operating on non-genomic targets, is known to be very different from that of cis-[PtCl₂(NH₃)₂], cisplatin, targeting nucleic acids. In this work, we evaluated the cytotoxicity of Ptac2S on the cisplatin resistant Epithelial Ovarian Carcinoma (EOC), SKOV-3 cells, by the MTT assay. A ¹H-NMR metabolomic approach coupled with multivariate statistical analysis was used for the first time for Ptac2S to figure out the biological mechanisms of action of the complex. The metabolic variations of intracellular metabolites and the composition of the corresponding extracellular culture media were compared to those of cisplatin (cells were treated at the IC50 doses of both drugs). The reported comparative metabolomic analysis revealed a very different metabolic profile between Ptac2S and cisplatin treated samples, thus confirming the different mechanism of action of Ptac2S also in the Epithelial Ovarian Carcinoma (EOC), SKOV-3 cells line. In particular, higher levels of pyruvate were observed in Ptac2S treated, with respect to cisplatin treated, cells (in both aqueous and culture media). In addition, a very different lipid expression resulted after the exposure to the two drugs (Ptac2S and cisplatin). These results suggest a possible explanation for the Ptac2S ability to circumvent cisplatin resistance in SKOV-3 cells.
Keywords: 1H-NMR metabolomics; Epithelial Ovarian Carcinoma; Ptac2S; SKOV-3 cells; [Pt(O,O′-acac)(γ-acac)(DMS)]; cisplatin; platinum based drugs.
Conflict of interest statement
The authors declare no conflict of interest. The funders had no role in the design of the study, in the collection, analyses, or interpretation of data; in the writing of the manuscript, and in the decision to publish the results.
Figures
Similar articles
-
Different apoptotic effects of [Pt(O,O'-acac)(γ-acac)(DMS)] and cisplatin on normal and cancerous human epithelial breast cells in primary culture.Br J Pharmacol. 2014 Nov;171(22):5139-53. doi: 10.1111/bph.12831. Epub 2014 Sep 5. Br J Pharmacol. 2014. PMID: 24990093 Free PMC article.
-
In Vitro and In Vivo Antitumor Activity of [Pt(O,O'-acac)(γ-acac)(DMS)] in Malignant Pleural Mesothelioma.PLoS One. 2016 Nov 2;11(11):e0165154. doi: 10.1371/journal.pone.0165154. eCollection 2016. PLoS One. 2016. PMID: 27806086 Free PMC article.
-
Apoptosis by [Pt(O,O'-acac)(γ-acac)(DMS)] requires PKC-δ mediated p53 activation in malignant pleural mesothelioma.PLoS One. 2017 Jul 12;12(7):e0181114. doi: 10.1371/journal.pone.0181114. eCollection 2017. PLoS One. 2017. PMID: 28704484 Free PMC article.
-
New platinum(II) complexes containing both an O,O'-chelated acetylacetonate ligand and a sulfur ligand in the platinum coordination sphere induce apoptosis in HeLa cervical carcinoma cells.Biochem Pharmacol. 2007 Jun 30;74(1):28-40. doi: 10.1016/j.bcp.2007.03.027. Epub 2007 Mar 31. Biochem Pharmacol. 2007. PMID: 17481588
-
NMR-Based Metabolomics in Metal-Based Drug Research.Molecules. 2019 Jun 15;24(12):2240. doi: 10.3390/molecules24122240. Molecules. 2019. PMID: 31208065 Free PMC article. Review.
Cited by
-
NMR-Based Metabolomic Approach Tracks Potential Serum Biomarkers of Disease Progression in Patients with Type 2 Diabetes Mellitus.J Clin Med. 2019 May 21;8(5):720. doi: 10.3390/jcm8050720. J Clin Med. 2019. PMID: 31117294 Free PMC article.
-
NMR Metabolomics of Primary Ovarian Cancer Cells in Comparison to Established Cisplatin-Resistant and -Sensitive Cell Lines.Cells. 2024 Apr 9;13(8):661. doi: 10.3390/cells13080661. Cells. 2024. PMID: 38667276 Free PMC article.
-
Decitabine-Mediated Upregulation of CSPG4 in Ovarian Carcinoma Cells Enables Targeting by CSPG4-Specific CAR-T Cells.Cancers (Basel). 2022 Oct 14;14(20):5033. doi: 10.3390/cancers14205033. Cancers (Basel). 2022. PMID: 36291817 Free PMC article.
-
Response of Osteosarcoma Cell Metabolism to Platinum and Palladium Chelates as Potential New Drugs.Molecules. 2021 Aug 8;26(16):4805. doi: 10.3390/molecules26164805. Molecules. 2021. PMID: 34443394 Free PMC article.
-
Synthesis and Evaluation of the Cytotoxic Activity of Water-Soluble Cationic Organometallic Complexes of the Type [Pt(η1-C2H4OMe)(L)(Phen)]+ (L = NH3, DMSO; Phen = 1,10-Phenanthroline).Pharmaceutics. 2021 Apr 30;13(5):642. doi: 10.3390/pharmaceutics13050642. Pharmaceutics. 2021. PMID: 33946459 Free PMC article.
References
MeSH terms
Substances
LinkOut - more resources
Full Text Sources
Other Literature Sources
Medical
Miscellaneous
