. 2018 Oct 2;115(7):1264-1280.
doi: 10.1016/j.bpj.2018.07.041. Epub 2018 Aug 23.

Molecular Dynamics Simulations of Kir2.2 Interactions with an Ensemble of Cholesterol Molecules

Affiliations

Molecular Dynamics Simulations of Kir2.2 Interactions with an Ensemble of Cholesterol Molecules

Nicolas Barbera et al. Biophys J. .

Abstract

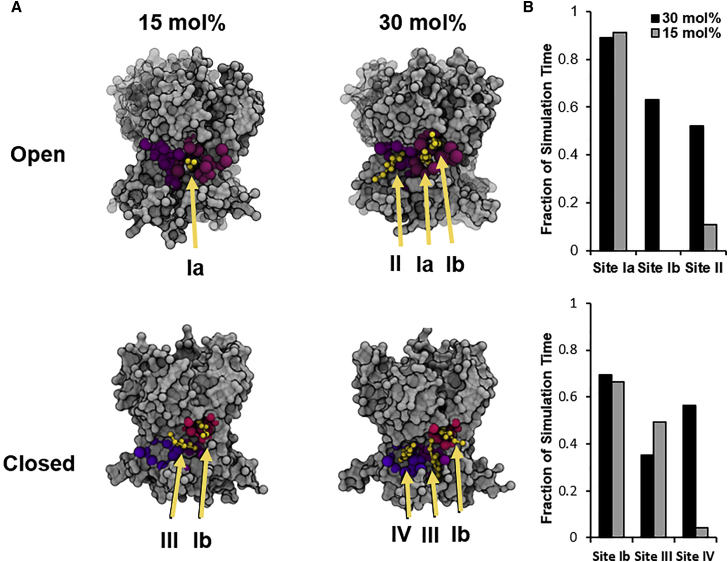
Cholesterol is a major regulator of multiple types of ion channels, but the specific mechanisms and the dynamics of its interactions with the channels are not well understood. Kir2 channels were shown to be sensitive to cholesterol through direct interactions with "cholesterol-sensitive" regions on the channel protein. In this work, we used Martini coarse-grained simulations to analyze the long (μs) timescale dynamics of cholesterol with Kir2.2 channels embedded into a model membrane containing POPC phospholipid with 30 mol% cholesterol. This approach allows us to simulate the dynamic, unbiased migration of cholesterol molecules from the lipid membrane environment to the protein surface of Kir2.2 and explore the favorability of cholesterol interactions at both surface sites and recessed pockets of the channel. We found that the cholesterol environment surrounding Kir channels forms a complex milieu of different short- and long-term interactions, with multiple cholesterol molecules concurrently interacting with the channel. Furthermore, utilizing principles from network theory, we identified four discrete cholesterol-binding sites within the previously identified cholesterol-sensitive region that exist depending on the conformational state of the channel-open or closed. We also discovered that a twofold decrease in the cholesterol level of the membrane, which we found earlier to increase Kir2 activity, results in a site-specific decrease of cholesterol occupancy at these sites in both the open and closed states: cholesterol molecules at the deepest of these discrete sites shows no change in occupancy at different cholesterol levels, whereas the remaining sites showed a marked decrease in occupancy.


Figures

Figure 1
Figure 1
(A) The average number of cholesterol molecules within 6 Å of the channel over time. Dark line represents the average of all simulations. Individual simulations are shown behind in a lighter shade. (B) A representative snapshot of the simulation, showing cholesterol interacting with the lipid bilayer-exposed surface of the channel. (C) A top-down view of the channel in the membrane, with representative 600 ns trajectories of individual cholesterol molecules showing association with and dissociation from the channel. Each separate cholesterol trajectory is colored separately. (D) The average fractional occupancy of each residue in the TM region (Asp60 to Arg190). (E) Visualization of those residues on the channel with a fractional occupancy of 0.5 or greater. Residues corresponding to one individual subunit are highlighted. (F) The average number of cholesterol molecules in contact with 1–15 separate residues simultaneously. To see this figure in color, go online.
Figure 2
Figure 2
Visualization of residues that comprise the upper quartile of contact durations (A), the statistical outliers of maximal occupancy (B), and those residues identified via contact duration that are not maximal occupancy outliers (C). (D) A histogram showing average contact duration for each residue in the TM region (Asp60 to Arg190). (E) A histogram showing average maximal occupancy for each residue in the same region. (F) A plot showing the average number of residue-residue contacts and residue-POPC contacts per nanosecond for residues Asp60 to Arg190. Highlighted residues correspond to those identified in (B; dark circles) and (C; light circles). To see this figure in color, go online.
Figure 3
Figure 3
(A) A bivariate histogram showing the average number of cholesterol molecules per time in contact with x POPC particles and y separate residues. Cholesterol contacts were segregated into cohorts based on the number of separate residues in simultaneous contact with each interacting cholesterol molecule. Within each cohort, the frequency of each unique residue was calculated, represented as a percentage of total contacts. Examples of these are shown for (B) a histogram of residue contacts for the 11-residue cohort and (C) a histogram of residue contacts for the four-residue cohort. The frequency of each residue cohort was also calculated. The average number of events observed in a 20 μs simulation for each cohort is shown in (D). (E) The average interaction time of each residue cohort is shown in a bar plot on the left. On the right is a boxplot showing interaction times for cohorts 1–8 and cohorts >9. To see this figure in color, go online.
Figure 4
Figure 4
(A) The average number of cholesterol molecules found to be within 6 Å of the channel over time in simulations containing 15 mol% cholesterol. Dark line represents the average of the simulations. Individual simulations are shown behind in a lighter shade. (B) Bivariate histograms, showing the average number of cholesterol molecules per time in contact with x POPC particles and y separate residues. The top histogram is of simulations containing 30 mol% cholesterol, and the bottom histogram is of simulations containing 15 mol% cholesterol. (C) A two-dimensional (2D) plot of the χ2 distances calculated for each pair of residue cohorts at 15 and 30 mol%. (D) Boxplots showing the interaction times of cohorts >9 (left) and 1–8 (right) for 30 and 15 mol%. To see this figure in color, go online.
Figure 5
Figure 5
Network representations of two separate cholesterol-binding events (A and B). Nodes are sized according to total contact time, and edges between nodes are sized according to the corresponding correlation coefficient. (C) A 2D plot of the ϕ coefficient for each pair of binding events, representing the similarity in identified residues. (D) A plot showing the correlations between events with a p-value < 0.05. (E) A visualization of site I and site II. Their shared residue, Ile171, is indicated. (F) A closeup of site I. Subsites Ia and Ib are indicated, as are their shared residues. To see this figure in color, go online.
Figure 6
Figure 6
Network representations of two separate cholesterol-binding events. (A and B) Nodes are sized according to total contact time, and edges between nodes are sized according to the corresponding correlation coefficient. (C) A 2D plot of the ϕ coefficient for each pair of binding events, representing the similarity in identified residues. (D) A plot showing the correlations between events with a p-value < 0.05. (E) A visualization of site Ib, site III, and site IV. Their shared residues, Met70, Phe71, and Phe175, are indicated. (F) A closeup of sites III and IV, indicating their shared residues. To see this figure in color, go online.
Figure 7
Figure 7
Visualizations of (A) site Ia on the open channel and the analogous (B) site III on the closed channel and (C) site II on the open channel and the analogous (D) site IV on the closed channel. To see this figure in color, go online.
Figure 8
Figure 8
(A) Representative snapshots of the TM domains of Kir2.2open in a 15 mol% cholesterol simulation, with cholesterol only occupying site Ia (top left); Kir2.2open in a 30 mol% cholesterol simulation, with cholesterol occupying sites Ia, Ib, and II (top right); Kir2.2closed in a 15 mol% cholesterol simulation, with cholesterol occupying sites Ib and III (bottom left); and Kir2.2closed in a 30 mol% cholesterol simulation, with cholesterol occupying sites Ib, III, and IV (bottom right). The rest of the protein and the membrane lipids are hidden for clarity. (B) Bar plots of the percentage of simulation time cholesterol occupies sites Ia, Ib, and II at 30 and 15 mol% in the open-state simulations (top) and of the percentage of simulation time cholesterol occupies sites Ib, III, and IV at 30 and 15 mol% in the closed-state simulations (bottom). To see this figure in color, go online.

References

    1. Rosenhouse-Dantsker A., Mehta D., Levitan I. Regulation of ion channels by membrane lipids. Compr. Physiol. 2012;2:31–68. - PubMed
    1. Fantini J., Barrantes F.J. How cholesterol interacts with membrane proteins: an exploration of cholesterol-binding sites including CRAC, CARC, and tilted domains. Front. Physiol. 2013;4:31. - PMC - PubMed
    1. Levitan I., Singh D.K., Rosenhouse-Dantsker A. Cholesterol binding to ion channels. Front. Physiol. 2014;5:65. - PMC - PubMed
    1. Romanenko V.G., Rothblat G.H., Levitan I. Modulation of endothelial inward-rectifier K+ current by optical isomers of cholesterol. Biophys. J. 2002;83:3211–3222. - PMC - PubMed
    1. Addona G.H., Sandermann H., Jr., Miller K.W. Low chemical specificity of the nicotinic acetylcholine receptor sterol activation site. Biochim. Biophys. Acta. 2003;1609:177–182. - PubMed

Publication types

MeSH terms