. 2018 Dec;178(4):1436-1447.
doi: 10.1104/pp.18.00474. Epub 2018 Sep 11.

MAPINS, a Highly Efficient Detection Method That Identifies Insertional Mutations and Complex DNA Rearrangements

Affiliations

MAPINS, a Highly Efficient Detection Method That Identifies Insertional Mutations and Complex DNA Rearrangements

Huawen Lin et al. Plant Physiol. 2018 Dec.

Abstract

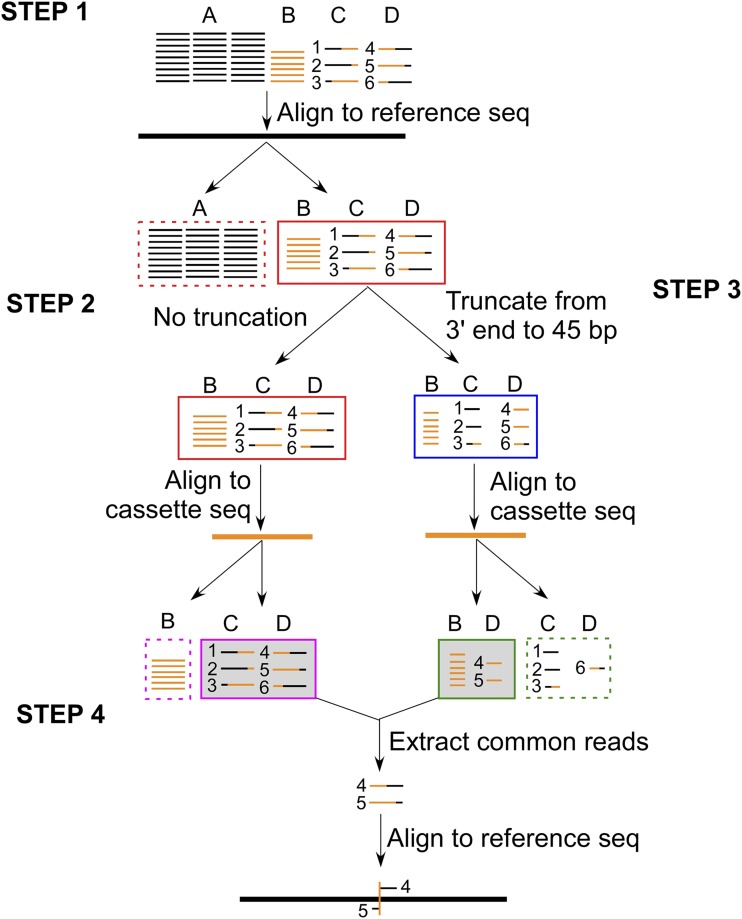
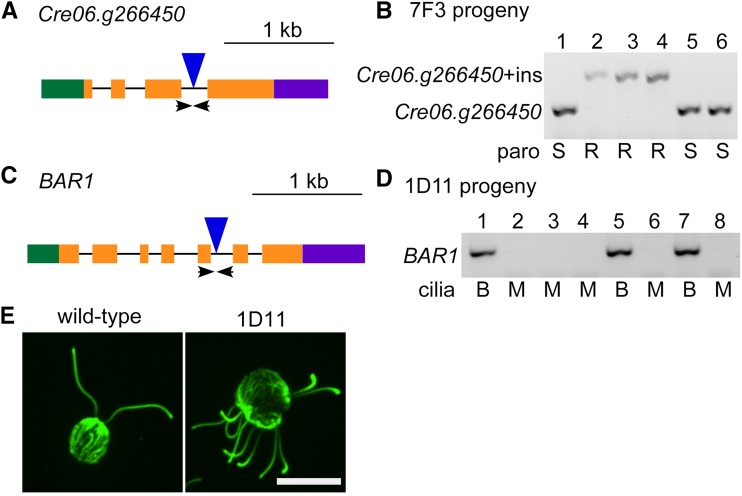
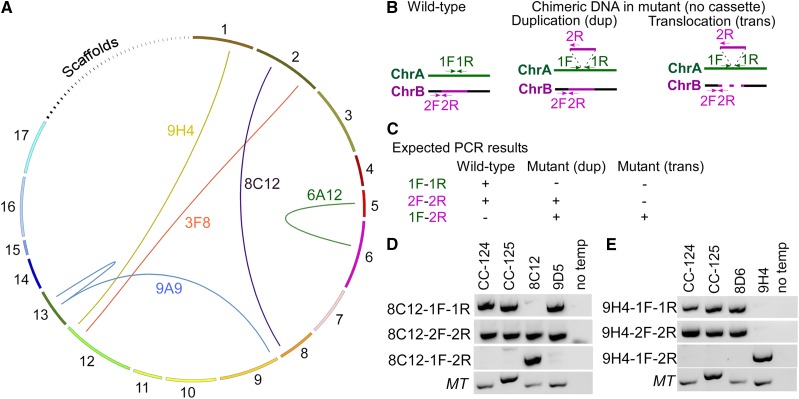
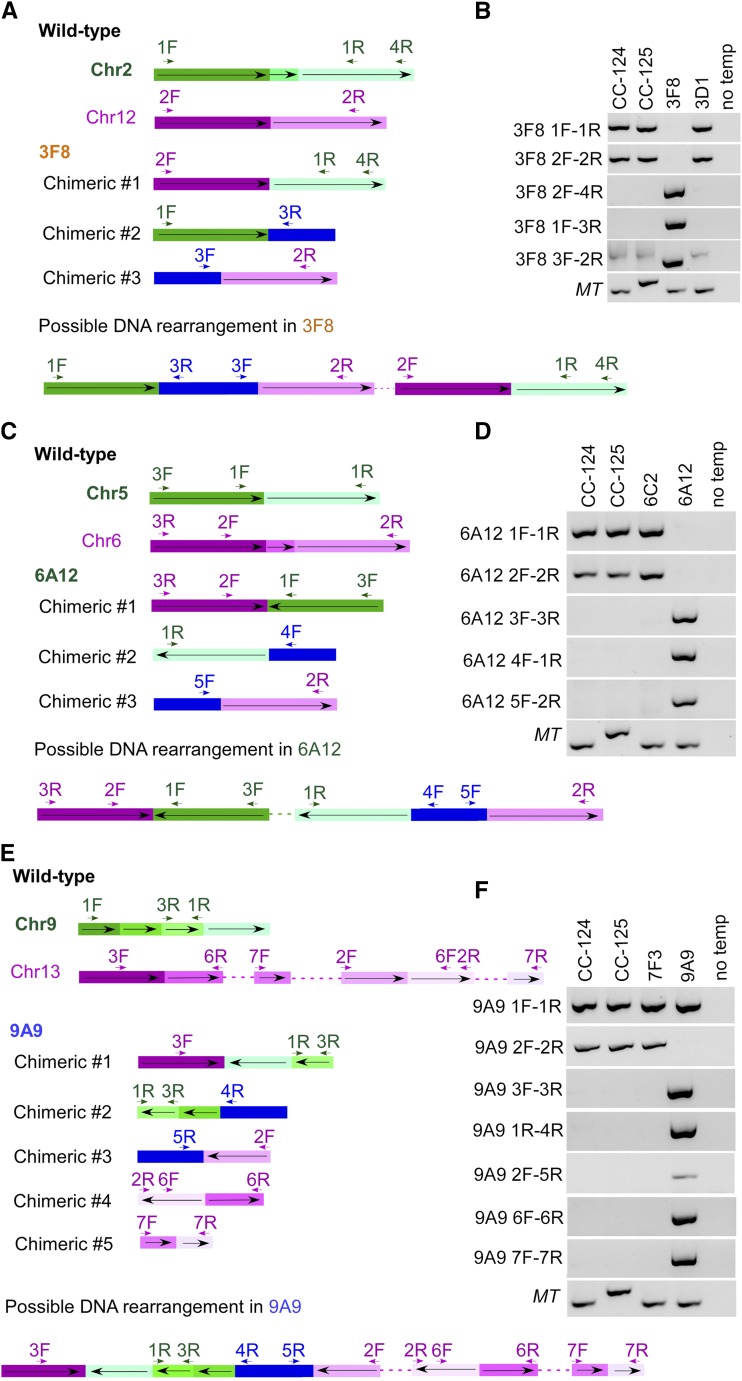
Insertional mutagenesis, in which a piece of exogenous DNA is integrated randomly into the genomic DNA of the recipient cell, is a useful method to generate new mutants with phenotypes of interest. The unicellular green alga Chlamydomonas reinhardtii is an outstanding model for studying many biological processes. We developed a new computational algorithm, MAPINS (mapping insertions), to efficiently identify insertion sites created by the integration of an APHVIII (aminoglycoside 3'-phosphotransferase VIII) cassette that confers paromomycin resistance. Using whole-genome sequencing data, this method eliminates the need for genomic DNA manipulation and retains all the sequencing information provided by paired-end sequencing. We experimentally verified 38 insertion sites out of 41 sites (93%) identified by MAPINS from 20 paromomycin-resistant strains. Using meiotic analysis of 18 of these strains, we identified insertion sites that completely cosegregate with paromomycin resistance. In six of the seven strains with a mutant phenotype, we demonstrated complete cosegregation of the mutant phenotype and the verified insertion site. In addition, we provide direct evidence of complex rearrangements of genomic DNA in five strains, three of which involve the APHVIII insertion site. We suggest that strains obtained by insertional mutagenesis are more complicated than expected from previous analyses in Chlamydomonas To map the locations of some complex insertions, we designed 49 molecular markers based on differences identified via whole-genome sequencing between wild-type strains CC-124 and CC-125. Overall, MAPINS provides a low-cost, efficient method to characterize insertional mutants in Chlamydomonas.


Figures

Figure 1.
Figure 1.
MAPINS identifies flanking genomic DNA sequences around insertion sites. Paired-end 101-bp reads are composed of four different groups. They are reads completely aligned to the Chlamydomonas genome (A, black thin lines); reads completely aligned to the cassette sequence (B, orange thin lines); and reads that are chimeric between Chlamydomonas genomic sequences and the cassette sequence (C and D, mixed black-orange lines). All reads in C have the Chlamydomonas sequence at the 5′ end, and all reads in D have the cassette sequence at the 5′ end. Reads #1 to #6 represent different patterns of chimeric DNA from the 5′ to 3′ end. Step 1, All reads are first aligned to the Chlamydomonas reference genome (black thick line), and all completely aligned reads (group A) are discarded (red dashed box). Two parallel analyses are performed for the remaining reads (groups B, C, and D; red solid box) in steps 2 and 3. Step 2, They are aligned to the cassette sequence (orange thick lines), and all completely aligned reads (group B) are discarded (magenta dashed box). Reads in groups C and D are retained (magenta solid shaded box). Step 3, They are truncated from the 3′ end to 45 bp long in length. These 45-bp reads are aligned to the cassette DNA sequence. Reads that aligned completely (group B and some reads [#4 and #5] in group D) are retained (green solid shaded box). Reads that are not aligned completely are discarded (green dashed box). Step 4, Reads retained from steps 2 (magenta solid box) and 3 (green solid box) are compared. Common retained reads (#4 and #5 in group D) are extracted, and the full-length reads are realigned to the Chlamydomonas reference genome. Breakpoints in these reads define the cassette insertion site (orange vertical line) in the genome.
Figure 2.
Figure 2.
Cosegregation of PCR-validated insertion sites, paroR, and the mutant phenotype. A, Gene structure of the Cre06.g266450 gene. Green box, 5′ Untranslated region (UTR); orange boxes, exons; black lines, introns; purple box, 3′ UTR; blue triangle, insertion site of the cassette; arrows, positions of the primers used in B. The lengths of the blue triangle and arrows are not drawn to scale. B, Insertion of a truncated cassette allows PCR amplification in both mutant and wild-type cells. In six progeny from an octad between 7F3 and CC-125, the primers flanking the Cre06.g266450 insertion sites amplify two different PCR products. In this octad, resistance (R) to paromomycin cosegregates with the larger band (Cre06.g266450+ins [insert]) and sensitivity (S) to paromomycin cosegregates with the smaller band (Cre06.g266450). C, Gene structure of the BAR1 gene. Arrows indicate the positions of the primers used in D. The lengths of the blue triangle and arrows are not drawn to scale. D, The multiciliary phenotype in 1D11 always cosegregates with the insertion in BAR1, as shown in eight random progeny. The absence of a PCR product cosegregates with multiciliary cells (M) and the presence of a PCR product is always found in biciliary cells (B). E, The 1D11 mutant assembles multiple cilia. An antibody to α-tubulin (green) stains cilia protruding outside the round cell body. Bar = 10 µm.
Figure 3.
Figure 3.
Complex DNA rearrangements in multiple insertional strains. A, Diagram of chimeric DNA formed across different chromosomes in five strains (yellow, 9H4; red, 3F8; purple, 8C12; green, 6A12; blue, 9A9). The ends of the arcs indicate the junction sites. Chromosomes 1 to 17 and scaffolds 18 to 54 are drawn to scale in a clockwise direction. B, Positions of the primers in the wild type and in the mutant that form chimeric DNA due to DNA duplication or DNA translocation. Expectations for events on two different chromosomes (A, green; B, magenta) are shown. We assume that the insertion happens on chromosome A and the inserted DNA originates from chromosome B. C, Expected outcome of PCR products from the wild type and mutants with different combinations of primers. D, PCR of wild-type fragments (1F-1R on chromosome 2, 2F-2R on chromosome 8) and a chimeric DNA fragment (1F-2R) in the wild type (CC-124 and CC-125), 8C12, and 9D5. Primers for the mating-type loci (MT, including the MTA1 and MTD1 genes) are included as loading controls. No temp indicates that no DNA template was added to the PCR. E, PCR of wild-type fragments (1F-1R on chromosome 1, 2F-2R on chromosome 12) and a chimeric DNA fragment (1F-2R) in the wild type (CC-124 and CC-125), 8D6, and 9H4.
Figure 4.
Figure 4.
Complex DNA rearrangement adjacent to the APHVIII cassette. A, Diagram of events in 3F8 involving chromosome 2 (green) and chromosome 12 (magenta) in the wild type, chimeric DNA between chromosomes 2 and 12 (#1), between chromosome 2 and the APHVIII cassette (blue; #2), and between chromosome 12 and the APHVIII cassette (#3). The positions of the primers used in B along the chromosomes and the cassette are indicated by short arrows. The orientation of the DNA fragments along the wild-type chromosome (from small to large coordinates) is indicated by long arrows. The diagram is not drawn to scale. A possible DNA rearrangement event in 3F8 is indicated at the bottom. The dashed line indicates the undetermined composition of DNA. B, PCR amplification of multiple DNA fragments in the wild type (CC-124 and CC-125), 3F8, and 3D1. No temp indicates that no DNA template was added to the PCR. C, Diagram of events in 6A12 involving chromosome 5 (green) and chromosome 6 (magenta) in the wild type, chimeric DNA between chromosomes 5 and 6 (#1), between chromosome 5 and the APHVIII cassette (#2), and between chromosome 6 and the APHVIII cassette (#3). The positions of the primers used in D along the chromosomes and the cassette are indicated by short arrows. The orientation of the DNA fragments along the wild-type chromosome (from small to large coordinates) is indicated by long arrows. The diagram is not drawn to scale. A possible DNA rearrangement event in 6A12 is indicated at the bottom. The dashed line indicates the undetermined composition of DNA. D, PCR amplification of multiple DNA fragments in the wild type (CC-124 and CC-125), 6C2, and 6A12. No temp indicates that no DNA template was added to the PCR. E, Diagram of events in 9A9 involving chromosome 9 (green) and chromosome 13 (magenta) in the wild type, chimeric DNA between chromosomes 9 and 13 (#1), between chromosome 9 and the APHVIII cassette (#2), between chromosome 13 and the APHVIII cassette (#3), and between regions of chromosome 13 (#4 and #5). The positions of the primers used in F along the chromosomes and the cassette are indicated by short arrows. The orientation of the DNA fragments along the wild-type chromosome (from small to large coordinates) is indicated by long arrows. The diagram is not drawn to scale. A possible DNA rearrangement event in 9A9 is indicated at the bottom. The dashed line indicates the undetermined composition of DNA. F, PCR amplification of multiple DNA fragments in the wild type (CC-124 and CC-125), 7F3, and 9A9. No temp indicates that no DNA template was added to the PCR.
Figure 5.
Figure 5.
Distribution of 49 new molecular markers for meiotic mapping. Newly designed molecular markers and their positions along different chromosomes are indicated by magenta vertical lines. Their positions along the chromosomes in version 5.5 are indicated above the line. One marker, which maps to both chromosome 12: 5.68 Mb and chromosome 16: 1.21 Mb, is indicated as light blue vertical lines. A subset of previously defined genes used in meiotic mapping is indicated by black vertical lines. Centromeres on each chromosome are indicated as green circles as mapped in Supplemental Table S5. We did not identify centromeres on chromosome 11 or 15.

Similar articles

Cited by

References

    1. Alonso JM, Stepanova AN, Leisse TJ, Kim CJ, Chen H, Shinn P, Stevenson DK, Zimmerman J, Barajas P, Cheuk R, et al. (2003) Genome-wide insertional mutagenesis of Arabidopsis thaliana. Science 301: 653–657 - PubMed
    1. Bowers AK, Keller JA, Dutcher SK (2003) Molecular markers for rapidly identifying candidate genes in Chlamydomonas reinhardtii: ery1 and ery2 encode chloroplast ribosomal proteins. Genetics 164: 1345–1353 - PMC - PubMed
    1. Cheng X, Liu G, Ke W, Zhao L, Lv B, Ma X, Xu N, Xia X, Deng X, Zheng C, et al. (2017) Building a multipurpose insertional mutant library for forward and reverse genetics in Chlamydomonas. Plant Methods 13: 36. - PMC - PubMed
    1. Cross FR, Breker M, Lieberman K (2017) Validated Bayesian differentiation of causative and passenger mutations. G3 (Bethesda) 7: 2081–2094 - PMC - PubMed
    1. Dent RM, Haglund CM, Chin BL, Kobayashi MC, Niyogi KK (2005) Functional genomics of eukaryotic photosynthesis using insertional mutagenesis of Chlamydomonas reinhardtii. Plant Physiol 137: 545–556 - PMC - PubMed

Publication types

MeSH terms

LinkOut - more resources