

Developmental phosphoproteomics identifies the kinase CK2 as a driver of Hedgehog signaling and a therapeutic target in medulloblastoma
- PMID: 30206138
- PMCID: PMC6475502
- DOI: 10.1126/scisignal.aau5147
Developmental phosphoproteomics identifies the kinase CK2 as a driver of Hedgehog signaling and a therapeutic target in medulloblastoma
Abstract
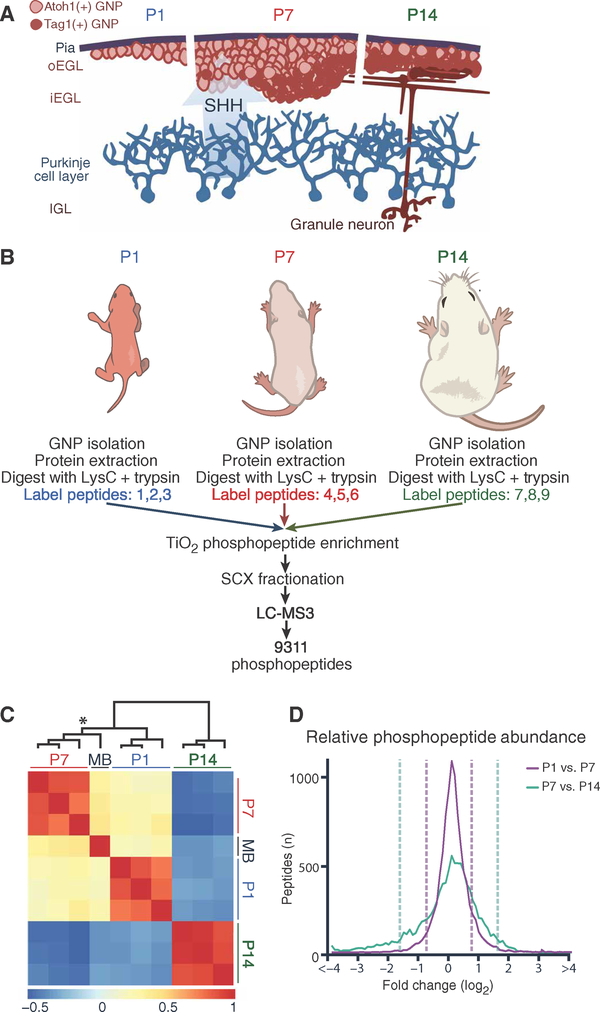
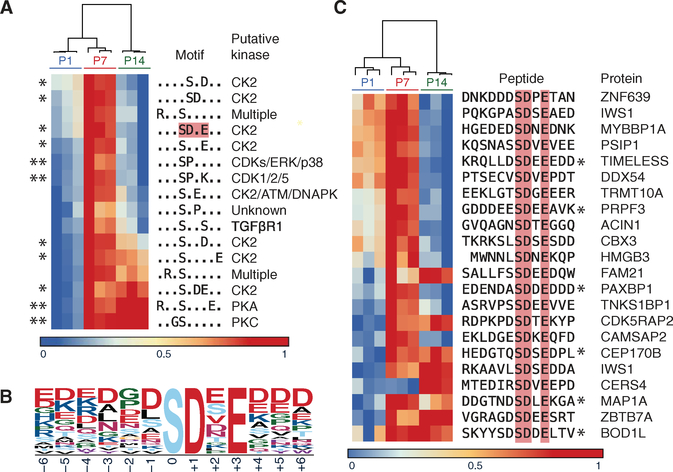
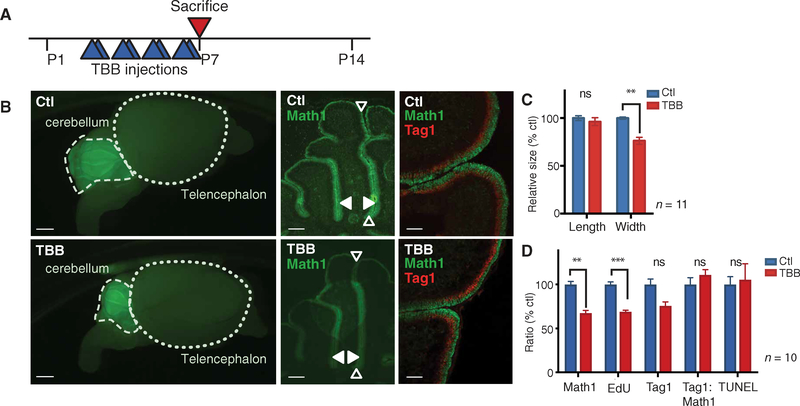
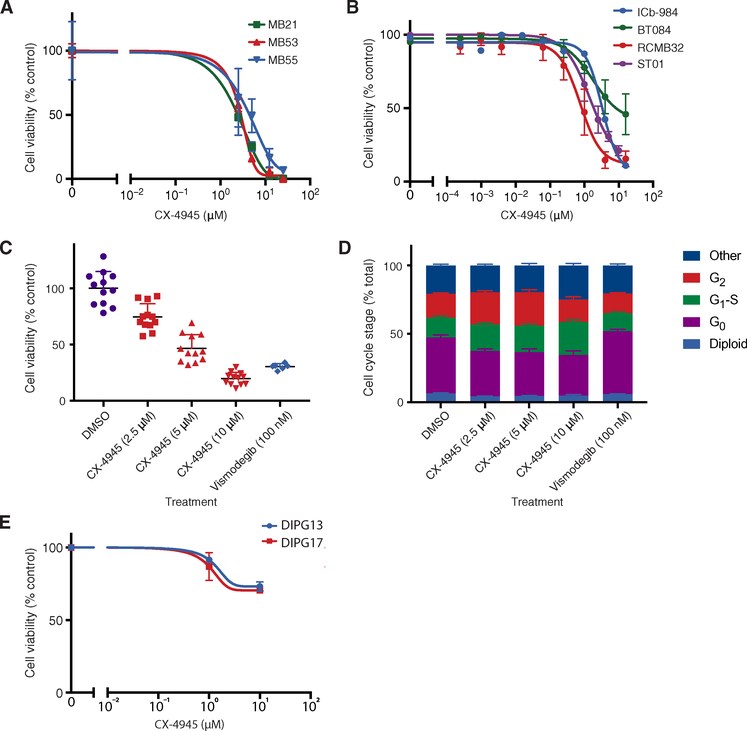
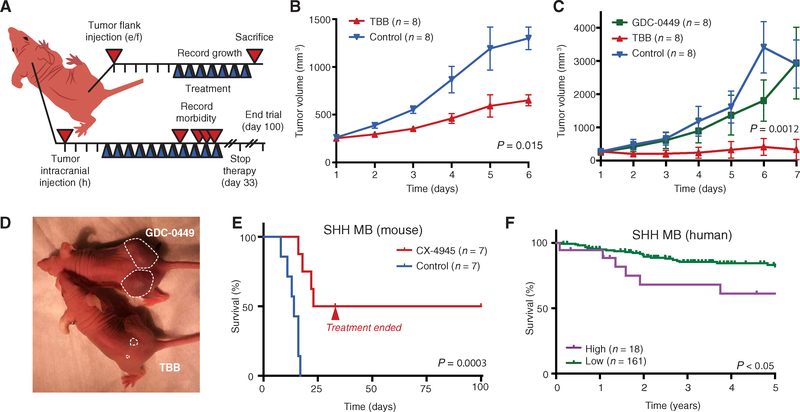
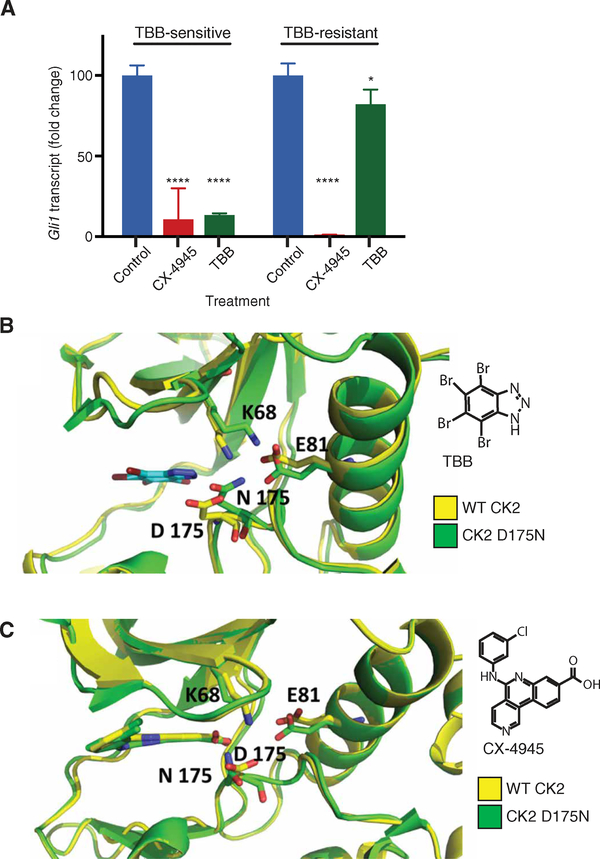
A major limitation of targeted cancer therapy is the rapid emergence of drug resistance, which often arises through mutations at or downstream of the drug target or through intrinsic resistance of subpopulations of tumor cells. Medulloblastoma (MB), the most common pediatric brain tumor, is no exception, and MBs that are driven by sonic hedgehog (SHH) signaling are particularly aggressive and drug-resistant. To find new drug targets and therapeutics for MB that may be less susceptible to common resistance mechanisms, we used a developmental phosphoproteomics approach in murine granule neuron precursors (GNPs), the developmental cell of origin of MB. The protein kinase CK2 emerged as a driver of hundreds of phosphorylation events during the proliferative, MB-like stage of GNP growth, including the phosphorylation of three of the eight proteins commonly amplified in MB. CK2 was critical to the stabilization and activity of the transcription factor GLI2, a late downstream effector in SHH signaling. CK2 inhibitors decreased the viability of primary SHH-type MB patient cells in culture and blocked the growth of murine MB tumors that were resistant to currently available Hh inhibitors, thereby extending the survival of tumor-bearing mice. Because of structural interactions, one CK2 inhibitor (CX-4945) inhibited both wild-type and mutant CK2, indicating that this drug may avoid at least one common mode of acquired resistance. These findings suggest that CK2 inhibitors may be effective for treating patients with MB and show how phosphoproteomics may be used to gain insight into developmental biology and pathology.
Copyright © 2018 The Authors, some rights reserved; exclusive licensee American Association for the Advancement of Science. No claim to original U.S. Government Works.
Conflict of interest statement
Figures

Similar articles
-
Phosphoproteomics of short-term hedgehog signaling in human medulloblastoma cells.Cell Commun Signal. 2020 Jun 23;18(1):99. doi: 10.1186/s12964-020-00591-0. Cell Commun Signal. 2020. PMID: 32576205 Free PMC article.
-
Survivin as a therapeutic target in Sonic hedgehog-driven medulloblastoma.Oncogene. 2015 Jul;34(29):3770-9. doi: 10.1038/onc.2014.304. Epub 2014 Sep 22. Oncogene. 2015. PMID: 25241898 Free PMC article.
-
Targeting AKT and CK2 represents a novel therapeutic strategy for SMO constitutive activation-driven medulloblastoma.CNS Neurosci Ther. 2022 Jul;28(7):1033-1044. doi: 10.1111/cns.13835. Epub 2022 Apr 14. CNS Neurosci Ther. 2022. PMID: 35419951 Free PMC article.
-
Phase I and phase II sonidegib and vismodegib clinical trials for the treatment of paediatric and adult MB patients: a systemic review and meta-analysis.Acta Neuropathol Commun. 2019 Jul 30;7(1):123. doi: 10.1186/s40478-019-0773-8. Acta Neuropathol Commun. 2019. PMID: 31362788 Free PMC article.
-
SHH inhibitors for the treatment of medulloblastoma.Expert Rev Neurother. 2015;15(7):763-70. doi: 10.1586/14737175.2015.1052796. Epub 2015 May 31. Expert Rev Neurother. 2015. PMID: 26027634 Review.
Cited by
-
Hedgehog signaling mechanism and role in cancer.Semin Cancer Biol. 2022 Oct;85:107-122. doi: 10.1016/j.semcancer.2021.04.003. Epub 2021 Apr 6. Semin Cancer Biol. 2022. PMID: 33836254 Free PMC article. Review.
-
LC-MS/MS method for quantitation of the CK2 inhibitor silmitasertib (CX-4945) in human plasma, CSF, and brain tissue, and application to a clinical pharmacokinetic study in children with brain tumors.J Chromatogr B Analyt Technol Biomed Life Sci. 2020 Sep 1;1152:122254. doi: 10.1016/j.jchromb.2020.122254. Epub 2020 Jun 23. J Chromatogr B Analyt Technol Biomed Life Sci. 2020. PMID: 32615532 Free PMC article. Clinical Trial.
-
A Holistic Review on the Current and Future Status of Biology-Driven and Broad-Spectrum Therapeutic Options for Medulloblastoma.Cureus. 2022 Mar 24;14(3):e23447. doi: 10.7759/cureus.23447. eCollection 2022 Mar. Cureus. 2022. PMID: 35481313 Free PMC article. Review.
-
Role of Protein Kinases in Hedgehog Pathway Control and Implications for Cancer Therapy.Cancers (Basel). 2019 Mar 29;11(4):449. doi: 10.3390/cancers11040449. Cancers (Basel). 2019. PMID: 30934935 Free PMC article. Review.
-
Functional Precision Medicine Identifies New Therapeutic Candidates for Medulloblastoma.Cancer Res. 2020 Dec 1;80(23):5393-5407. doi: 10.1158/0008-5472.CAN-20-1655. Epub 2020 Oct 12. Cancer Res. 2020. PMID: 33046443 Free PMC article.
References
-
- Zurawel RH, Allen C, Wechsler-Reya R, Scott MP, Raffel C, Evidence that haploinsufficiency of Ptch leads to medulloblastoma in mice. Genes Chromosomes Cancer 28, 77–81 (2000). - PubMed
-
- Wechsler-Reya RJ, Scott MP, Control of neuronal precursor proliferation in the cerebellum by Sonic hedgehog. Neuron 22, 103–114 (1999). - PubMed
-
- Taylor MD, Northcott PA, Korshunov A, Remke M, Cho Y-J, Clifford SC, Eberhart CG, Parsons DW, Rutkowski S, Gajjar A, Ellison DW, Lichter P, Gilbertson RJ, Pomeroy SL, Kool M, Pfister SM, Molecular subgroups of medulloblastoma: The current consensus. Acta Neuropathol. 123, 465–472 (2012). - PMC - PubMed
Publication types
MeSH terms
Substances
Grants and funding
LinkOut - more resources
Full Text Sources
Other Literature Sources
Molecular Biology Databases
Miscellaneous
