

SCA8 RAN polySer protein preferentially accumulates in white matter regions and is regulated by eIF3F
- PMID: 30206144
- PMCID: PMC6166133
- DOI: 10.15252/embj.201899023
SCA8 RAN polySer protein preferentially accumulates in white matter regions and is regulated by eIF3F
Abstract
Spinocerebellar ataxia type 8 (SCA8) is caused by a bidirectionally transcribed CTG·CAG expansion that results in the in vivo accumulation of CUG RNA foci, an ATG-initiated polyGln and a polyAla protein expressed by repeat-associated non-ATG (RAN) translation. Although RAN proteins have been reported in a growing number of diseases, the mechanisms and role of RAN translation in disease are poorly understood. We report a novel toxic SCA8 polySer protein which accumulates in white matter (WM) regions as aggregates that increase with age and disease severity. WM regions with polySer aggregates show demyelination and axonal degeneration in SCA8 human and mouse brains. Additionally, knockdown of the eukaryotic translation initiation factor eIF3F in cells reduces steady-state levels of SCA8 polySer and other RAN proteins. Taken together, these data show polySer and WM abnormalities contribute to SCA8 and identify eIF3F as a novel modulator of RAN protein accumulation.
Keywords: RAN translation; eIF3F; polyserine; spinocerebellar ataxia type 8 (SCA8); white matter.
© 2018 The Authors.
Figures
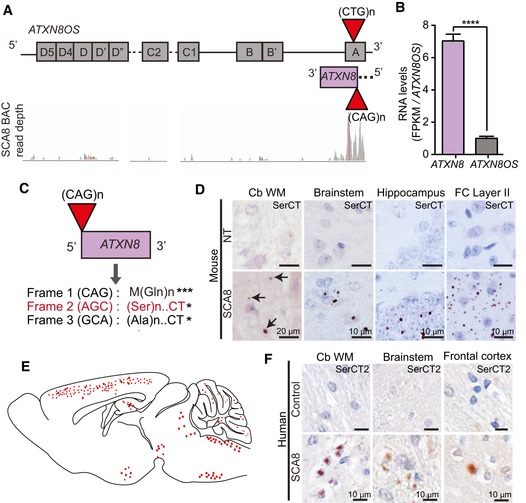
Schematic diagram of ATXN8OS (top strand) and ATXN8 (bottom strand). RNA‐Seq read coverage visualized by Integrative Genomic Viewer across the ATXN8/ATXN8OS locus is depicted.
Bar graph showing relative mRNA levels of ATXN8 and ATXN8OS. FPKM values for each transcript are normalized to FPKM value for ATXN8OS. (****P < 0.0001; mean ± SEM; unpaired t‐test) FPKM, fragments per kilo base of transcript per million mapped reads.
Known and predicted homopolymeric protein expressed across SCA8 CAG expansion (ATXN8) transcripts. * Represent stop codons.
Immunohistochemistry of 10‐ to 12‐month‐old end‐stage SCA8 BAC mice brain tissue shows accumulation of novel polySer RAN protein (detected by unique antibody to the polySer protein C terminus, α‐SerCT) in cerebellar white matter, brainstem, hippocampus, and layer II of the frontal cortex. Representative polySer aggregates are indicated by black arrows. No aggregates are found in age‐matched non‐transgenic (NT) littermates (n = 6 for each cohort).
Schematic of a sagittal section of mouse brain shows the distribution of polySer RAN protein in SCA8 BAC expansion mice. Red circles represent variable size and frequency of polySer aggregates throughout different brain regions.
Immunohistochemistry of human SCA8 autopsy tissue (n = 4–7) shows accumulation of novel polySer RAN protein in cerebellar white matter, brainstem, and frontal cortex.
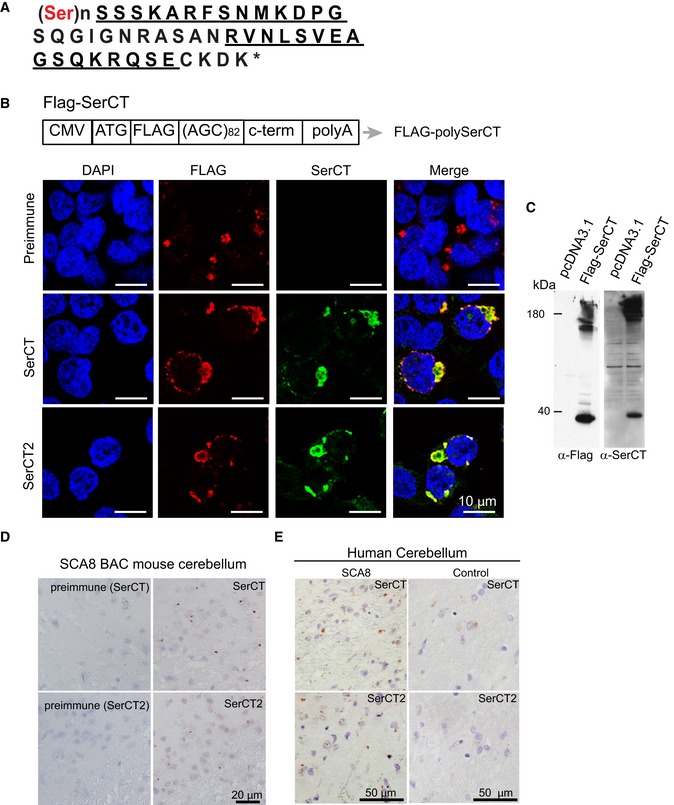
Amino acid sequence of predicted polySer RAN protein with the unique C terminus. Peptide sequences used to generate rabbit polyclonal antibodies are underlined.
Schematic diagram of FLAG‐SerCT construct expressing an ATG‐initiated N‐terminal FLAG‐tagged polySer expansion protein followed by its endogenous C‐terminal sequence. Co‐localization of immunofluorescence (IF) staining using α‐FLAG (red) and α‐SerCT and α‐SerCT2 (green) in HEK293T cells transfected with FLAG‐SerCT but not preimmune serum.
Immunoblots showing detection of recombinant polySer protein using α‐FLAG (left) and α‐SerCT (right) in the lysates of HEK293T cells transfected with FLAG‐SerCT (second lanes) but not pcDNA3.1 (first lanes).
Immunochemistry of SCA8 mouse brain using α‐SerCT and α‐SerCT2 (left panels) antibodies shows similar punctate aggregates. Aggregates are not detected with respective preimmune sera (right panels).
Immunochemistry using both α‐SerCT and α‐SerCT2 detect similar aggregates in SCA8 human autopsy tissue but not control cerebellum.
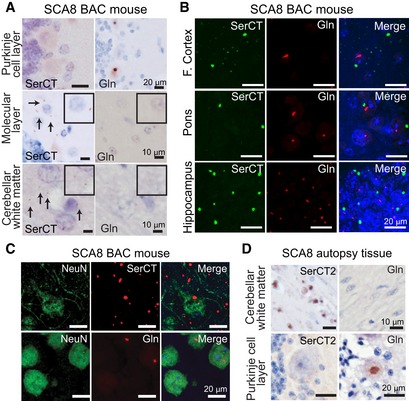
Immunohistochemistry (IHC) of end‐stage SCA8 BAC mouse cerebellum shows that polySer but not polyGln is found in the molecular layer and cerebellar white matter and that polyGln but not polySer accumulates in Purkinje cells. Representative polySer aggregates are indicated by black arrows. Inset: higher magnification of molecular layer and white matter.
IF double staining shows no co‐localization of polyGln and polySer in frontal cortex, pons, or hippocampus of end‐stage SCA8 BAC mice.
IF double staining of end‐stage SCA8 BAC frontal cortex shows exclusive localization of polyGln (mouse α‐Gln, red, bottom panel) in neurons (rabbit α‐NeuN, green, bottom panel). In contrast, polySer (Rabbit α‐SerCT, red, top panel) shows widespread accumulation in the frontal cortex including within neurons (mouse α‐NeuN, green, top panel).
IHC of SCA8 human cerebellum shows that polySer accumulates in the white matter but not in the Purkinje cells (left panels), while polyGln accumulates in Purkinje cells but not cerebellar white matter (right panels).
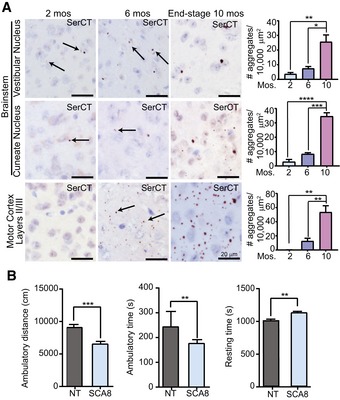
Representative images of the vestibular nucleus (upper panels), cuneate nucleus (middle panels), and motor cortex layers II/III (lower panels) of SCA8 BAC mice at 2 months (left panels), 6 months (middle panels), and end‐stage (10 months, right panels) stained with α‐SerCT. Representative aggregates are indicated by black arrows. Corresponding quantifications of polySer aggregates for each region on the right (n = 3; mean ± SEM; one‐way ANOVA with Tukey's post hoc test; *P < 0.025, **P < 0.005, ***P < 0.0005, ****P < 0.0001)
Open field analysis of 2‐month‐old animals shows a significant decrease in ambulatory distance (cm) and ambulatory time (s) and a significant increase in resting time (s) (NT n = 19, SCA8 BAC n = 23, **P < 0.01, ***P < 0.001; mean ± SEM; unpaired t‐test).
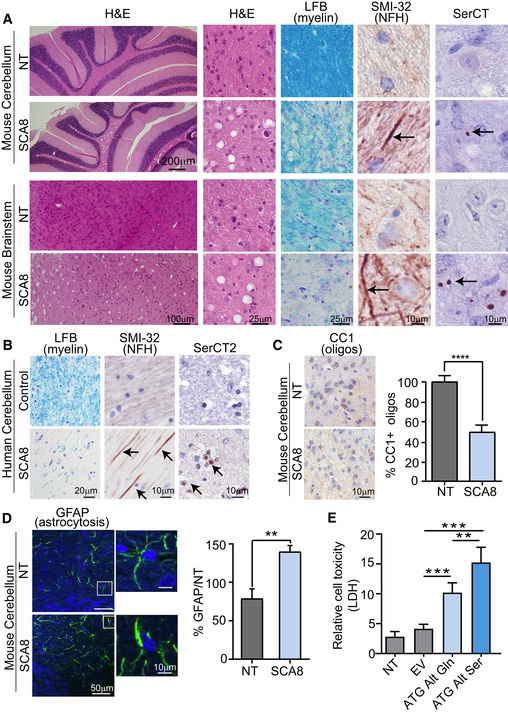
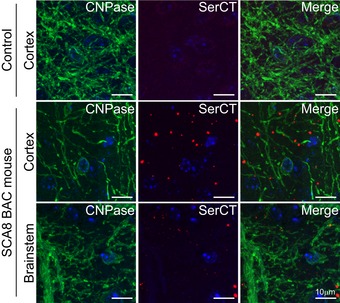
Disease‐specific sensitivity to vacuolization after prolonged storage in ethanol shown by H&E in cerebellar white matter and brainstem of 10‐ to 12‐month‐old end‐stage SCA8 BAC mice but not in age‐matched NT controls (n = 3) (panels 1&2). Demyelination shown by luxol fast blue staining (LFB) (panel 3) and axonal degeneration shown by α‐SMI‐32 (panel 4; degenerated axons are indicated by black arrows) observed in sites of polySer accumulation shown by α‐SerCT (panel 5; representative aggregates are indicated by black arrows) in deep cerebellar white matter and brainstem in SCA8 BAC mice (lower panels) but not in NT mice (upper panels) (n = 3).
Demyelination shown by luxol fast blue staining (LFB) (panel 1) and axonal degeneration shown by α‐SMI‐32 (panel 2) observed sites of polySer accumulation shown by α‐SerCT2 (panel 3) in deep cerebellar white matter was found in SCA8 autopsy tissue but not in control brains (n = 3).
Immunohistochemistry using CC1 (α‐APC) antibody shows significantly lower numbers of mature oligodendrocytes in SCA8 BAC mice compared to NT mice (NT n = 5, SCA8 BAC n = 5; **** P < 0.0001; mean ± SEM; unpaired t‐test).
Immunofluorescence using α‐GFAP antibody shows significant increase in astrogliosis in SCA8 BAC mice compared to NT mice (NT n = 3, SCA8 BAC n = 3, **P < 0.01; mean ± SEM; unpaired t‐test).
Cell death measured by lactase dehydrogenase (LDH) assay in T98 cells transfected with codon replacement constructs expressing polyGln (light blue) or polySer (dark blue). NT, nontransfected; EV, empty vector (n = 5, **P < 0.003; ***P < 0.0003; mean ± SEM; unpaired t‐test).
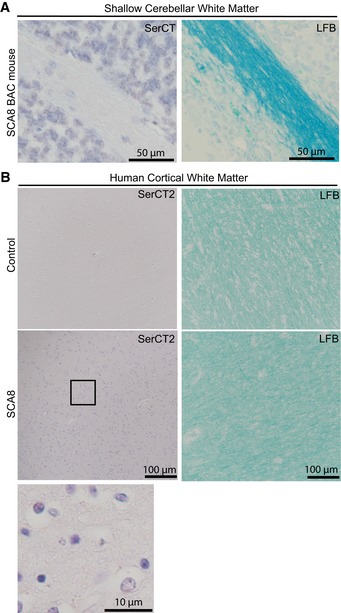
White matter integrity visualized by luxol fast blue (LFB) staining (right) and polySer aggregates detected by α‐SerCT antibody (left).
White matter integrity visualized by luxol fast blue (LFB) staining (right) and polySer aggregates detected by α‐SerCT2 antibody (left) in control (top) and SCA8 (bottom and enlarged panel) human autopsy tissue.
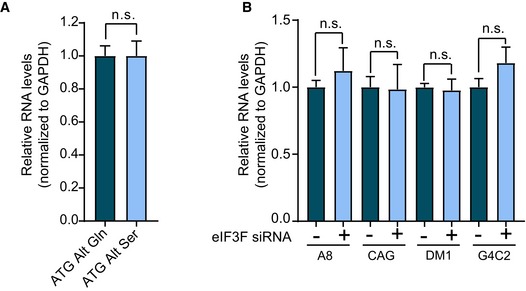
Bar graph showing relative minigene expression measured by qRT–PCR in cells transfected with the codon replacement constructs expressing polyGln (dark blue) or polySer (light blue; n = 5, n.s. no significance; mean ± SEM; unpaired t‐test).
Bar graph showing relative minigene expression measured by qRT–PCR in cells co‐transfected with the various repeat expansion and control (dark blue) or eIF3F (light blue) targeting siRNA (n = 5; n.s. no significance; mean ± SEM; unpaired t‐test).
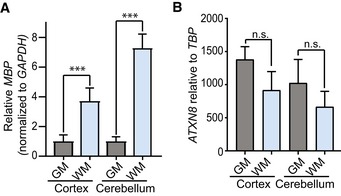
qRT–PCR of MBP in cerebellar white and gray matter regions shows increased expression of MBP in cerebellar white matter compared to cerebellar gray matter (n = 3; ***P < 0.001; mean ± SEM; unpaired t‐test).
qRT–PCR of AXTN8 in cortical and cerebellar white and gray matter shows no difference in ATXN8 RNA expression levels (n = 3; n.s. no significance; mean ± SEM; unpaired t‐test).
qRT–PCR showing Eif3f expression levels are increased twofold in SCA8 cerebellar white matter compared to SCA8 cerebellar gray matter (n = 3, **P < 0.01; mean ± SEM; unpaired t‐test).
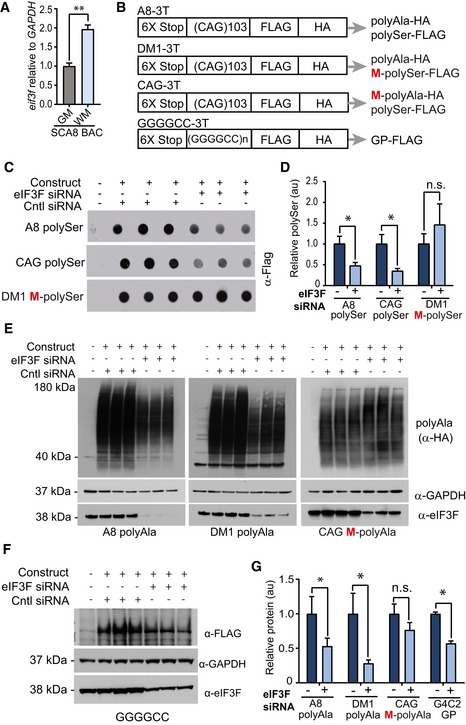
Schematic diagram showing constructs used for eIF3F knockdown experiments. All constructs have a tag in each reading frame. Red M indicates methionine (ATG) initiated reading frames.
Dot blot detection of polySer expression in using α‐FLAG antibody showing decrease in RAN polySer but not ATG‐polySer when HEK293 cells are co‐transfected with eIF3F siRNA.
Quantification of polySer detection (n = 5, *P < 0.01; n.s. no significance; mean ± SEM; unpaired t‐test).
Detection of polyAla expression using α‐HA antibody showing decrease in RAN polyAla but not ATG‐polyAla when HEK293 cells are co‐transfected with eIF3F siRNA.
Detection of polyGP expression using α‐FLAG antibody showing a decrease in RAN polyGP when HEK293 cells are co‐transfected with eIF3F siRNA.
Quantification of polyAla and polyGP detection (n = 5, *P < 0.01; n.s. no significance; mean ± SEM; unpaired t‐test).
Similar articles
-
CCG•CGG interruptions in high-penetrance SCA8 families increase RAN translation and protein toxicity.EMBO Mol Med. 2021 Nov 8;13(11):e14095. doi: 10.15252/emmm.202114095. Epub 2021 Oct 11. EMBO Mol Med. 2021. PMID: 34632710 Free PMC article.
-
RAN Translation in Huntington Disease.Neuron. 2015 Nov 18;88(4):667-77. doi: 10.1016/j.neuron.2015.10.038. Neuron. 2015. PMID: 26590344 Free PMC article.
-
Bidirectional expression of CUG and CAG expansion transcripts and intranuclear polyglutamine inclusions in spinocerebellar ataxia type 8.Nat Genet. 2006 Jul;38(7):758-69. doi: 10.1038/ng1827. Epub 2006 Jun 25. Nat Genet. 2006. PMID: 16804541
-
Repeat associated non-ATG (RAN) translation: new starts in microsatellite expansion disorders.Curr Opin Genet Dev. 2014 Jun;26:6-15. doi: 10.1016/j.gde.2014.03.002. Epub 2014 May 22. Curr Opin Genet Dev. 2014. PMID: 24852074 Free PMC article. Review.
-
Progress in pathogenesis studies of spinocerebellar ataxia type 1.Philos Trans R Soc Lond B Biol Sci. 1999 Jun 29;354(1386):1079-81. doi: 10.1098/rstb.1999.0462. Philos Trans R Soc Lond B Biol Sci. 1999. PMID: 10434309 Free PMC article. Review.
Cited by
-
Molecular mechanisms underlying nucleotide repeat expansion disorders.Nat Rev Mol Cell Biol. 2021 Sep;22(9):589-607. doi: 10.1038/s41580-021-00382-6. Epub 2021 Jun 17. Nat Rev Mol Cell Biol. 2021. PMID: 34140671 Free PMC article. Review.
-
Widespread alternative splicing dysregulation occurs presymptomatically in CAG expansion spinocerebellar ataxias.Brain. 2024 Feb 1;147(2):486-504. doi: 10.1093/brain/awad329. Brain. 2024. PMID: 37776516 Free PMC article.
-
Thymidine Kinase 2 and Mitochondrial Protein COX I in the Cerebellum of Patients with Spinocerebellar Ataxia Type 31 Caused by Penta-nucleotide Repeats (TTCCA)n.Cerebellum. 2023 Feb;22(1):70-84. doi: 10.1007/s12311-021-01364-2. Epub 2022 Jan 27. Cerebellum. 2023. PMID: 35084690 Free PMC article.
-
Repeat-Associated Non-ATG Translation: Molecular Mechanisms and Contribution to Neurological Disease.Annu Rev Neurosci. 2019 Jul 8;42:227-247. doi: 10.1146/annurev-neuro-070918-050405. Epub 2019 Mar 25. Annu Rev Neurosci. 2019. PMID: 30909783 Free PMC article. Review.
-
Repeat-associated non-AUG (RAN) translation: insights from pathology.Lab Invest. 2019 Jul;99(7):929-942. doi: 10.1038/s41374-019-0241-x. Epub 2019 Mar 27. Lab Invest. 2019. PMID: 30918326 Free PMC article. Review.
References
-
- Ash PE, Bieniek KF, Gendron TF, Caulfield T, Lin WL, Dejesus‐Hernandez M, van Blitterswijk MM, Jansen‐West K, Paul JW III, Rademakers R, Boylan KB, Dickson DW, Petrucelli L (2013) Unconventional translation of C9ORF72 GGGGCC expansion generates insoluble polypeptides specific to c9FTD/ALS. Neuron 77: 639–646 - PMC - PubMed
-
- Baba Y, Uitti RJ, Farrer MJ, Wszolek ZK (2005) Sporadic SCA8 mutation resembling corticobasal degeneration. Parkinsonism Relat Disord 11: 147–150 - PubMed
-
- Blomen VA, Májek P, Jae LT, Bigenzahn JW, Nieuwenhuis J, Staring J, Sacco R, van Diemen FR, Olk N, Stukalov A, Marceau C, Janssen H, Carette JE, Bennett KL, Colinge J, Superti‐Furga G, Brummelkamp TR (2015) Gene essentiality and synthetic lethality in haploid human cells. Science 350: 1092–1096 - PubMed
-
- Bohanna I, Georgiou‐Karistianis N, Sritharan A, Asadi H, Johnston L, Churchyard A, Egan G (2011) Diffusion tensor imaging in Huntington's disease reveals distinct patterns of white matter degeneration associated with motor and cognitive deficits. Brain Imaging Behav 5: 171–180 - PubMed
Publication types
MeSH terms
Substances
Supplementary concepts
Grants and funding
LinkOut - more resources
Full Text Sources
Other Literature Sources
Medical
Molecular Biology Databases
Miscellaneous
