

Deconvolution of pro- and antiviral genomic responses in Zika virus-infected and bystander macrophages
- PMID: 30206152
- PMCID: PMC6166801
- DOI: 10.1073/pnas.1807690115
Deconvolution of pro- and antiviral genomic responses in Zika virus-infected and bystander macrophages
Abstract
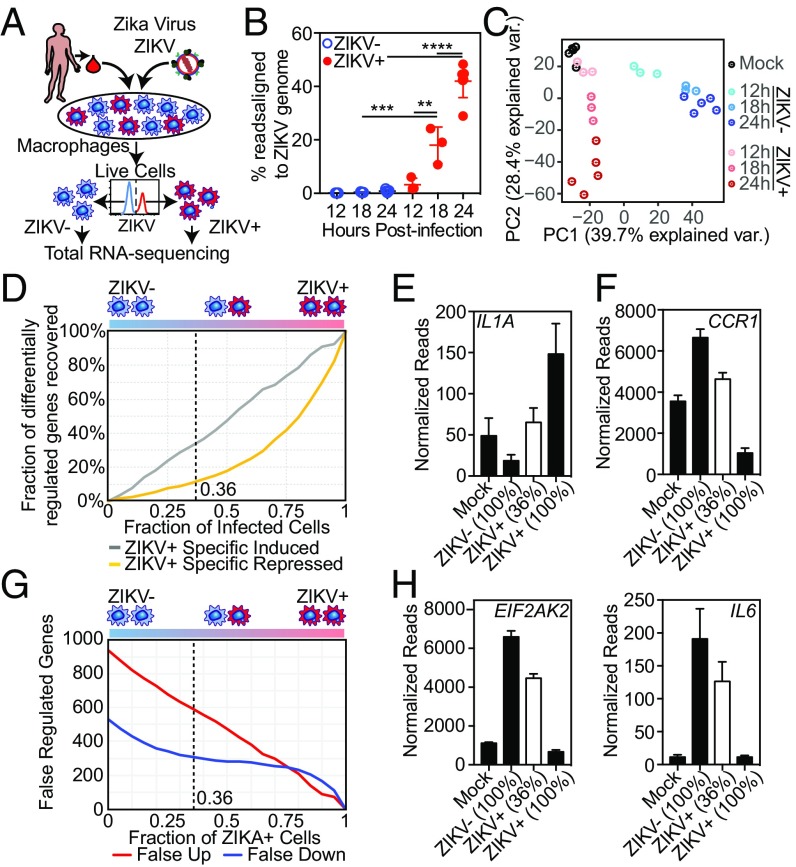
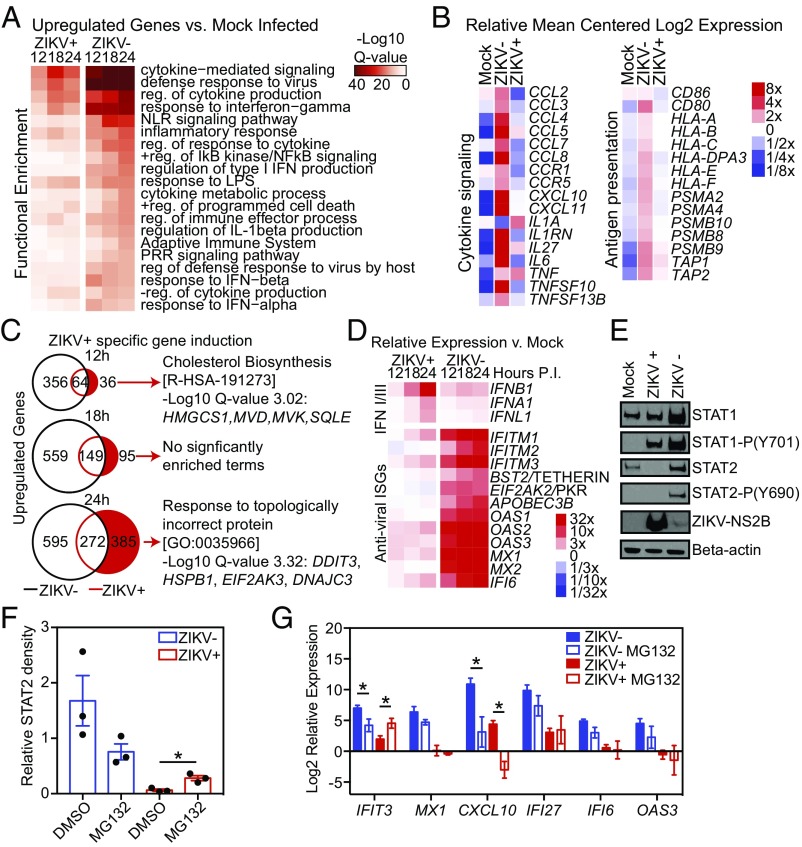
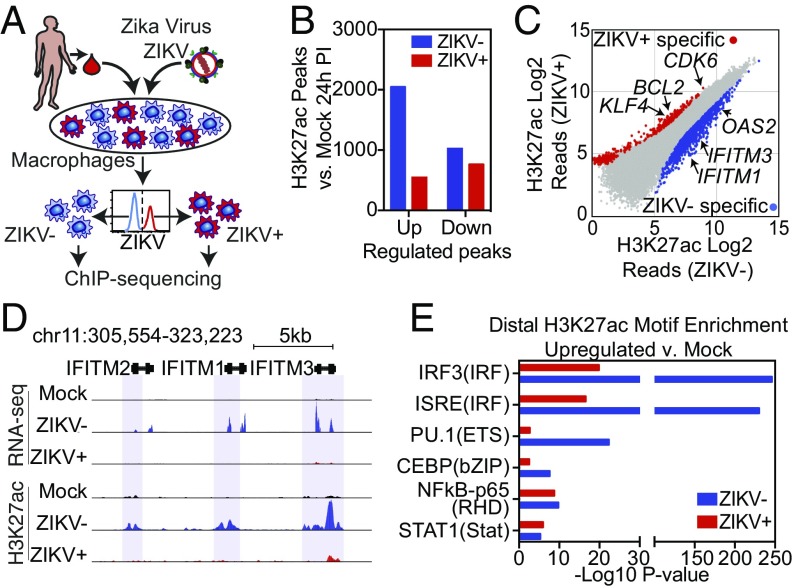
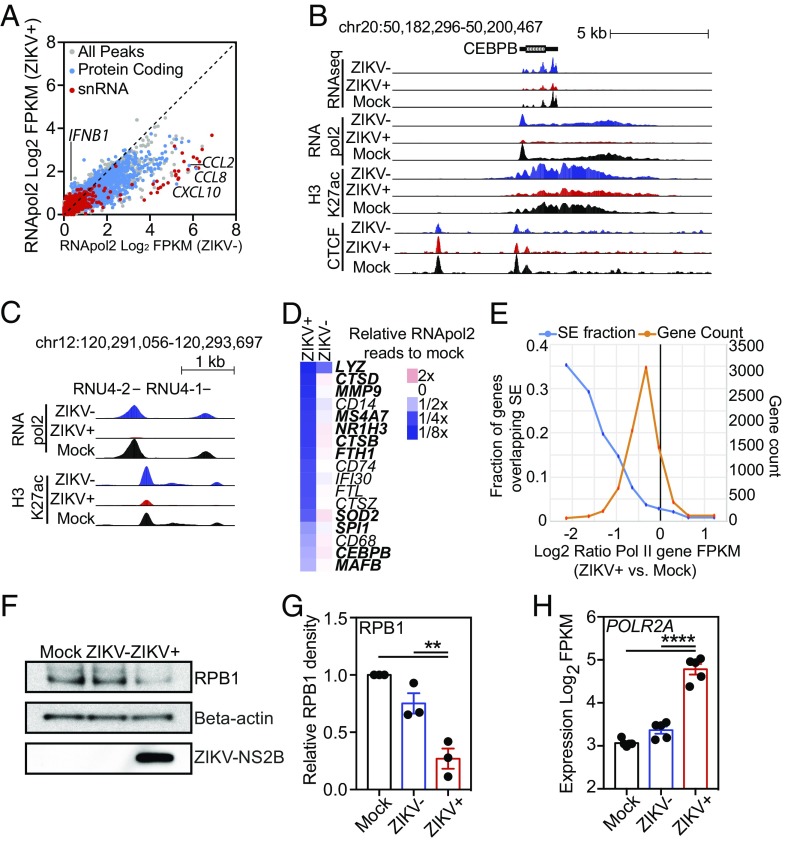
Genome-wide investigations of host-pathogen interactions are often limited by analyses of mixed populations of infected and uninfected cells, which lower sensitivity and accuracy. To overcome these obstacles and identify key mechanisms by which Zika virus (ZIKV) manipulates host responses, we developed a system that enables simultaneous characterization of genome-wide transcriptional and epigenetic changes in ZIKV-infected and neighboring uninfected primary human macrophages. We demonstrate that transcriptional responses in ZIKV-infected macrophages differed radically from those in uninfected neighbors and that studying the cell population as a whole produces misleading results. Notably, the uninfected population of macrophages exhibits the most rapid and extensive changes in gene expression, related to type I IFN signaling. In contrast, infected macrophages exhibit a delayed and attenuated transcriptional response distinguished by preferential expression of IFNB1 at late time points. Biochemical and genomic studies of infected macrophages indicate that ZIKV infection causes both a targeted defect in the type I IFN response due to degradation of STAT2 and reduces RNA polymerase II protein levels and DNA occupancy, particularly at genes required for macrophage identity. Simultaneous evaluation of transcriptomic and epigenetic features of infected and uninfected macrophages thereby reveals the coincident evolution of dominant proviral or antiviral mechanisms, respectively, that determine the outcome of ZIKV exposure.
Keywords: Zika virus; genomics; immune evasion; macrophage; transcription.
Copyright © 2018 the Author(s). Published by PNAS.
Conflict of interest statement
The authors declare no conflict of interest.
Figures
Similar articles
-
Zika virus NS5 protein inhibits type I interferon signaling via CRL3 E3 ubiquitin ligase-mediated degradation of STAT2.Proc Natl Acad Sci U S A. 2024 Aug 20;121(34):e2403235121. doi: 10.1073/pnas.2403235121. Epub 2024 Aug 15. Proc Natl Acad Sci U S A. 2024. PMID: 39145933 Free PMC article.
-
Zika virus encephalitis in immunocompetent mice is dominated by innate immune cells and does not require T or B cells.J Neuroinflammation. 2019 Sep 11;16(1):177. doi: 10.1186/s12974-019-1566-5. J Neuroinflammation. 2019. PMID: 31511023 Free PMC article.
-
NS5-independent Ablation of STAT2 by Zika virus to antagonize interferon signalling.Emerg Microbes Infect. 2021 Dec;10(1):1609-1625. doi: 10.1080/22221751.2021.1964384. Emerg Microbes Infect. 2021. PMID: 34340648 Free PMC article.
-
Evasion of Innate and Intrinsic Antiviral Pathways by the Zika Virus.Viruses. 2019 Oct 22;11(10):970. doi: 10.3390/v11100970. Viruses. 2019. PMID: 31652496 Free PMC article. Review.
-
Running interference: Interplay between Zika virus and the host interferon response.Cytokine. 2019 Jul;119:7-15. doi: 10.1016/j.cyto.2019.02.009. Epub 2019 Mar 8. Cytokine. 2019. PMID: 30856603 Review.
Cited by
-
Comparative Analysis of In Vitro Models to Study Antibody-Dependent Enhancement of Zika Virus Infection.Viruses. 2022 Dec 13;14(12):2776. doi: 10.3390/v14122776. Viruses. 2022. PMID: 36560779 Free PMC article.
-
Single-cell analysis reveals an antiviral network that controls Zika virus infection in human dendritic cells.J Virol. 2024 May 14;98(5):e0019424. doi: 10.1128/jvi.00194-24. Epub 2024 Apr 3. J Virol. 2024. PMID: 38567950 Free PMC article.
-
Interleukin 27, like interferons, activates JAK-STAT signaling and promotes pro-inflammatory and antiviral states that interfere with dengue and chikungunya viruses replication in human macrophages.Front Immunol. 2024 Apr 24;15:1385473. doi: 10.3389/fimmu.2024.1385473. eCollection 2024. Front Immunol. 2024. PMID: 38720890 Free PMC article.
-
Zika Virus-Induced Neuronal Apoptosis via Increased Mitochondrial Fragmentation.Front Microbiol. 2020 Dec 23;11:598203. doi: 10.3389/fmicb.2020.598203. eCollection 2020. Front Microbiol. 2020. PMID: 33424801 Free PMC article.
-
Functional characterization of Alzheimer's disease genetic variants in microglia.Nat Genet. 2023 Oct;55(10):1735-1744. doi: 10.1038/s41588-023-01506-8. Epub 2023 Sep 21. Nat Genet. 2023. PMID: 37735198 Free PMC article.
References
-
- Chambers TJ, Hahn CS, Galler R, Rice CM. Flavivirus genome organization, expression, and replication. Annu Rev Microbiol. 1990;44:649–688. - PubMed
-
- Davidson A, Slavinski S, Komoto K, Rakeman J, Weiss D. Suspected female-to-male sexual transmission of Zika virus–New York City, 2016. MMWR Morb Mortal Wkly Rep. 2016;65:716–717. - PubMed
-
- Kuehnert MJ, et al. Screening of blood donations for Zika virus infection–Puerto Rico, April 3-June 11, 2016. MMWR Morb Mortal Wkly Rep. 2016;65:627–628. - PubMed
Publication types
MeSH terms
Substances
Grants and funding
LinkOut - more resources
Full Text Sources
Other Literature Sources
Medical
Molecular Biology Databases
Research Materials
Miscellaneous
