. 2018 Sep 11;9(5):e00757-18.
doi: 10.1128/mBio.00757-18.

Induction of HIF-1α by HIV-1 Infection in CD4+ T Cells Promotes Viral Replication and Drives Extracellular Vesicle-Mediated Inflammation

Affiliations

Induction of HIF-1α by HIV-1 Infection in CD4+ T Cells Promotes Viral Replication and Drives Extracellular Vesicle-Mediated Inflammation

Gabriel Duette et al. mBio. .

Abstract

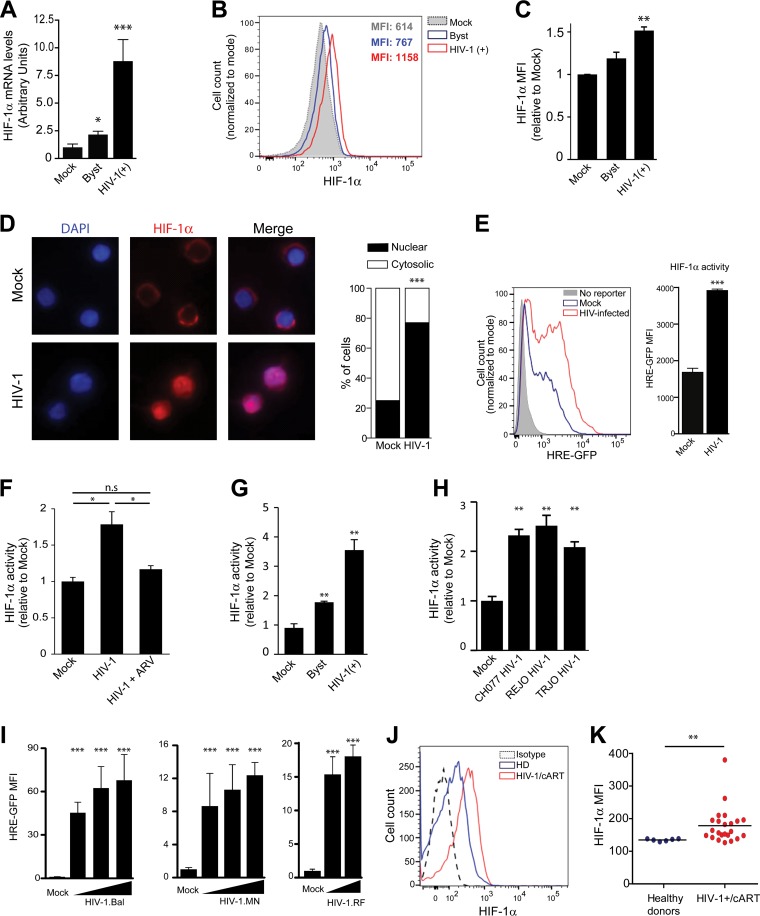
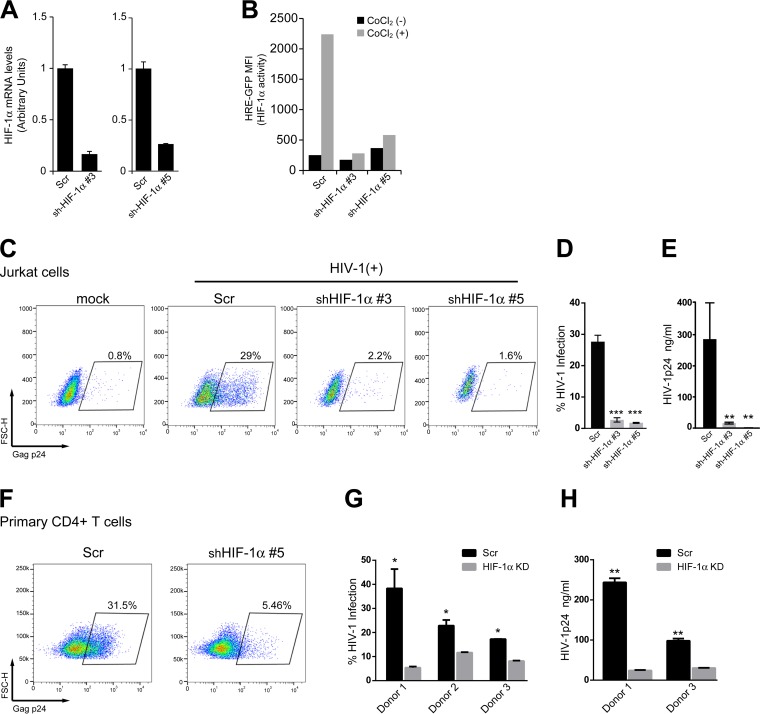
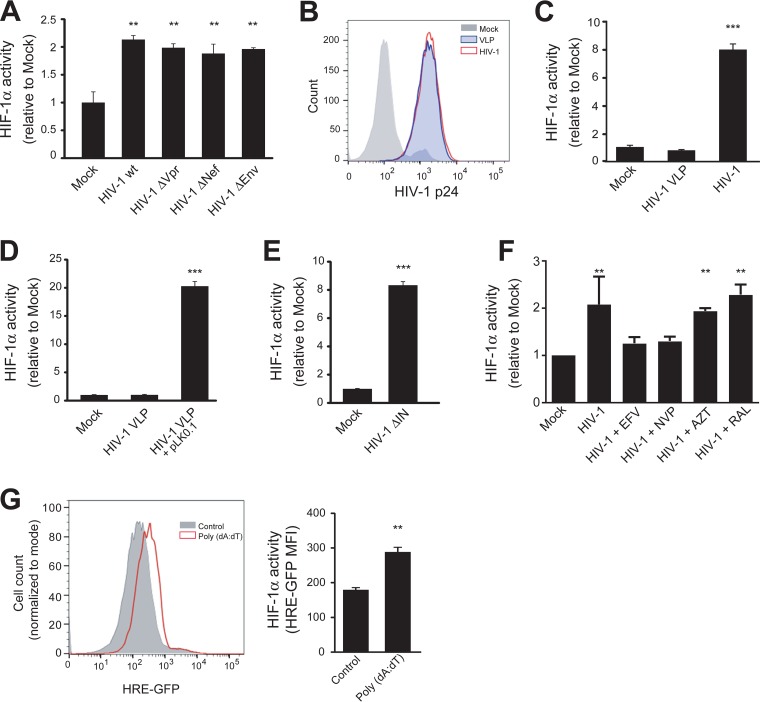
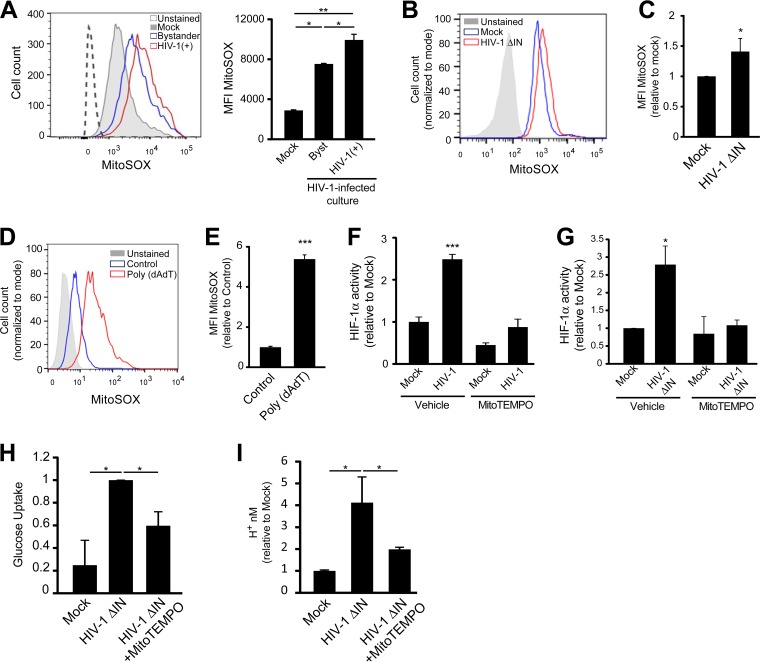
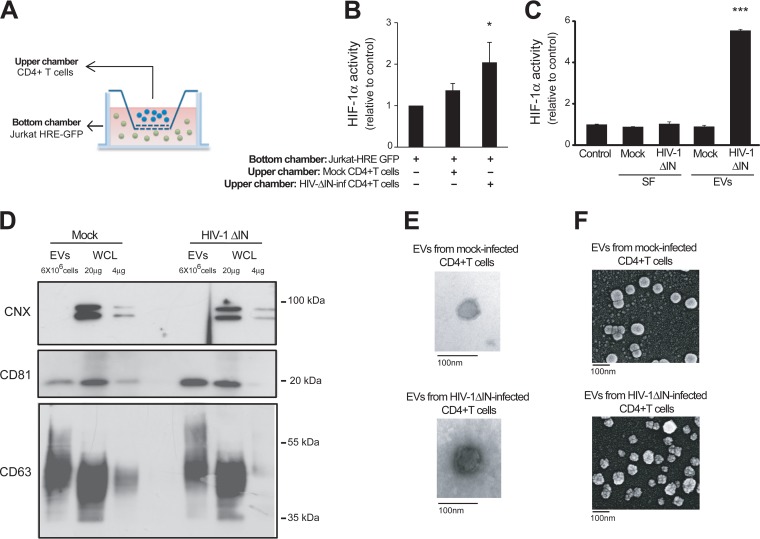
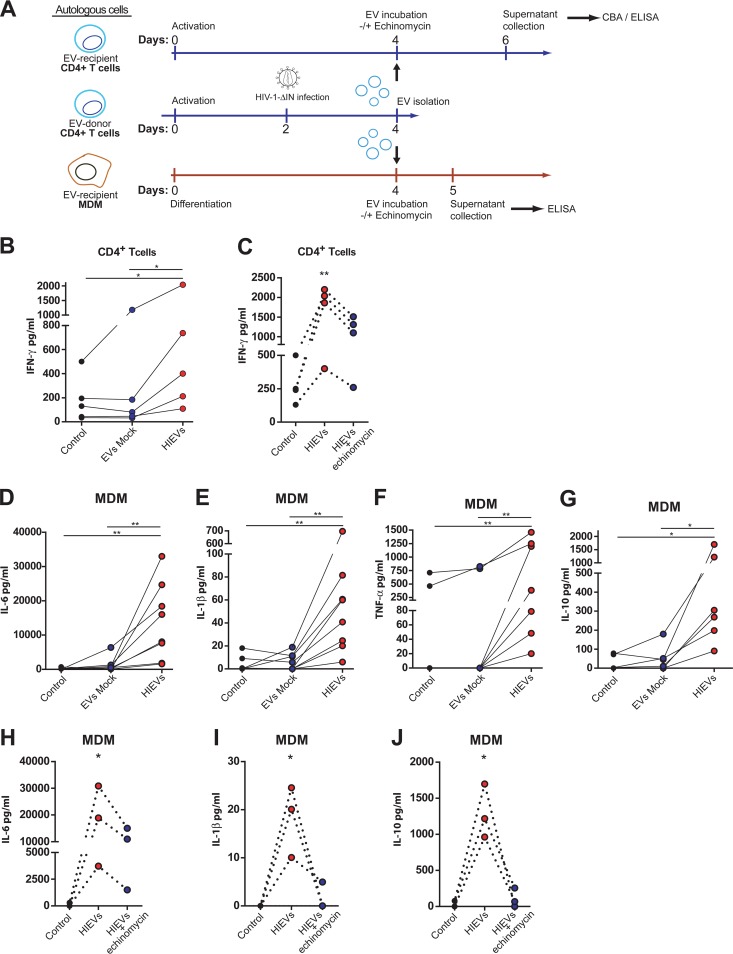
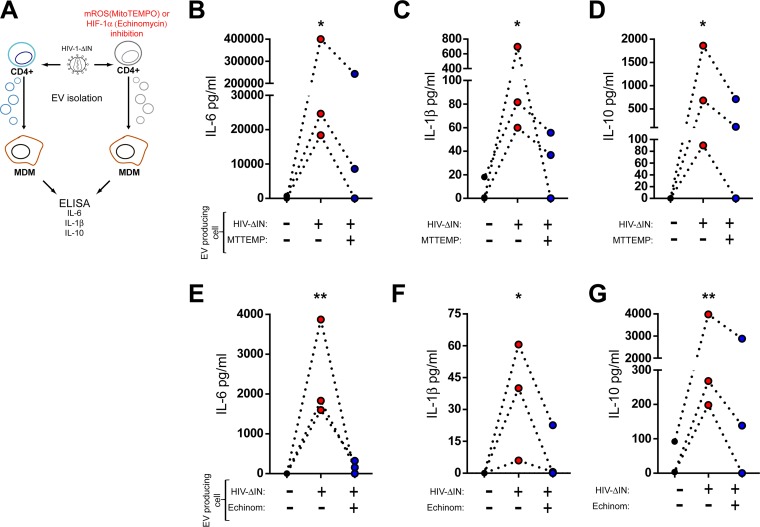
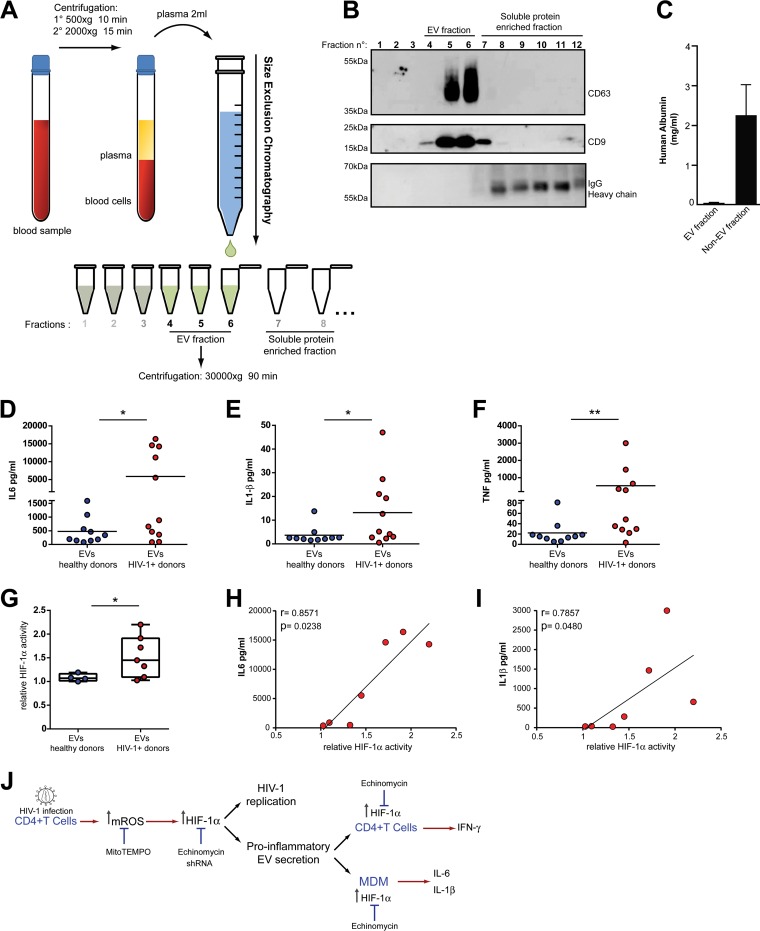
Chronic immune activation and inflammation are hallmarks of HIV-1 infection and a major cause of serious non-AIDS events in HIV-1-infected individuals on antiretroviral treatment (ART). Herein, we show that cytosolic double-stranded DNA (dsDNA) generated in infected CD4+ T cells during the HIV-1 replication cycle promotes the mitochondrial reactive oxygen species (ROS)-dependent stabilization of the transcription factor hypoxia-inducible factor 1α (HIF-1α), which in turn, enhances viral replication. Furthermore, we show that induction of HIF-1α promotes the release of extracellular vesicles (EVs). These EVs foster inflammation by inducing the secretion of gamma interferon by bystander CD4+ T cells and secretion of interleukin 6 (IL-6) and IL-1β by bystander macrophages through an HIF-1α-dependent pathway. Remarkably, EVs obtained from plasma samples from HIV-1-infected individuals also induced HIF-1α activity and inflammation. Overall, this study demonstrates that HIF-1α plays a crucial role in HIV-1 pathogenesis by promoting viral replication and the release of EVs that orchestrate lymphocyte- and macrophage-mediated inflammatory responses.IMPORTANCE Human immunodeficiency virus type 1 (HIV-1) is a very important global pathogen that preferentially targets CD4+ T cells and causes acquired immunodeficiency syndrome (AIDS) if left untreated. Although antiretroviral treatment efficiently suppresses viremia, markers of immune activation and inflammation remain higher in HIV-1-infected patients than in uninfected individuals. The hypoxia-inducible factor 1α (HIF-1α) is a transcription factor that plays a fundamental role in coordinating cellular metabolism and function. Here we show that HIV-1 infection induces HIF-1α activity and that this transcription factor upholds HIV-1 replication. Moreover, we demonstrate that HIF-1α plays a key role in HIV-1-associated inflammation by promoting the release of extracellular vesicles which, in turn, trigger the secretion of inflammatory mediators by noninfected bystander lymphocytes and macrophages. In summary, we identify that the coordinated actions of HIF-1α and extracellular vesicles promote viral replication and inflammation, thus contributing to HIV-1 pathogenesis.

Keywords: CD4+ T lymphocyte; extracellular vesicles; human immunodeficiency virus; hypoxia-inducible factor 1 alpha; inflammation; macrophage.


Figures

FIG 1
FIG 1
HIV-1 infection increases HIF-1α levels and activity in CD4+ T cells. (A to C) CD4+ T cells isolated from blood samples from healthy donors were activated through stimulation with anti-CD3/CD28/CD2 antibody-coated beads for 72 h. A total of 107 cells were either mock infected or infected with VSV-G-pseudotyped HIV-1-GFP (200 ng/ml p24). (A) At day 2 postinfection, GFP-positive (GFP+) (productively infected) and GFP-negative cells (bystander [Byst] cells) were sorted by FACS. HIF-1α mRNA levels were determined by qPCR and are expressed as fold change from the value for the control condition (the value for mock-infected cells set at 1). The results of a representative experiment (n = 3) performed in triplicate are shown. (B and C) HIF-1α protein levels in mock-infected (filled gray histogram), HIV-1-infected (GFP-positive cells [red histogram]) and bystander (GFP-negative cells [blue histogram]) CD4+ T cells were analyzed by intracellular FACS staining. Histograms from a representative experiment (B), and the average fold change (compared to the value for the mock-infected condition) in the mean fluorescent intensity (MFI) obtained with cells from four different donors (C) are shown. (D) Immunofluorescence microscopy of HIV-1-infected CD4+ T cells stained with anti-HIF-1α antibodies (red) at day two postinfection. Cell nuclei were stained with 4′,6-diamidino-2-phenylindole (DAPI) (blue). Quantitation of cytosolic versus cytosolic plus nuclear distribution of HIF-1α was evaluated by observers in a blind manner on a per-cell basis in 100 cells of each condition. Data are expressed as a percentage of cells in each category. (E to I) HIF-1α transcriptional activity induced by HIV-1 infection was evaluated by FACS analysis using the Jurkat HRE-GFP cells. (E) Histograms from a representative experiment (left panel), and the MFI of GFP expression (right panel) at 48 h postinfection (p.i.) is shown (n = 5). The fluorescence corresponding to mock-infected and HIV-1-infected cells are represented as blue and red histograms, respectively. Cells not expressing the reporter gene are shown as a negative control (filled gray histogram). (F) Cells were pretreated (1 h) with antiretroviral (ARV) drugs (enfurvitide and efavirenz). Cells were then infected, and HIF-1α activity was determined by analyzing the expression of the reporter GFP at 48 h p.i. Pooled data from three independent experiments are shown. (G) Productively infected cells were identified by intracellular staining of p24 antigen. GFP expression in HIV-1-infected Jurkat HRE-GFP cells was analyzed in p24-positive cells (productively infected) or p24-negative cells (bystander cells) versus mock-infected cells. A representative experiment of four independent experiments is shown. (H) Induction of HIF-1α by primary HIV-1 isolates in Jurkat HRE-GFP was analyzed (n = 2). (I) Infection of Jurkat HRE-GFP with virus strains of different surface tropism resulted in dose-dependent increase of HIF-1α reporter. The strains were BaL (CCR5-tropic), MN (CXCR5-tropic), and RF (dual-tropic). (J and K) Total HIF-1α levels were determined in CD4+ T cells isolated from healthy donors (n = 6) and HIV-1-infected donors (n = 23) by intracellular FACS staining. A representative histogram (J) and values corresponding to each individual (K) are shown. Statistical significance is indicated as follows: *, P < 0.05; **, P < 0.005; ***, P < 0.0001; n.s., not significant.
FIG 2
FIG 2
HIF-1α activity promotes HIV-1 replication. (A) The expression of HIF-1α in Jurkat cells was silenced by lentiviral transduction with two specific shRNAs targeting HIF-1α. A scrambled (Scr) shRNA was used as a control. (B) Functional evidence of silencing was obtained by analyzing HIF-1α activity in Jurkat HRE-GFP reporter cells treated with CoCl2 [CoCl2 (+)]. (C to E) Control or HIF-1α-silenced Jurkat cells were infected with VSV-G-pseudotyped HIV-1 (20 ng/ml p24). On day 3 postinfection, the percentage of infected cells was evaluated by intracellular staining of the viral antigen p24 followed by FACS analysis. A representative dot-plot (C) and the mean plus standard deviation (SD) (error bar) of a representative experiment performed in triplicate (D) are shown. FSC-H, forward scatter height. (E) Viral production was analyzed in cell culture supernatant by ELISA to detect the viral antigen p24. (F to H) Control or HIF-1α-silenced primary CD4+ T cells were infected with VSV-G-pseudotyped HIV-1 (20 ng/ml p24). On day 3 postinfection, the percentage of infected cells was evaluated by FACS analysis. A representative FACS dot plot (F), and results from three independent blood donors (G) are shown. Viral production was analyzed in cell culture supernatant by ELISA to detect the viral antigen p24 (H). *, P < 0.05; **, P < 0.005; ***, P < 0.0001. KD, knocked down.
FIG 3
FIG 3
Promotion of HIF-1α activity by HIV-1 infection is triggered by viral nucleic acids. (A to F) HRE-GFP reporter Jurkat cells were infected or transduced with HIV-1wt or different viral mutants, and the expression levels of the HIF-1α reporter GFP were analyzed by FACS at 48 h p.i. (A) Cells were infected with HIV-1ΔVpr, HIV-1ΔNef, and HIV-1ΔEnv. HIV-1wt and mock infections were used as positive and negative controls, respectively. Representative data of four independent experiments are shown. (B and C) Cells were spinoculated (90 min) with either VSV-G-pseudotyped HIV-1 VLPs (empty) or VSV-G-pseudotyped HIV-1 and washed three times in PBS. (B) Viral particle entry was measured immediately after spinoculation by intracellular p24 staining. (C) Reporter GFP expression was determined by FACS analysis. Representative data of four independent experiments are shown. (D) Cells were spinoculated with VSV-G-pseudotyped HIV-1 VLPs (empty) or with HIV-1 VLPs containing the HIV-1-derived RNA from pLK0.1. Mock-infected cells were used as a control. Representative data of three independent experiments are shown. (E) Cells were spinoculated with a VSV-G-pseudotyped integrase-deficient HIV-1 mutant (HIV-1ΔIN). Mock spinoculation was used as a control. Representative data of five independent experiments are shown. (F) Cells were infected with HIV-1 in the presence of vehicle, EFV, NVP, AZT, and RAL. Pooled data from three independent experiments are shown. (G) HeLa HRE-GFP reporter cells were transfected with poly(dA-dT). Cells exposed to transfection reagent without DNA were used as a negative control. (Left) Histogram overlays show the expression of the reporter GFP from a representative experiment. (Right) Average plus SD of the MFI of GFP is shown (n = 4). **, P < 0.005; ***, P < 0.0001.
FIG 4
FIG 4
Induction of HIF-1α activity by HIV-1 infection depends on the production of mitochondrial ROS triggered by the cytosolic viral dsDNA. (A) CD4+ T cells isolated from blood samples from healthy donors were activated and subsequently infected with VSV-G-pseudotyped HIV-1-GFP or mock infected. mtROS production was measured using MitoSOX at day 2 postinfection in mock-infected cells (gray histogram), bystander cells (blue histogram) and HIV-1-infected (red histogram) CD4+ T cells. Unstained control is shown (filled gray histogram). Histograms from a representative experiment, and average MFI (n = 3) are shown. (B and C) mtROS production was measured in HIV-1ΔIN-infected and mock-infected Jurkat cells at 24 h postinfection. A representative histogram (B) and pooled data from three independent experiment are shown (C). (D and E) HeLa cells were transfected with poly(dA-dT), and mtROS production was measured at 24 h posttransfection. Cells exposed to transfection reagent without DNA were used as a negative control. A representative histogram (D) and pooled data from three independent experiments are shown (E). (F and G) To evaluate the contribution of mtROS on the promotion of HIF-1α activity, Jurkat HRE-GFP reporter cells were infected with HIV-1 (F) or HIV-1ΔIN (G), and after infection, the cells were incubated in the presence or absence of MitoTEMPO (500 µM). Two days postinfection, GFP expression was measured by FACS. Pooled data from three independent experiments are shown. (H and I) Activated primary CD4+ cells were infected with HIV-1ΔIN, and after infection, the cells were incubated in the presence or absence of MitoTEMPO (500 µM). Three days postinfection, glucose uptake analysis using the GlucCell assay (H) and pH quantification (I) were performed as a proxy for glycolysis. Pooled data from three independent experiment are shown. *, P < 0.05; **, P < 0.005; ***, P < 0.0001.
FIG 5
FIG 5
HIV-1 infection induces the extracellular vesicle-mediated propagation of HIF-1α activity to bystander cells. (A and B) In transwell experiments, CD4+ T cells isolated from blood samples from healthy donors were activated through stimulation with anti-CD3/CD28/CD2 antibody-coated beads for 48 h. A total of 6 × 10⁶ cells were either mock infected or infected with VSV-G-pseudotyped HIV-1ΔIN. On day 2 postinfection, cells (5 × 10⁵) were placed in the top chamber of a transwell (0.45 µm) and cocultivated with the Jurkat HRE-GFP cells (bottom chamber, 2 × 10⁵ cells). GFP expression of reporter cells was evaluated 2 days later. (A) Schematic representation of the experiment. (B) FACS analysis of pooled data from two independent experiments. (C) EVs and soluble fraction (SF) of cell culture supernatant of mock-infected or HIV-1ΔIN-infected primary CD4+ T cells were separated at day 2 p.i. by differential centrifugation. The EV pellet was resuspended in the same starting volume of medium. Jurkat HRE-GFP cells were incubated with either the SF or the isolated EVs for 48 h. FACS analysis of the MFI of GFP from a representative experiment is shown (n = 4). (D to F) Characterization of EVs released by mock-infected and HIV-1ΔIN-infected CD4+ T cells. (D) Presence of CD63, CD81 (canonical EV markers), and calnexin (CNX) (ER marker) was determined by immunoblotting of protein from isolated EVs and whole-cell lysates (WCL). EVs produced by equal numbers (6 × 10⁶) of mock-infected or HIV-1ΔIN-infected cells were analyzed together with WCL (20 and 4 µg). (E and F) Visualization of EVs by TEM (E) and SEM (F) was performed. *, P < 0.05; ***, P < 0.0001.
FIG 6
FIG 6
EVs released by HIV-1-infected cells promote HIF-1α-mediated secretion of proinflammatory cytokines in CD4+ T cells and macrophages. (A) Schematic representation of the experimental design. HIEVs or EVs from 6 × 10⁶ mock-infected CD4+ T cells were purified on day 2 p.i. and added to autologous uninfected activated CD4+ T cells or macrophages. Cytokine secretion was quantified by ELISA or cytokine bead array (CBA). (B) HIEVs or EVs from mock-infected cells were added to autologous CD4+ T cells. Secretion of IFN-γ by CD4+ T cells that had received EVs was assessed by ELISA. (C) IFN-γ production by CD4+ T cells exposed to HIEVs in the presence or absence of echinomycin (1 nM) was determined by ELISA. (D to G) HIEVs and EVs from mock-infected CD4+ T cells were added to autologous macrophages, and production of IL-6 (D), IL-1β (E), TNF-α (F), and IL-10 (G) was measured by ELISA. Results from individual experiments using independent blood donors are shown. (H to J) Production of IL-6 (H), IL-1β (I), and IL-10 (J) by monocyte-derived macrophages (MDM) exposed to HIEVs and treated with echinomycin (1 nM) was measured by ELISA. *, P < 0.05; **, P < 0.005.
FIG 7
FIG 7
Induction of HIF-1α activity triggered by HIV-1-derived nucleic acids is a prerequisite for the production of inflammatory HIEVs. (A) Schematic representation of the experimental design for panels B to G. (B to D) Primary CD4+ T cells were activated, infected (+) or not infected with HIV-1ΔIN, and subsequently treated with MitoTEMPO (MTTEMP) (500 µM) (+). Vesicles were purified, extensively washed, and added to autologous macrophage cultures. The production of IL-6 (B), IL-1β (C), and IL-10 (D) was evaluated 24 h later. (E to G) Primary CD4+ T cells were activated, infected or not infected with HIV-1 ΔIN and subsequently treated with echinomycin (Echinom) (1 nM). Vesicles were purified, extensively washed, and added to autologous macrophage cultures. The production of IL-6 (E), IL-1β (F), and IL-10 (G) was evaluated 24 h later. *, P < 0.05; **, P < 0.005.
FIG 8
FIG 8
EVs isolated from plasma samples from HIV-1-infected individuals are proinflammatory and induce HIF-1α activity. (A) Schematic diagram depicting the procedure to isolate EVs from human plasma by size exclusion chromatography (SEC). (B) Immunoblot analysis of the first 12 fractions obtained by SEC. The presence of the EV markers CD63 and CD9 and the presence of IgG was analyzed. (C) Quantification of human albumin in the pooled EV fraction (fractions 4 to 6) and in the pooled non-EV fraction (fractions 7 to 12). (D to F) EVs isolated from plasma samples from either healthy controls or HIV-1 individuals were added to monocyte-derived macrophages, and production of the proinflammatory cytokines IL-6, IL-1β, and TNF-α was analyzed by ELISA on day 2 after addition of the EVs. (G) The ability of EVs isolated from plasma to stimulate HIF-1α activity was analyzed using the HeLa HRE-GFP reporter cell line. EVs isolated from plasma samples from a subset of HIV-1-infected individuals and healthy donors and the reporter cell line were incubated for 48 h, and the HIF-1α-driven expression of GFP was analyzed by FACS. (H and I) Correlation between the HIF-1α-inducing activity of EVs and the amounts of IL-6 (H) and IL-1β (I) secreted by stimulated macrophages. (J) Working model proposing that mitochondrial ROS (mtROS) production triggered by HIV-1 infection induces HIF-1α activity, resulting in an increase in viral replication and the production of HIEVs which, in turn, induce HIF-1α activity and inflammation in bystander cells. *, P < 0.05; **, P < 0.005.

Similar articles

Cited by

References

    1. Veazey RS, DeMaria M, Chalifoux LV, Shvetz DE, Pauley DR, Knight HL, Rosenzweig M, Johnson RP, Desrosiers RC, Lackner AA. 1998. Gastrointestinal tract as a major site of CD4+ T cell depletion and viral replication in SIV infection. Science 280:427–431. doi:10.1126/science.280.5362.427. - DOI - PubMed
    1. Walensky RP, Paltiel AD, Losina E, Mercincavage LM, Schackman BR, Sax PE, Weinstein MC, Freedberg KA. 2006. The survival benefits of AIDS treatment in the United States. J Infect Dis 194:11–19. doi:10.1086/505147. - DOI - PubMed
    1. Deeks SG, Gange SJ, Kitahata MM, Saag MS, Justice AC, Hogg RS, Eron JJ, Brooks JT, Rourke SB, Gill MJ, Bosch RJ, Benson CA, Collier AC, Martin JN, Klein MB, Jacobson LP, Rodriguez B, Sterling TR, Kirk GD, Napravnik S, Rachlis AR, Calzavara LM, Horberg MA, Silverberg MJ, Gebo KA, Kushel MB, Goedert JJ, McKaig RG, Moore RD. 2009. Trends in multidrug treatment failure and subsequent mortality among antiretroviral therapy-experienced patients with HIV infection in North America. Clin Infect Dis 49:1582–1590. doi:10.1086/644768. - DOI - PMC - PubMed
    1. Duffau P, Wittkop L, Lazaro E, le Marec F, Cognet C, Blanco P, Moreau JF, Dauchy FA, Cazanave C, Vandenhende MA, Bonnet F, Thiebaut R, Pellegrin I, ANRS CO3 Aquitaine Cohort Study Group . 2015. Association of immune-activation and senescence markers with non-AIDS-defining comorbidities in HIV-suppressed patients. AIDS 29:2099–2108. doi:10.1097/QAD.0000000000000807. - DOI - PubMed
    1. Kuller LH, Tracy R, Belloso W, De Wit S, Drummond F, Lane HC, Ledergerber B, Lundgren J, Neuhaus J, Nixon D, Paton NI, Neaton JD, INSIGHT SMART Study Group . 2008. Inflammatory and coagulation biomarkers and mortality in patients with HIV infection. PLoS Med 5:e203. doi:10.1371/journal.pmed.0050203. - DOI - PMC - PubMed

Publication types

MeSH terms