. 2018 Sep 11;9(9):924.
doi: 10.1038/s41419-018-0991-1.

Transcription coactivator Cited1 acts as an inducer of trophoblast-like state from mouse embryonic stem cells through the activation of BMP signaling

Affiliations

Transcription coactivator Cited1 acts as an inducer of trophoblast-like state from mouse embryonic stem cells through the activation of BMP signaling

Yanli Xu et al. Cell Death Dis. .

Abstract

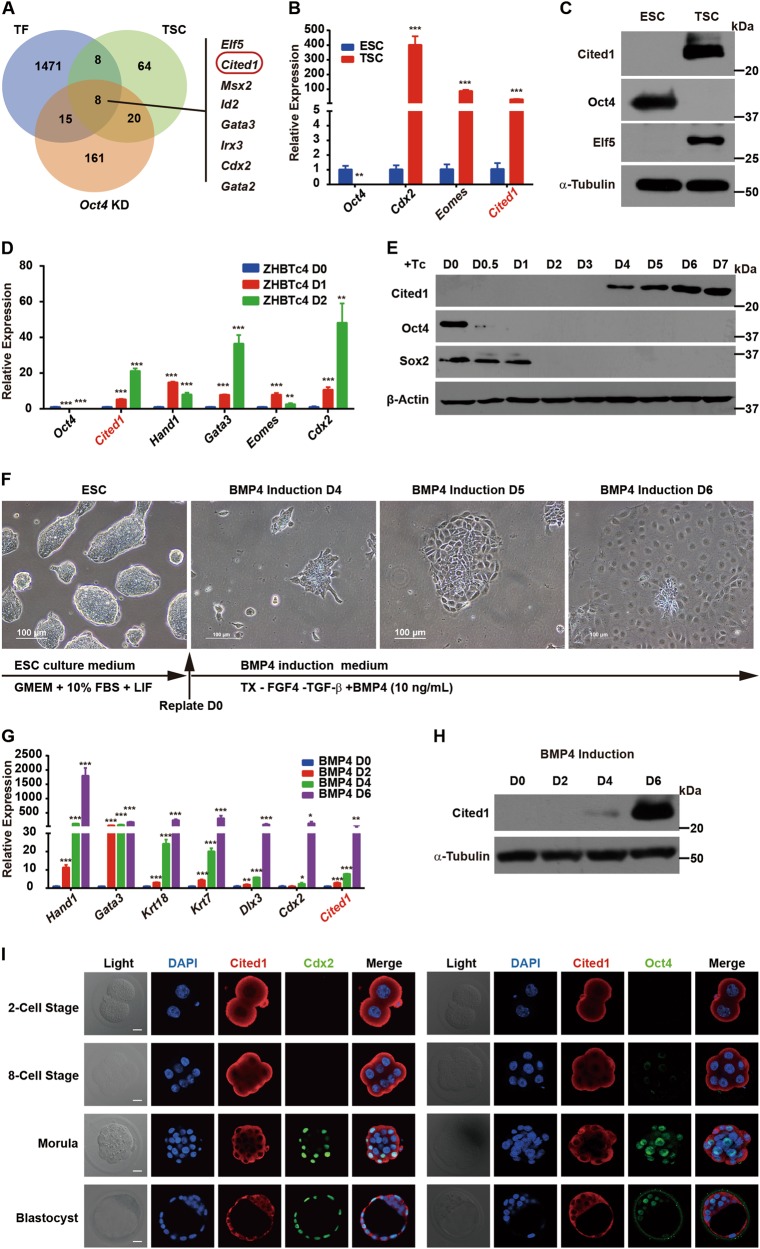
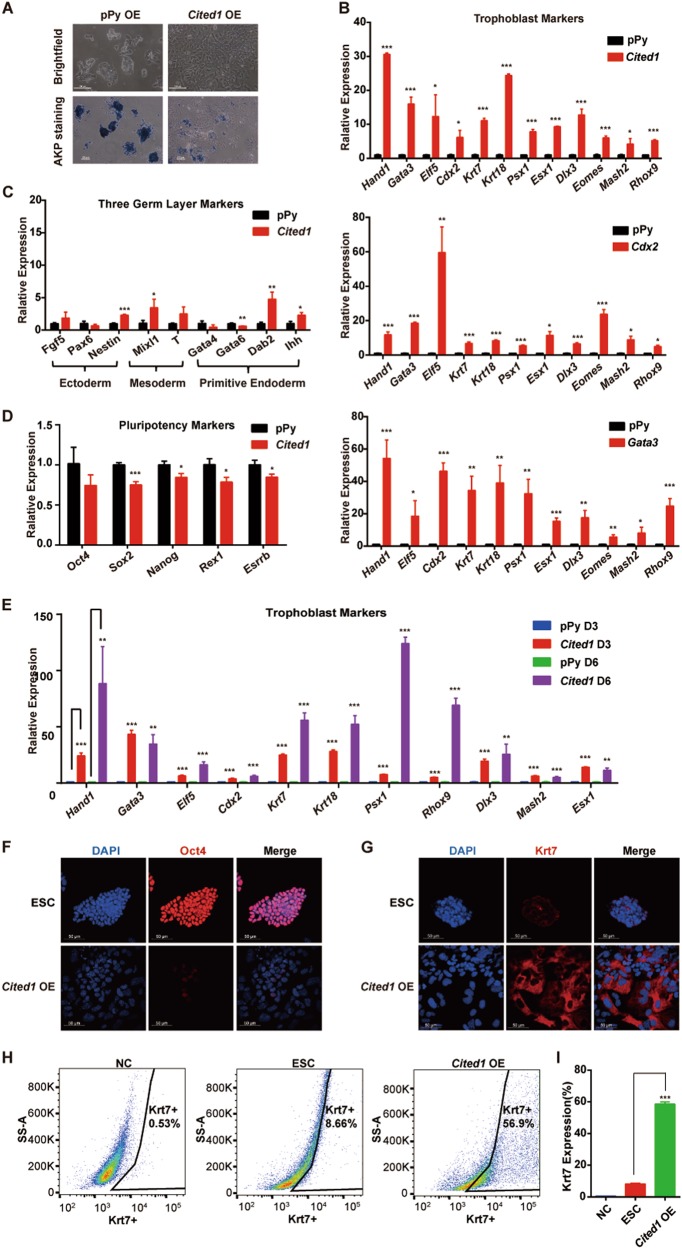
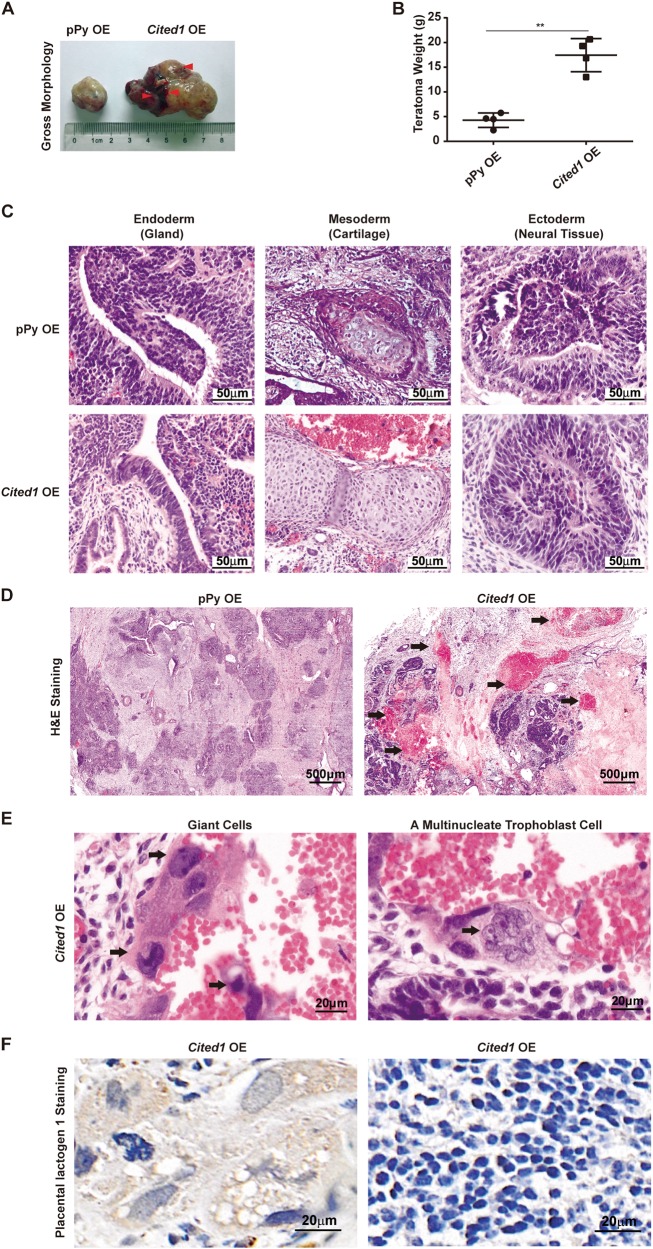
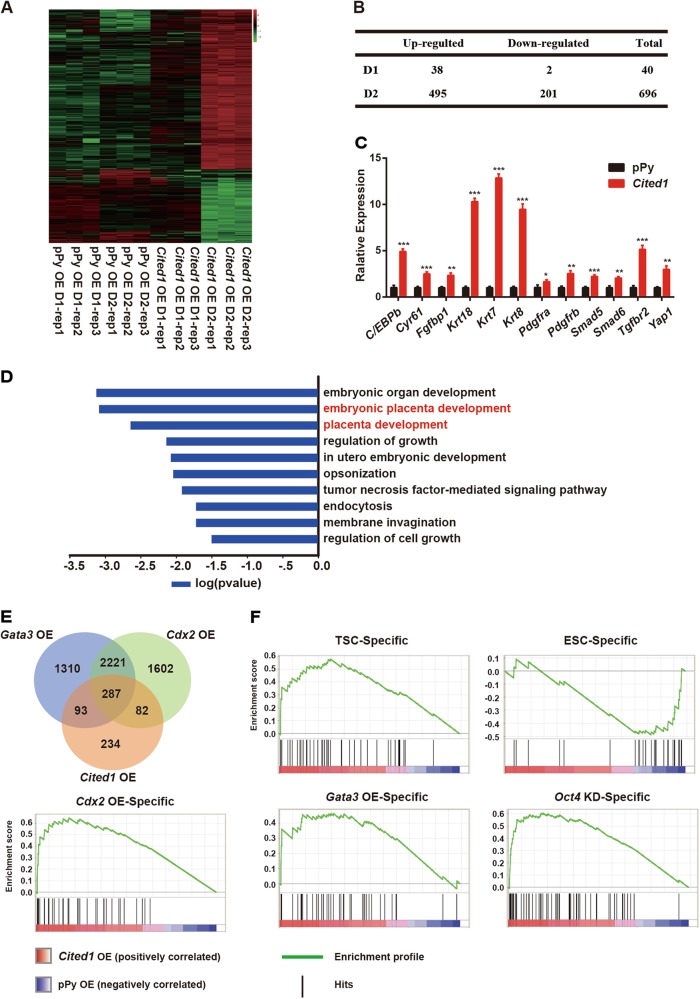
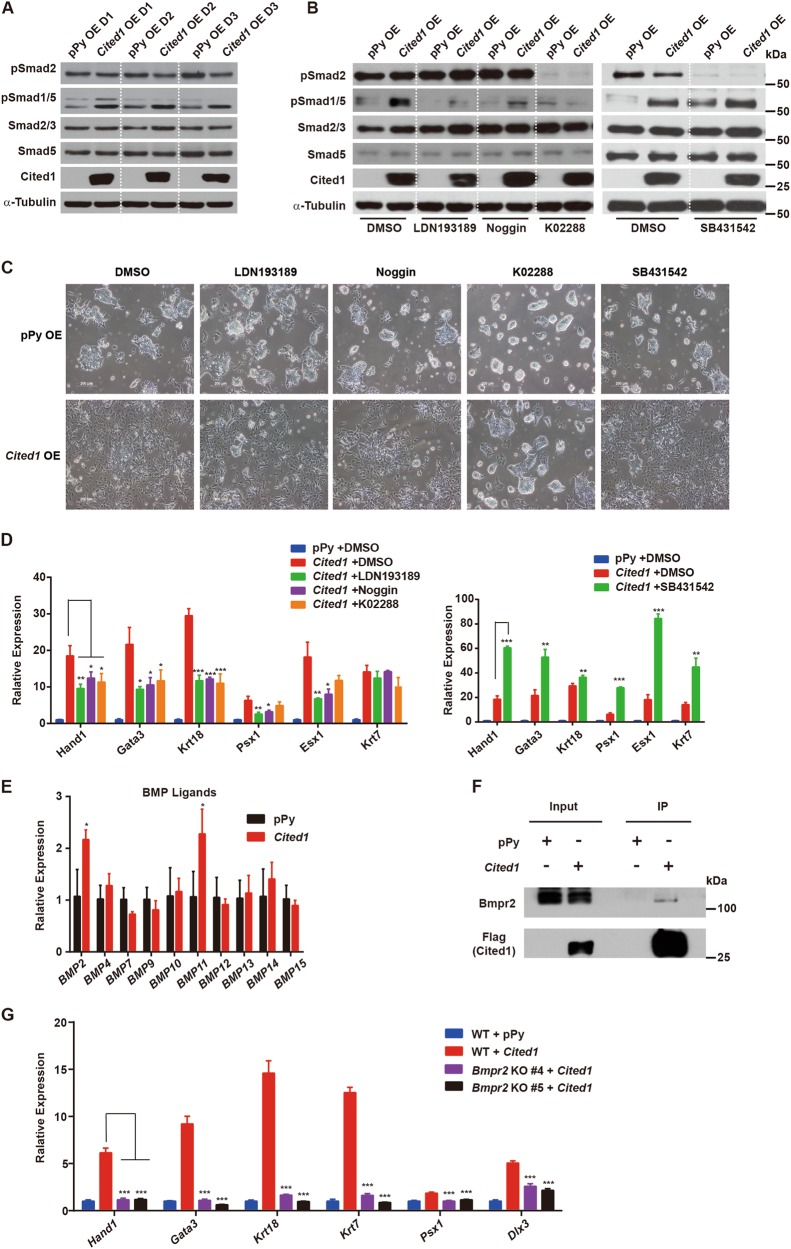
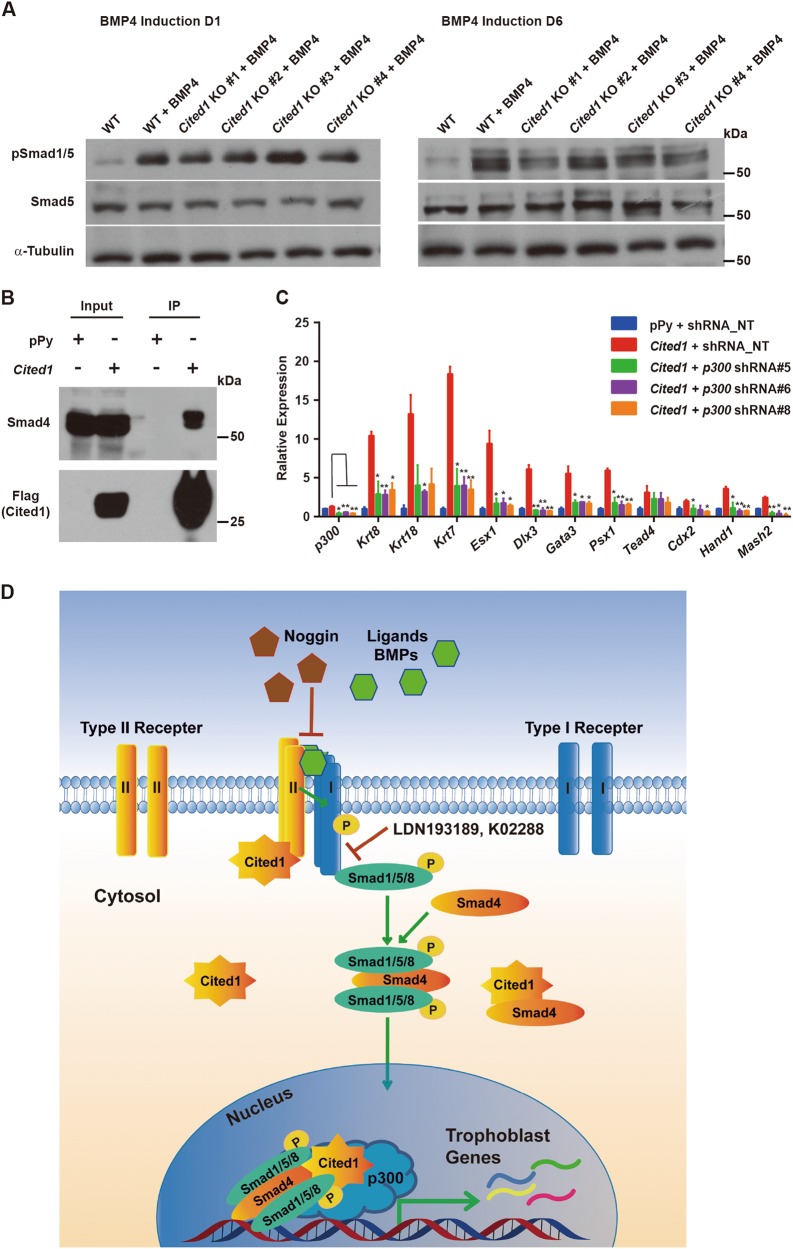
Trophoblast lineages, precursors of the placenta, are essential for post-implantation embryo survival. However, the regulatory network of trophoblast development remains incompletely understood. Here, we report that Cited1, a transcription coactivator, is a robust inducer for trophoblast-like state from mouse embryonic stem cells (ESCs). Depletion of Cited1 in ESCs compromises the trophoblast lineage specification induced by BMP signaling. In contrast, overexpression of Cited1 in ESCs induces a trophoblast-like state with elevated expression of trophoblast marker genes in vitro and generation of trophoblastic tumors in vivo. Furthermore, global transcriptome profile analysis indicates that ectopic Cited1 activates a trophoblast-like transcriptional program in ESCs. Mechanistically, Cited1 interacts with Bmpr2 and Smad4 to activate the Cited1-Bmpr2-Smad1/5/8 axis in the cytoplasm and Cited1-Smad4-p300 complexes in the nucleus, respectively. Collectively, our results show that Cited1 plays an important role in regulating trophoblast lineage specification through activating the BMP signaling pathway.


Figures

Fig. 1
Fig. 1. Cited1 is highly expressed in cultured trophoblast lineages and in the trophectoderm of early mouse embryos
a A venn diagram showing the intersections of 3 gene sets: highly differentially expressed genes (DEGs) in TSCs versus ESCs (TSC, green), DEGs upon Oct4 knockdown (Oct4 KD, pink) and transcription factors (TF, blue). The number of genes is indicated. b Expression patterns of Cited1 and marker genes related to pluripotency and trophoblast lineage in E14T ESCs and TSCs, examined by qRT-PCR analysis. The average mRNA level in ESCs was set at 1.0. Data are shown as mean ± SD (n = 3). **p < 0.01, ***p < 0.001. c Representative western blot result of Cited1, Oct4 and Elf5 in ESCs and TSCs. α-Tubulin was used as a loading control. d Expression levels of Cited1 and trophoblast markers during differentiation of the ZHBTc4 ESCs were determined by qRT-PCR analysis. The average mRNA level in ZHBTc4 cells cultured without Tc was set at 1.0. Data are shown as mean ± SD (n = 3). **p < 0.01, ***p < 0.001. e Representative western blot result of Cited1, Oct4, and Sox2 during differentiation of ZHBTc4 ESC cells, indicated as days after addition of tetracycline (Tc). β-Actin was used as a loading control. f The morphological changes of ESCs in response to BMP4 and schematic representation of the strategy to induce trophoblast trans-differentiation from ESCs by BMP4 treatment. Scale bar: 100 μm. g Expression levels of Cited1 and trophoblast markers during ESC trans-differentiation towards trophoblast lineages upon BMP4 induction were determined by qRT-PCR analysis. The average mRNA level in E14T ESCs without BMP4 treatment was set at 1.0. Data are shown as mean ± SD (n = 3). *p < 0.05, **p < 0.01, ***p < 0.001. h A representative western blot result of Cited1 protein levels during BMP4-induced ESC trans-differentiation to trophoblast lineages. α-Tubulin was used as a loading control. i Expression patterns of Cited1 in early embryos examined by immunofluorescence staining. Scale bar: 20 μm
Fig. 2
Fig. 2. Cited1 depletion compromises BMP4-induced trophoblast conversion from ESCs.
a Schematic representation of the strategy for Cited1 knockout (KO) by the CRISPR/Cas9 approach. The PAM sequences are in the rectangle. The cleavage site is pointed out by the scissor and arrow. Positions of the designed primers for genomic PCR are shown as arrows. The sequence of gRNA is shown in red color. b Four Cited1 KO E14T ESC cell lines with frame-shifted- or large fragment deleted-Cited1 were identified. This panel shows the genomic DNA PCR results. c Western blot analysis of protein levels of Cited1 in the parental wild-type (WT) ESCs and four Cited1 KO ESC lines after treatment with BMP4 for 6 days. d Morphology changes of parental wild-type (WT) ESCs and four Cited1 KO ESC lines before (top panel) and after (middle and bottom panels) treatment with BMP4 for 6 days. Scale bar: 200 μm (top and middle panels); 100 μm (bottom panel). e, f qRT-PCR analysis for expression levels of trophoblast (e) and pluripotency (f) markers in the four Cited1 KO ESC lines and their parental WT counterparts after treatment with BMP4 for 6 days. The comparison was made between Cited1 KO and WT ESCs at day 6 upon BMP4 treatment. The average mRNA level in untreated WT ESCs was set at 1.0. Data are shown as mean ± SD (n = 3). *p < 0.05, **p < 0.01, ***p< 0.001
Fig. 3
Fig. 3. Ectopic Cited1 activates trophoblast lineage genes.
a Typical morphological changes and AKP staining in E14T ESCs after overexpressing Cited1 for 2 days. Scale bar: 100 μm. b Results of qRT-PCR analysis of expression levels of trophoblast markers in ESCs overexpressing Cited1, Cdx2, or Gata3 for 3 days. The average mRNA level in cells transfected with the control vector pPy was set at 1.0. Data are shown as mean ± SD (n = 3). *p< 0.05, **p < 0.01, ***p < 0.001. c, d Results of qRT-PCR analysis of expression levels of three germ layer markers (c) and pluripotency-associated markers (d) in ESCs overexpressing Cited1 for 3 days. The average mRNA level in cells transfected with the control vector pPy was set at 1.0. Data are shown as mean ± SD (n = 3). *p< 0.05, **p < 0.01, ***p < 0.001. e qRT-PCR analysis of expression levels of trophoblast markers after transfection of plasmids as indicated in ESCs over a time course. The average mRNA level in cells transfected with the control vector pPy was set at 1.0. Data are shown as mean ± SD (n = 3). **p < 0.01, ***p < 0.001. f, g Immunofluorescence staining of ESCs after transfection of Cited1 for 6 days. Samples were stained with anti-Oct4 antibody (red) (e) and anti-Krt7 antibody (red) (f), respectively. DAPI staining highlights the nuclei (blue). Scale bar: 50 μm. h Flow cytometry density plots for Krt7 expression in ESCs after transfection of Cited1 for 6 days. Cells were fully dispersed, fixed, and immunostained for Krt7. For the negative control (NC), cells were exposed only to secondary antibody without prior exposure to the primary Krt7 antibody. i The statistical analysis of flow cytometry data for percentages of cells positive for Krt7 expression in ESCs overexpressing Cited1 or an empty vector for 6 days. Data are shown as mean ± SD (n = 3). ***p < 0.001
Fig. 4
Fig. 4. Teratomas derived from Cited1-overexpressing ESCs contain trophoblastic hemorrhages.
a The gross appearance of teratomas derived from control cells or Cited1-overexpressing (OE) ESCs. b The net weight of teratomas derived from control cells and Cited1-overexpressing ESCs. Data are shown as mean ± SD (n = 4). **p< 0.01. c Hematoxylin and eosin staining (H&E) for histological sections of teratomas derived from control cells (upper panel) or Cited1-overexpressing ESCs (lower panel), indicating the presence of tissues and cell types from three germ layers. Scale bar: 50 μm. d Cross-section of H&E staining for teratomas derived from control cells or Cited1-overexpressing ESCs. Teratomas from Cited1-overexpressing ESCs contained numerous hemorrhagic loci, which are indicated by black arrows. Scale bar: 500 μm. e H&E staining images for sections of a teratoma derived from Cited1-overexpressing ESCs. The trophoblast giant cells with the enlarged nuclei (arrows) and a multinucleate trophoblast cell (with an arrow) are indicated. Scale bar: 20 μm. f Anti-Placental lactogen 1 immunohistochemistry staining images for sections of a teratoma derived from Cited1-overexpressing cells. Scale bar: 20 μm
Fig. 5
Fig. 5. Cited1 overexpression initiates a global trophoblast transcriptional program.
a A heatmap of differentially expressed genes (DEGs) induced by Cited1 overexpression in ESCs (fold change > 2 and p < 0.05). Green and red values represent fold changes for down- and upregulation, respectively. b The numbers of up- and downregulated genes induced by Cited1 overexpression in ESCs (fold change > 2 and p < 0.05). c qRT-PCR analysis to validate the expression changes of DEGs identified by the microarray assay in ESCs 48 h after Cited1 overexpression. The average mRNA level in control cells transfected with an empty vector pPy was set at 1.0. Data are shown as mean ± SD (n = 3). *p < 0.05, **p < 0.01, ***p < 0.001. d Significantly enriched GO terms of the top 60 DEGs induced by Cited1 overexpression at day 2 compared with those from empty vector pPy overexpression. e A venn diagram showing intersections of 3 sets of DEGs induced by Cited1 overexpression (pink), Gata3 overexpression (blue), or Cdx2 overexpression (green), with gene numbers indicated. Out of 696 DEGs induced by Cited1, 462 DEGs were shared with those induced by Gata3 or Cdx2. f The GSEA using ordered gene expression levels from Cited1-overexpressing cells over control ESCs (X-axis) with gene sets indicated. Cdx2 OE (368 genes), and Gata3 OE (384 genes) in ESCs, top 1% of upregulated genes upon Oct4 KD (204 genes), TSC-specific (313 genes) and ESC-specific (218 genes) gene sets
Fig. 6
Fig. 6. Cited1 interacts with Bmpr2 to activate BMP signaling and induce trophoblast differentiation.
a Protein levels of pSmad1/5 and pSmad2 upon Cited1 overexpression in E14T ESCs at the times as indicated. Smad5, Smad2/3, and α-Tubulin were used as loading controls. b Protein levels of pSmad1/5 and pSmad2 upon Cited1 overexpression and inhibitor treatment for 3 days in E14T ESCs. Smad5, Smad2/3, and α-Tubulin were used as loading controls. c Bright field images of Cited1-overexpressing or control ESCs after treatment with DMSO or different inhibitors for 3 days. LDN193189 (0.1 μM), Noggin (400 ng/mL) and K02288 (10 μM) are all BMP signaling inhibitors. SB431542 (10 μM) is a TGF-β signaling inhibitor. d qRT-PCR analysis of transcript levels of trophoblast markers after transfection and treatment with inhibitors for 3 days. The average mRNA level in cells transfected with control vector pPy and treated with DMSO was set at 1.0. Data are shown as mean ± SD (n = 3). *p < 0.05, **p < 0.01, ***p < 0.001. e qRT-PCR analysis of mRNA levels for ligands of the BMP pathway induced by Cited1 overexpression in E14T ESCs for 3 days. The average mRNA level in cells transfected with control vector pPy was set at 1.0. Data are shown as mean ± SD (n = 3). *p < 0.05. f The representative western blot result from Co-IP (immunoprecipitation) assays showing that ectopically expressed Flag-Cited1 binds to endogenous Bmpr2 specifically in E14T ESCs. Whole-cell lysates (WCL) were immunoprecipitated with anti-Flag M2 beads and analyzed by western blotting with antibodies as indicated. Five percent of WCL was loaded as the input. g qRT-PCR analysis of mRNA levels of trophoblast specific markers in parental WT ESCs or Bmpr2 knockout (KO) cells upon Cited1 overexpression for 3 days. The average mRNA level in WT cells transfected with empty vector pPy was set at 1.0. Data are shown as mean ± SD (n = 3). ***p< 0.001
Fig. 7
Fig. 7. Cited1 binds to Smad4 and its induction of trophoblast trans-differentiation depends on p300.
a Protein levels of pSmad1/5 in WT ESCs and four Cited1 KO ESC clones after treatment with BMP4 for 1 day and 6 days. b Co-IP assay to show that exogenously expressed Flag-Cited1 binds to endogenous Smad4 specifically in E14T ESCs. Whole-cell lysates (WCL) were immunoprecipitated with anti-Flag M2 beads and analyzed by western blotting with anti-Smad4 and anti-Flag antibodies, respectively. Five percent of the WCL was loaded as the input. c qRT-PCR analysis of transcript levels of trophoblast specific markers in control E14T ESCs (shRNA_ NT) or p300 KD cells (p300 shRNA#5, 6, 8) upon Cited1 overexpression for 3 days. The average mRNA level in cells transfected with an empty vector (pPy) and a non-targeting shRNA plasmid (shRNA_NT) was set at 1.0. Data are shown as mean ± SD (n = 3). *p < 0.05, **p< 0.01. d A proposed working model for Cited1 to promote mouse ESC trans-differentiation toward a trophoblast-like state through activation of BMP signaling. On the one hand, Cited1 binds to Bmpr2 to enhance the phosphorylation of Smad1/5/8. On the other hand, Cited1 may functionally link Smad4 and p300 to activate trophoblast trans-differentiation associated transcriptional program

Similar articles

Cited by

References

    1. Johnson MH, Ziomek CA. The foundation of two distinct cell lineages within the mouse morula. Cell. 1981;24:71–80. doi: 10.1016/0092-8674(81)90502-X. - DOI - PubMed
    1. Morris SA, et al. Origin and formation of the first two distinct cell types of the inner cell mass in the mouse embryo. Proc. Natl Acad. Sci. USA. 2010;107:6364–6369. doi: 10.1073/pnas.0915063107. - DOI - PMC - PubMed
    1. Rossant J, Tam PP. Blastocyst lineage formation, early embryonic asymmetries and axis patterning in the mouse. Development. 2009;136:701–713. doi: 10.1242/dev.017178. - DOI - PubMed
    1. Evans MJ, Kaufman MH. Establishment in culture of pluripotential cells from mouse embryos. Nature. 1981;292:154–156. doi: 10.1038/292154a0. - DOI - PubMed
    1. Martin GR. Isolation of a pluripotent cell line from early mouse embryos cultured in medium conditioned by teratocarcinoma stem cells. Proc. Natl Acad. Sci. USA. 1981;78:7634–7638. doi: 10.1073/pnas.78.12.7634. - DOI - PMC - PubMed

Publication types

MeSH terms