. 2018 Sep 11;9(9):927.
doi: 10.1038/s41419-018-0905-2.

Chronic myeloid leukaemia cells require the bone morphogenic protein pathway for cell cycle progression and self-renewal

Affiliations

Chronic myeloid leukaemia cells require the bone morphogenic protein pathway for cell cycle progression and self-renewal

Parto Toofan et al. Cell Death Dis. .

Abstract

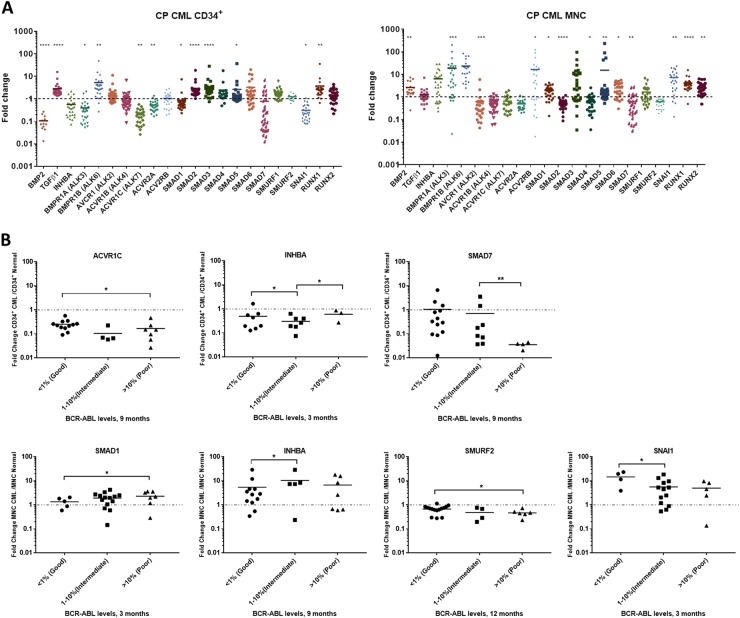
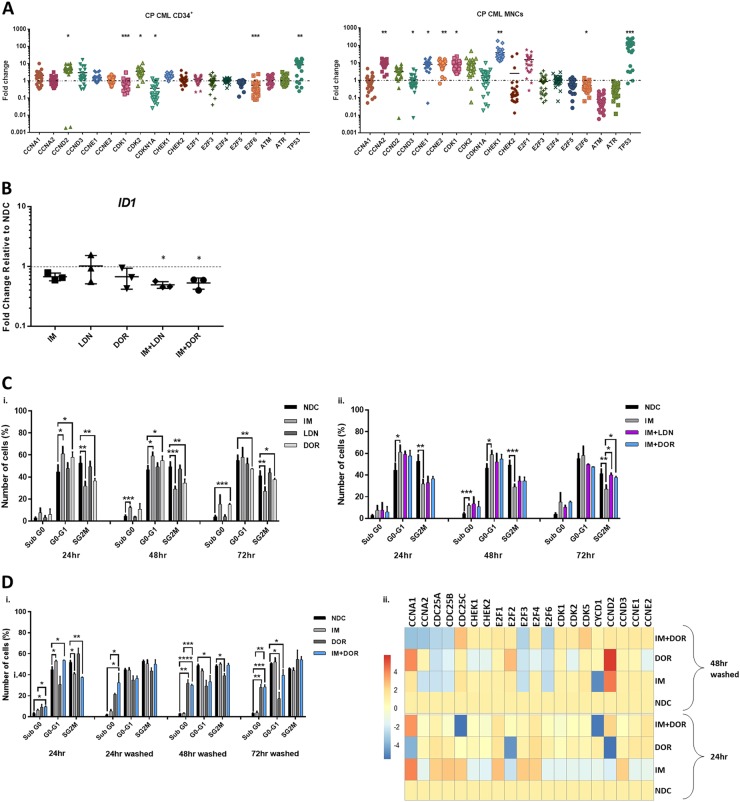
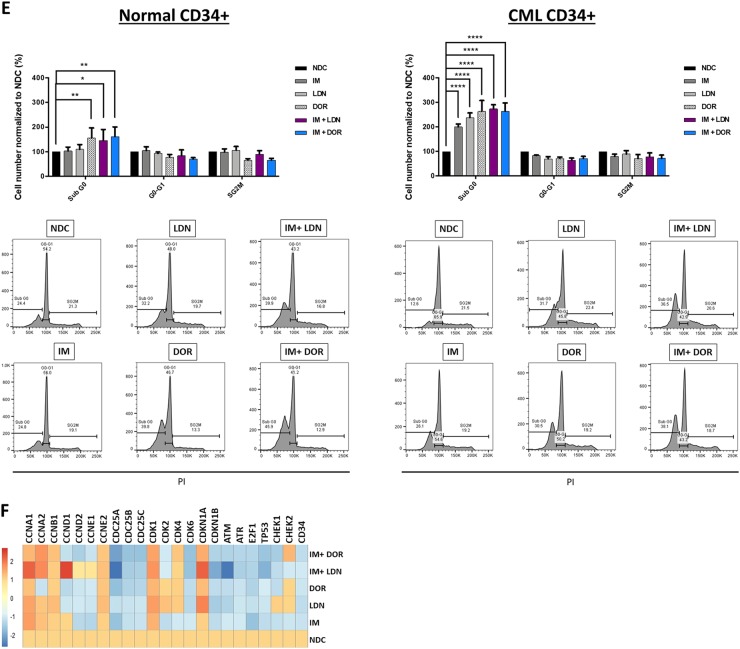
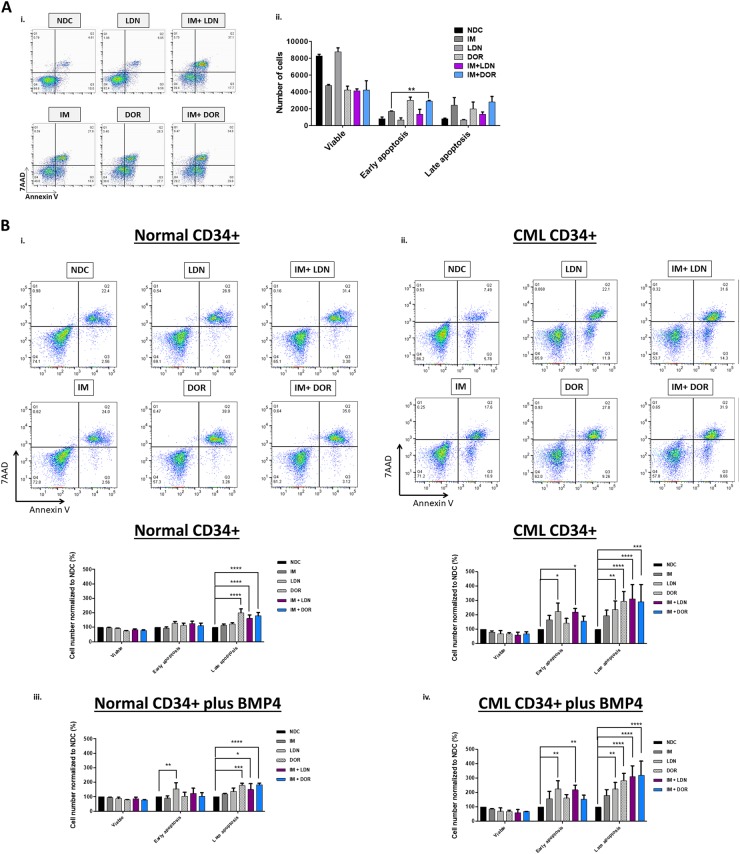
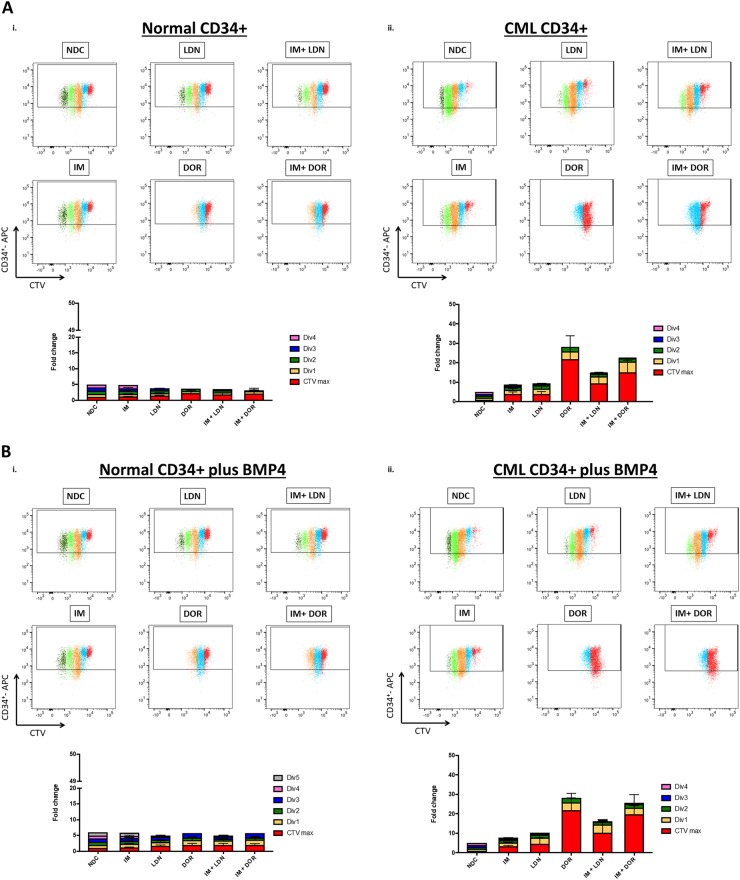
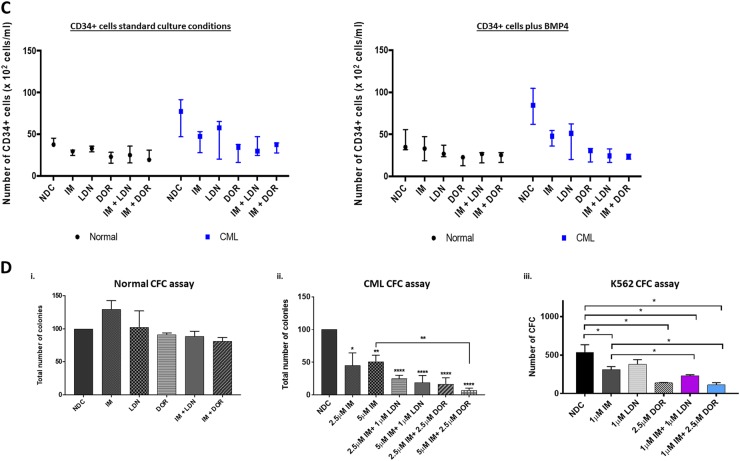
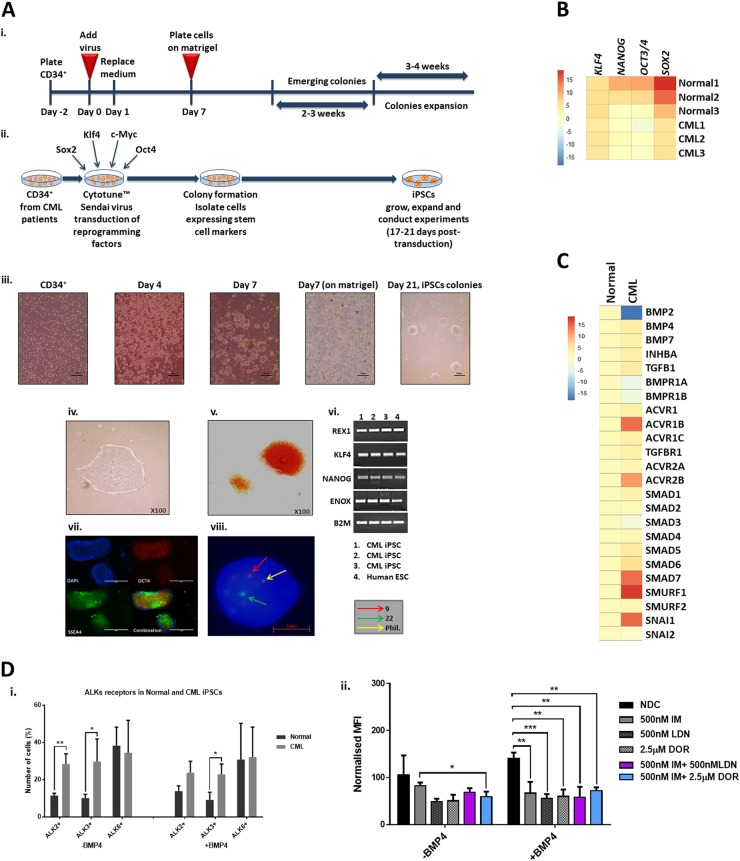
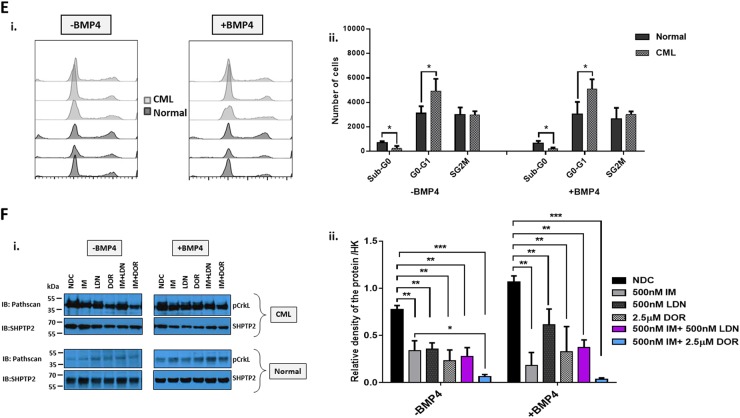
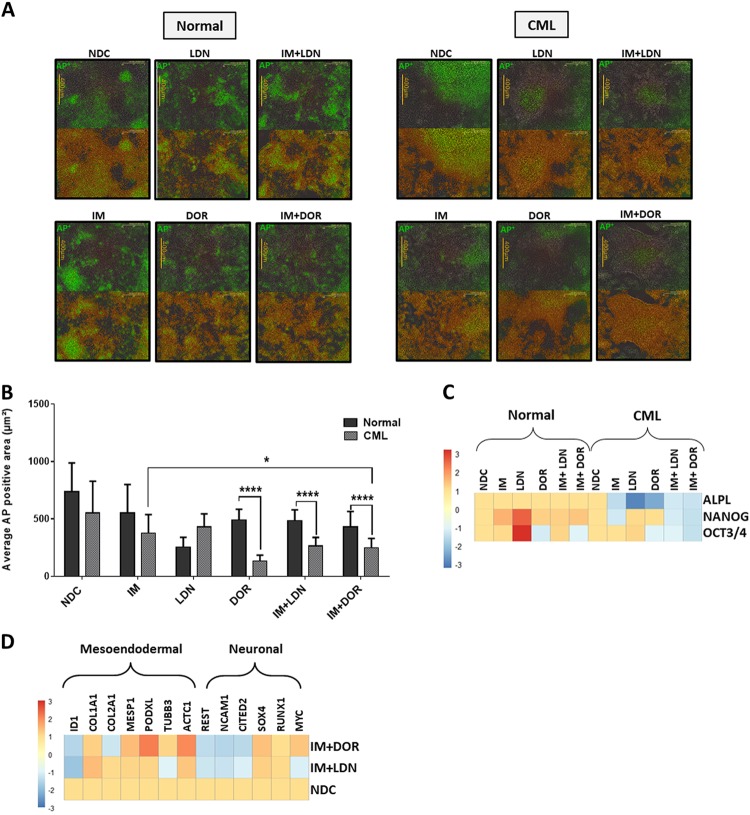
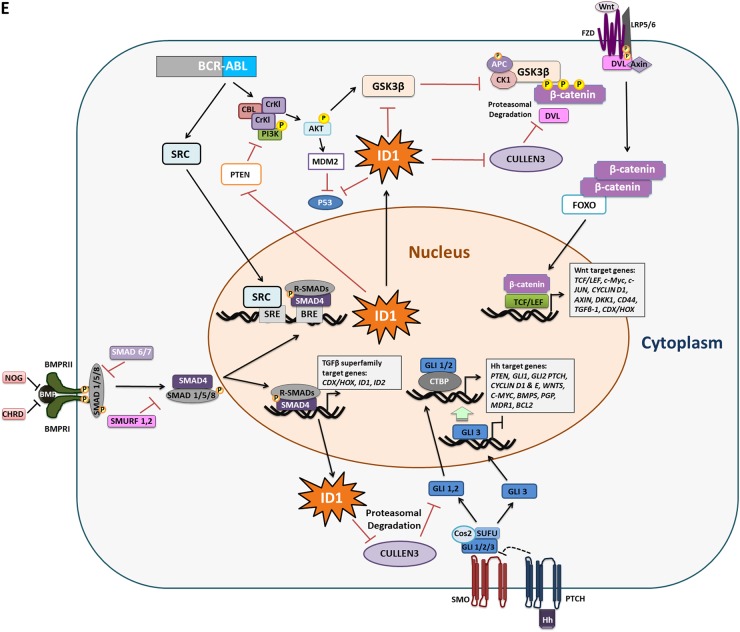
Leukaemic stem cell (LSC) persistence remains a major obstacle to curing chronic myeloid leukaemia (CML). The bone morphogenic protein (BMP) pathway is deregulated in CML, with altered expression and response to the BMP ligands shown to impact on LSC expansion and behaviour. In this study, we determined whether alterations in the BMP pathway gene signature had any predictive value for therapeutic response by profiling 60 CML samples at diagnosis from the UK SPIRIT2 trial and correlating the data to treatment response using the 18-month follow-up data. There was significant deregulation of several genes involved in the BMP pathway with ACV1C, INHBA, SMAD7, SNAIL1 and SMURF2 showing differential expression in relation to response. Therapeutic targeting of CML cells using BMP receptor inhibitors, in combination with tyrosine kinase inhibitor (TKI), indicate a synergistic mode of action. Furthermore, dual treatment resulted in altered cell cycle gene transcription and irreversible cell cycle arrest, along with increased apoptosis compared to single agents. Targeting CML CD34+ cells with BMP receptor inhibitors resulted in fewer cell divisions, reduced numbers of CD34+ cells and colony formation when compared to normal donor CD34+ cells, both in the presence and absence of BMP4. In an induced pluripotent stem cell (iPSC) model generated from CD34+ hematopoietic cells, we demonstrate altered cell cycle profiles and dynamics of ALK expression in CML-iPSCs in the presence and absence of BMP4 stimulation, when compared to normal iPSC. Moreover, dual targeting with TKI and BMP inhibitor prevented the self-renewal of CML-iPSC and increased meso-endodermal differentiation. These findings indicate that transformed stem cells may be more reliant on BMP signalling than normal stem cells. These changes offer a therapeutic window in CML, with intervention using BMP inhibitors in combination with TKI having the potential to target LSC self-renewal and improve long-term outcome for patients.


Conflict of interest statement

The authors declare that they have no conflict of interest.

Figures

Fig. 1
Fig. 1. BMP pathway gene expression is deregulated in CP-CML and is associated with TKI response.
a The BMP pathway and its downstream genes were analysed in 30 CP-CML CD34+ samples (stem/progenitor population) and 30 MNC CP-CML samples from the SPIRIT2 clinical trial using the Fluidigm Biomark system. Four normal CD34+ BM samples, two peripheral blood CD34+ normal donor samples and four normal MNC samples were used as comparators. Statistical analysis was performed using Welch’s test. b SPIRIT2 sample follow-up in CD34+ and MNC samples from ELN optimal, warning and failure patients. Analysis was performed by comparing the expression of each gene in poor, intermediate and good responders to the normal donors. Statistical analysis was performed using Student’s paired t-test. **p < 0.01–0.001, *p < 0.05–0.01
Fig. 2
Fig. 2. IM and BMP pathway inhibitors synergistically target the K562 CML cell line.
a Synergy studies of the BMP pathway inhibitors, LDN-193189 (LDN) and Dorsomorphin (DOR) with imatinib mesylate (IM) were performed using CalcuSyn to quantify additive, synergistic and inhibitory effects. Tables present the fraction of cells affected (Fa) and combination index (CI) values at different combination concentrations. The bottom table describes the correlation between CI range and synergism. As shown, both LDN and DOR, in combination with IM, synergistically induce cell death in K562 cells. b Protein analysis of K562 cells treated with IM, BMP inhibitors and the combination (IM = 500 nM, LDN = 500 nM, DOR = 2.5 μM, n = 3) compared to no-drug control (NDC) using western blot hybridisation following drug treatment in the presence and absence of BMP4 stimulation. i IM and LDN combination immunoblots at 4 h (left panel) and IM and DOR combination immunoblots at 4 h (right panel). K562 cells were stimulated with 20 ng/mL BMP4 for 30 min; this was followed by drug treatment. SHP2 was used as the housekeeping protein. ii Densitometry analysis of western blots was performed using image J software. Analysis was normalised relative to the housekeeping protein expression. Both BMP inhibitors synergistically inhibit pCrKl significantly in the absence of BMP4 stimulation. Data are expressed as mean ± standard deviation and were compared using the unpaired Student’s t-test, *p < 0.05; n = 4. c Protein analysis using immunofluorescence in K562 cells treated with IM, BMP inhibitors and the combination of both (n = 3) at 24 h ± BMP4 stimulation. Panels of four pictures for each treatment include a single staining for SMAD1/5/8 in green, SMAD4 in red, the combination of both as the merge and no antibody in DAPI blue. d CD34+ primary CP-CML samples (n = 4) were treated with IM, BMP inhibitors and the combination of both (IM = 1 µM, LDN = 1 µM, DOR = 2.5 μM). Expression of BMP pathway genes was assessed at 72 h using the Fluidigm Biomark system; data were normalised to untreated cells
Fig. 3
Fig. 3. The effect of IM and BMP inhibitors on cell cycle progression and cell cycle gene expression pattern.
a Cell cycle pathway gene expression of 60 patients enrolled in the SPIRIT2 clinical trial. Genes were analysed in 30 CP-CML CD34+ samples and 30 MNC CP-CML samples using the Fluidigm Biomark system. Four normal CD34+ BM samples, two peripheral blood CD34+ normal donor samples and four normal MNC samples were used as comparators. Statistical analysis was performed using Welch’s test. b The expression level of ID was assessed in CD34+ cells treated with IM, BMP inhibitors and the combination. Dual inhibition with both BMP inhibitors and IM decreased the expression of ID in all patient samples tested, compared to single-agent treatments. Statistical analysis was performed using Student’s paired t-test. *p < 0.05–0.01. c Propodium iodide (PI) analysis of cell cycle progression in K562 cells treated with IM, BMP inhibitors and the combination of both (IM = 500 nM, LDN = 500 nM, DOR = 2.5 μM, n = 4) after 72 h. i Treatment with individual inhibitors arrested cells in G1, with DOR causing more cell cycle arrest than LDN or IM. ii There is a further increase in the number of cells present in G1 phase when DOR was used in combination with IM (n = 4). d-i PI analysis of K562 cell cycle treated with IM, BMP inhibitors and the combination (IM = 500 nM, LDN = 500 nM, DOR = 2.5 μM, n = 3) when cells are washed to remove drugs 24 h post treatment. IM arrests K562 cells in G0-G1 at 24 h; however, cells go back into cycle after drug withdrawal. A different pattern was observed with DOR in combination with IM, where cells remained out of cycle after drug removal with a significant increase in the number of cells present in sub-G1. ii Expression analysis of cell cycle genes 48 h after drug wash-out, n = 3. e Cell cycle analysis of normal and CP-CML CD34+ samples treated with IM, BMP inhibitors and the combination of both (IM = 1 µM, LDN = 1 µM, DOR = 2.5 μM) at 72 h. Data show a significant increase in the number of cells in Sub-G0 in all single and dual treatments of normal and to a higher extent for CML samples (n = 3) (f) Analysis of cell cycle genes in CD34+ CP-CML cells in response to treatments (IM = 1 µM, LDN = 1 µM, DOR = 2.5 μM, n = 4). Cell cycle PI data are expressed as mean ± standard deviation and were compared using the unpaired Student’s t-test (c, d) or ANOVA (e). ****p < 0.0001, ***p < 0.001–0.0001, **p < 0.01–0.001, *p < 0.05–0.01
Fig. 4
Fig. 4. IM and BMP inhibitors induce apoptosis in CML cells.
a Annexin V/ 7AAD apoptosis analysis of K562 cells treated with IM, BMP inhibitors and the combination (IM = 500 nM, LDN = 500 nM, DOR = 2.5 μM, n = 3) at 72 h. i Inhibition of BCR-ABL and BMP pathway results in apoptosis, and a reduction in viable cells. ii Results are significantly more profound when IM is used in combination with DOR with more cells in early apoptosis (n = 3). b Annexin V/7AAD apoptosis analysis of normal and CP-CML CD34+ cells treated with IM, BMP inhibitors and the combination (IM = 1 µM, LDN = 1 µM, DOR = 2.5 μM, n = 3) at 72 h. i, ii Results indicate that IM in combination with BMP pathway inhibitors promote modest, but significant, apoptosis in normal CD34 + cells. However, apoptosis is greatly increased in CP-CML CD34+ samples. This is reflected in the increased number of cells present in late apoptosis (n = 3). iii, iv Inhibitor treatments with addition of BMP4 also indicate a significant increase of normal and CP-CML CD34+ cells in late apoptosis, with more apoptosis observed in the CML CD34+ samples (n = 3)
Fig. 5
Fig. 5. Single treatment of DOR and dual treatments of BMP inhibitors and IM inhibit cell proliferation of CML CD34+ cells.
a, b CellTrace™ Violet (CTV) proliferation analysis of normal and CP-CML CD34+ cells treated with IM, BMP inhibitors, the combination (IM = 1μM, LDN = 1 μM, DOR = 2.5 μM, n = 3), in absence or presence of BMP4 at 72 h. i Results for normal CD34+ cells display that single and dual treatment of IM + DOR inhibit cell proliferation, and additional BMP4 treatment (b) results in more cell divisions compared to standard culture conditions without BMP4. a-ii Proliferation analysis of CP-CML samples indicates that LDN in combination with IM synergistically inhibits proliferation compared to single treatment. DOR alone and in combination with IM displays the biggest fold change compared to NDC. Additional treatment with BMP4 (b-ii) did not reveal differences in proliferation progression compared to standard culture conditions. c IM and BMP inhibitors reduce CD34+ cell numbers in CP-CML samples in absence or presence of BMP4. Results are displayed as median range of CD34+ cell numbers of normal and CP-CML CD34+ cells treated with IM, BMP inhibitors and the combination (IM = 1 µM, LDN = 1 µM, DOR = 2.5 μM, n = 3) in absence or presence of BMP4. d-i CFC assay results of normal CD34+ cells treated with IM, BMP inhibitors and the combination of (IM = 1 µM, LDN = 1 µM, DOR = 2.5 μM) do not reveal any significant difference compared to NDC (n = 3). ii Total number of colonies of CP-CML CD34+ cells display a significant difference across all treatments compared to NDC and a synergistic reduction when IM and DOR were used in combination (n = 3). iii CFC results of K562 cells. Results also indicate a significant drop in the number of colonies with IM, DOR and LDN. Results are also reflected in the morphology of the colonies with DOR and LDN treatment reducing the size of colonies (n = 3). Data are expressed as mean ± standard deviation and were compared using ANOVA (c) and the unpaired Student’s t-test (a, b, d), ***p < 0.001–0.0001, **p < 0.01–0.001, *p < 0.05–0.01
Fig. 6
Fig. 6. Deregulation of the BMP pathway in CML-iPSC.
a Schematic representation of generating iPSCs from treatment naive CP-CML and normal samples using Sendai virus transduction of the reprogramming genes. i Experiment timeline for reprogramming CD34+ cells. ii A schematic representation of Sendai virus reprogramming of CD34+ cells from CP-CML patients. iii The morphology of cells during reprogramming period from single cells in suspension to iPSC colonies attached to matrigel coated plates. iv An iPSC colony with defined edges and a compact core. iPSCs were regularly passaged and colonies with highest pluripotency quality were plucked to help maintain this morphology. v Alkaline phosphatase (APh) staining. vi The expression level of REX1, KLF4 and NANOG were assessed by PCR in all iPSCs. vii Immunofluorescence staining with TRA1-60, SOX2, OCT4 and SSEA4 was used to confirm pluripotency at protein level in iPSCs. viii Fluorescent in situ hybridisation (FISH) confirming the presence of BCR-ABL translocation in CML-iPSC colonies. b qRT-PCR confirming the expression of important pluripoptency genes in the three normal and three CML-iPSC samples. c The expression level of BMP pathway components analysed using qRT-PCR in CML-iPSCs. Data were normalised relative to normal-iPCSs. d-i Analysis of BMPRIs (ALK2, 3 and 6) in normal and CML-iPSCs using flow cytometry. To stimulate BMP pathway, cells were treated with 20 ng/mL BMP4 for 24 h prior to experiment. CML-iPSCs express significantly higher levels of ALKs 2 and 3 in the presence and absence of BMP4 stimulation compared to normal samples. ii FACS analysis of ALK2 expression in CML and normal iPSCs following drug treatment. Results are expressed relative to NDC. e Cell cycle analysis of normal and CML-iPSCs in the presence and absence of BMP4 stimulation. f-i Protein analysis of pCrKL in normal and CML-iPSCs treated with IM, BMP inhibitors and the combination of both using immunoblotting ± BMP4 stimulation at 4 h. SHPTP2 was used as a control. ii Statistical analysis of immunoblots shows that dual inhibition using IM and DOR has a synergistic effect on reducing pCrKl levels in CML-iPSCs. Data are expressed as mean ± standard deviation and were compared using Anova and the unpaired Student t-test, ***p < 0.001–0.0001, **p < 0.01–0.001, *p < 0.05–0.01, n = 3
Fig. 7
Fig. 7. Effect of inhibiting the BMP pathway on CML-iPSC self-renewal.
a Monitoring the pluripotency level of normal (left panel) and CML (right panel) iPSCs treated with IM, BMP inhibitors or the combination of both (IM = 1 µM, LDN = 1 µM, DOR = 2.5 µM) at 72 h using live APh staining. Pictures were taken by IncuCyte live imaging system. Green fluorescent tag illustrates APh positive cells. Orange fluorescent tag stains all of the colonies. b Comparison of surface area expressing APh in CML-iPSCs vs normal. Untreated sample was used as a comparator. Data are expressed as mean ± standard deviation and were compared using Anova and the unpaired Student’s t-test, ***p < 0.001–0.0001, **p < 0.01–0.001, *p < 0.05–0.01, n = 28 pictures for each arm. c Gene expression analysis shows a marked reduction in the expression of ALPL, NANOG and OCT3/4 in CML samples only. d The expression of early differentiation genes assessed in CML-iPSCs when IM is used in combination with either BMP inhibitor. Data normalised with untreated samples. e Schematic diagram demonstrating the potential role of ID1 in CML pathophysiology. Embryonic morphogenic pathways and their downstream targets play key roles in the pathophysiology of CML, the early response gene ID1 could be an important orchestrator in this process. ID1 upregulation occurs through BCR-ABL-dependent and independent mechanisms. ID1 expression is enhanced through BCR-ABL-mediated STAT5 and SRC activation, with the ID1 promoter having a SRC-responsive element upstream of the translational start site. BMP/SMAD signalling regulates ID1 through BRE in its promoter. Therefore, SRC can co-operate with SMAD to induce ID1 expression. Once expressed, ID1 is known to mediate its effects by downregulating p53 and PTEN transcription, resulting in enhanced AKT phosphorylation and AKT-mediated canonical Wnt signalling. ID1 can also enhance G1-S cell cycle progression and augment Hh and Wnt signalling through suppression of CULLIN3, an ubiquitin ligase which targets CyclinE, GLI2 and DVL2 for degradation. BMP and Wnt pathways also converge to regulate the CDX family of homeobox transcription factors, master regulators of HOX gene expression, important transcription factors involved in CML

Similar articles

Cited by

References

    1. Holyoake T, Jiang X, Eaves C, Eaves A. Isolation of a highly quiescent subpopulation of primitive leukemic cells in chronic myeloid leukemia. Blood. 1999;94:2056–2064. - PubMed
    1. Graham SM, et al. Primitive, quiescent, Philadelphia-positive stem cells from patients with chronic myeloid leukemia are insensitive to STI571 in vitro. Blood. 2002;99:319–325. doi: 10.1182/blood.V99.1.319. - DOI - PubMed
    1. Copland M, et al. Dasatinib (BMS-354825) targets an earlier progenitor population than imatinib in primary CML but does not eliminate the quiescent fraction. Blood. 2006;107:4532–4539. doi: 10.1182/blood-2005-07-2947. - DOI - PubMed
    1. Jorgensen HG, Allan EK, Jordanides NE, Mountford JC, Holyoake TL. Nilotinib exerts equipotent antiproliferative effects to imatinib and does not induce apoptosis in CD34+CML cells. Blood. 2007;109:4016–4019. doi: 10.1182/blood-2006-11-057521. - DOI - PubMed
    1. Jamieson, C. H. Chronic myeloid leukemia stem cells. Hematol. Am. Soc. Hematol. Educ. Program2008, 436–442 (2008). - PubMed

Publication types

MeSH terms

Substances