. 2018 Sep 11;8(1):13637.
doi: 10.1038/s41598-018-31765-z.

Neurotransmitter identity and electrophysiological phenotype are genetically coupled in midbrain dopaminergic neurons

Affiliations

Neurotransmitter identity and electrophysiological phenotype are genetically coupled in midbrain dopaminergic neurons

Mónica Tapia et al. Sci Rep. .

Abstract

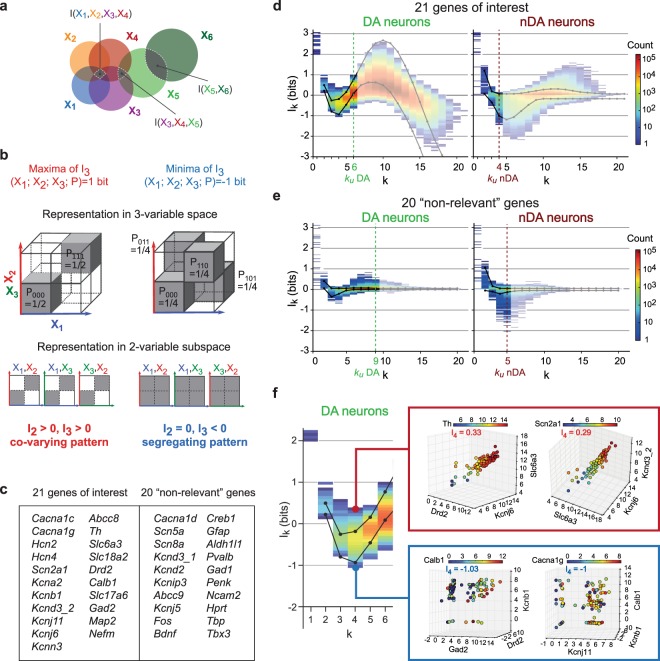
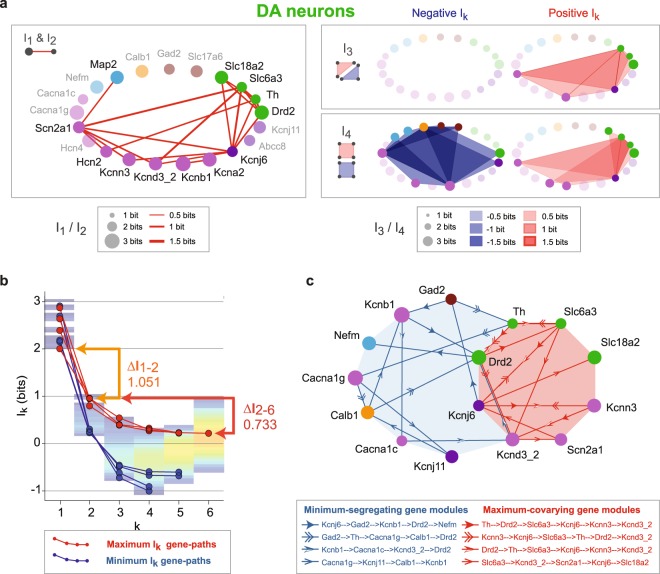
Most neuronal types have a well-identified electrical phenotype. It is now admitted that a same phenotype can be produced using multiple biophysical solutions defined by ion channel expression levels. This argues that systems-level approaches are necessary to understand electrical phenotype genesis and stability. Midbrain dopaminergic (DA) neurons, although quite heterogeneous, exhibit a characteristic electrical phenotype. However, the quantitative genetic principles underlying this conserved phenotype remain unknown. Here we investigated the quantitative relationships between ion channels' gene expression levels in midbrain DA neurons using single-cell microfluidic qPCR. Using multivariate mutual information analysis to decipher high-dimensional statistical dependences, we unravel co-varying gene modules that link neurotransmitter identity and electrical phenotype. We also identify new segregating gene modules underlying the diversity of this neuronal population. We propose that the newly identified genetic coupling between neurotransmitter identity and ion channels may play a homeostatic role in maintaining the electrophysiological phenotype of midbrain DA neurons.


Conflict of interest statement

The authors declare no competing interests.

Figures

Figure 1
Figure 1
Cell-to-cell variation in gene expression levels in midbrain DA and nDA neurons. (a) Levels of expression (Log2Ex) of 41 genes in the collected 111 DA and 37 nDA neurons represented as a heatmap (left) or as a scatter plot (right). The thick green and red lines in the scatter plot represent the average expression levels while each dot corresponds to the expression level in one neuron. Neurons in the heatmap are ordered based on Th and Slc6a3 levels of expression in DA neurons (thick green line) and genes are ordered based on their average level of expression in DA neurons (left plot). (b) Levels of expression (Log2Ex) of the ion channels Kcnd3/Kv4.3, Kcnn3/SK3 and Kcnj6/GIRK2 in DA (green) and nDA neurons (red) represented as a one-dimensional plot (left) or 3-dimensional plot (right). Shaded ellipses outline the global distribution of the data points in the 3-dimensional space.
Figure 2
Figure 2
Second order linear analysis reveals specific patterns of correlations in gene expression levels in midbrain DA and nDA neurons. (a) Heatmap representing the significant correlations in expression levels for 33 genes in DA neurons (upper right triangle) and nDA neurons (lower left triangle) (Pearson correlation coefficient). Correlations were processed on non-zero values of expression, and only correlations with a p value < 0.05 and n > 5 are represented. Please note the difference in patterns of correlations between DA and nDA neurons.(b) Scatter plots presenting examples of significant correlations in gene expression levels. Green and dark red dots correspond to DA and nDA neurons, respectively. r, p, and n values are displayed for each correlation test. Plain and dotted lines indicate significant and non-significant Pearson correlations, respectively. Protein names are given in parentheses. (c) Scaffold representations of the 20 most significant correlations in expression levels in DA (left) and nDA (right) neurons (r values > 0.6 or < −0.6, see color coding in the top middle box). Genes were ordered based on the known function of the corresponding proteins (see table at the bottom for the color-coding of functions). Genes involved in the depicted correlations are highlighted (dark font). Please note the strong connectivity between DA metabolism/signaling and ion channel genes in DA neurons.
Figure 3
Figure 3
High order analysis identifies gene modules with co-varying and segregating patterns in DA neurons. (a) Venn diagram illustrating a system of 6 random variables sharing mutual information at degree 2, 3 and 4. (b) Theoretical examples of positive (left) and negative (right) I3 for 3 binary random variables X1, X2, X3 represented as 3- and 2-variable spaces. Note that the segregating pattern of negativity is only visible in 3-dimensional space (complete explanation in Supplementary Fig. 5). (c) List of the 21 genes of interest (left) used for mutual information analysis and the remaining 20 genes considered as “non-relevant” (right). Note that the term “non-relevant” is used only in the context of mutual information analysis to distinguish between more or less informative genes. (d) Information landscape for the 21 genes of interest for DA (left) and nDA neurons (right). The undersampling limit or ku for DA and nDA neurons is represented on every landscape as a vertical dotted line and increased transparency of the graph. The upper and lower statistical limits, the top or bottom 5% fixed by the averaged shuffled landscape, are represented on the graphs as black lines. (e) Information landscapes for the 20 other “non-relevant” genes. (f) Magnification of the landscape presented in (d) for DA neurons until dimension k = 6. The 4D-scatter plots in the colored insets on the right represent the levels of expression of 2 quadruplets of genes sharing strong positive I4 (upper plots) and strong negative I4 (bottom plots) in DA neurons.
Figure 4
Figure 4
Size and stability of co-varying and segregating gene modules in DA neurons. (a) Scaffold representations of the most significant Ik values shared by pairs (I2, 20 examples), triplets (I3, 5 ex.) and quadruplets (I4, 5 ex.) of genes in DA neurons. Circle diameters are scaled according to entropy value (I1). The red shapes indicate positive Ik shared by genes while the blue shapes correspond to negative Ik. Negative I3 triplets are not represented due to their lack of statistical significance. (b) Line and scatter plot illustrating the 4 maximum (red) and minimum (blue) Ik gene paths corresponding to stable information modules identified using conditional Ik computation. The total information landscape (transparent color coding) is shown in the background. The bars and arrows on the right indicate the information gain attributable to pairwise (orange) and higher-order interactions (red) for the first maximum gene-path. (c) Gene-scaffold representation of the identified maximum-covarying (red) and minimum-segregating (blue) Ik gene paths. Each path, representing a gene module, is distinguished by a specific arrowhead shape (see legend box).
Figure 5
Figure 5
New insights into midbrain DA neuron definition. (a) Schematic representing the superimposition of profiles of expression of positive Ik-sharing genes (red, co-varying) and negative Ik-sharing genes (blue, heterogeneous) in midbrain DA neurons revealed by Ik analysis. While the levels of expression of positive Ik-sharing genes vary in a homogeneous manner, the levels of expression of negative Ik-sharing genes are extremely heterogeneous (see justification in Supplementary Fig. 8), producing a mosaic-like pattern. (b) Top, schematic representation of the documented transcriptional co-regulation of DA metabolism genes (green) by the transcription factors Nurr1 and Pitx3, together with the potential co-regulation of the genes involved in electrical phenotype (purple) identified in the present study. The functional implication of the corresponding proteins in DA signaling pathway (green shading) and DA neuron electrical properties (purple shading) are represented in the schematic below. The potential coupling of these two groups of genes may reflect a basic regulatory functional module common to all midbrain DA neurons.

References

    1. Johnston, D. & Wu, S. M.-S. Foundations Of Cellular Neurophysiology. (MIT Press, 1995).
    1. Hille, B. Ion Channels Of Excitable Membranes. (Sinauer, 2001).
    1. Goaillard JM, Taylor AL, Schulz DJ, Marder E. Functional consequences of animal-to-animal variation in circuit parameters. Nat Neurosci. 2009;12:1424–1430. doi: 10.1038/nn.2404. - DOI - PMC - PubMed
    1. Drion G, Massotte L, Sepulchre R, Seutin V. How modeling can reconcile apparently discrepant experimental results: the case of pacemaking in dopaminergic neurons. PLoS Comput Biol. 2011;7:e1002050. doi: 10.1371/journal.pcbi.1002050. - DOI - PMC - PubMed
    1. Amendola J, Woodhouse A, Martin-Eauclaire MF, Goaillard JM. Ca(2)(+)/cAMP-sensitive covariation of I(A) and I(H) voltage dependences tunes rebound firing in dopaminergic neurons. J Neurosci. 2012;32:2166–2181. doi: 10.1523/JNEUROSCI.5297-11.2012. - DOI - PMC - PubMed

Publication types

LinkOut - more resources