

ADAP1 limits neonatal cardiomyocyte hypertrophy by reducing integrin cell surface expression
- PMID: 30206251
- PMCID: PMC6134004
- DOI: 10.1038/s41598-018-31784-w
ADAP1 limits neonatal cardiomyocyte hypertrophy by reducing integrin cell surface expression
Abstract
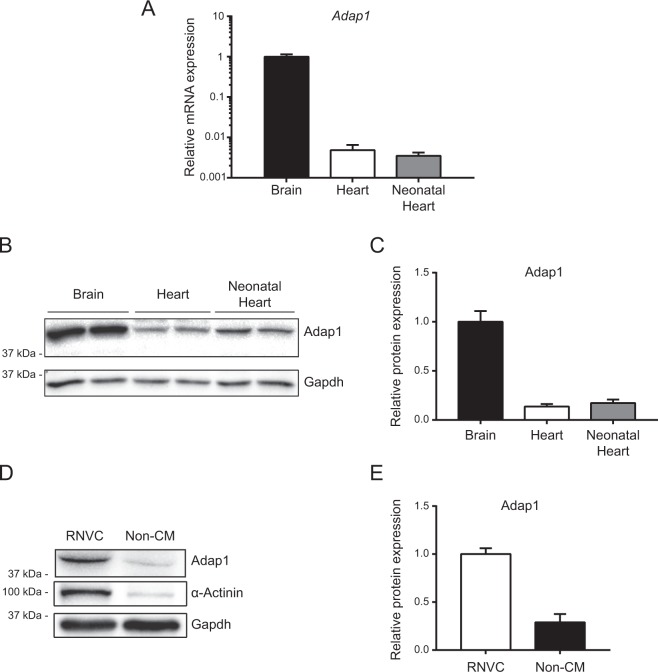
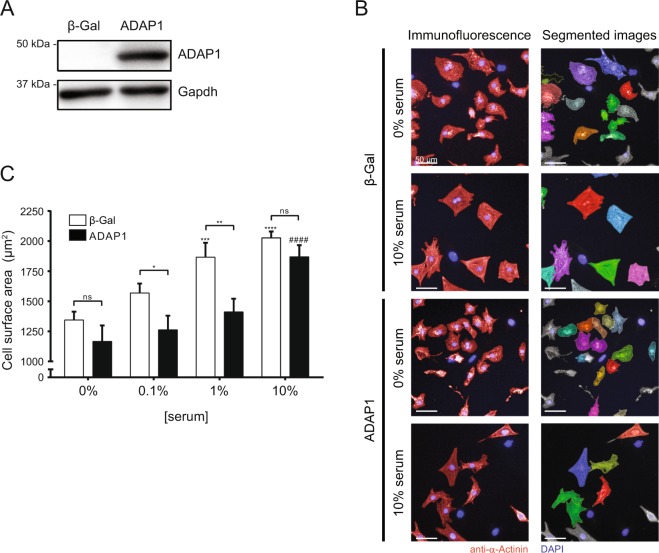
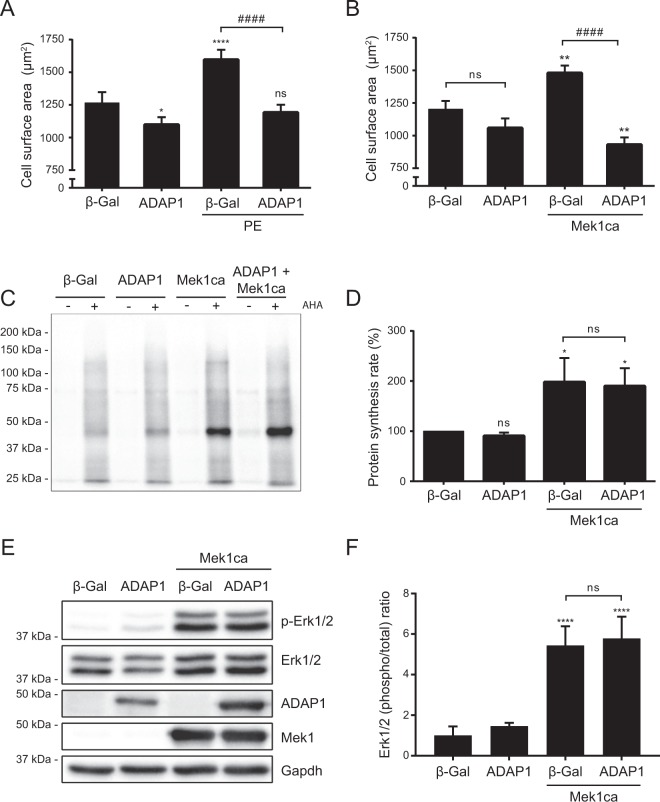
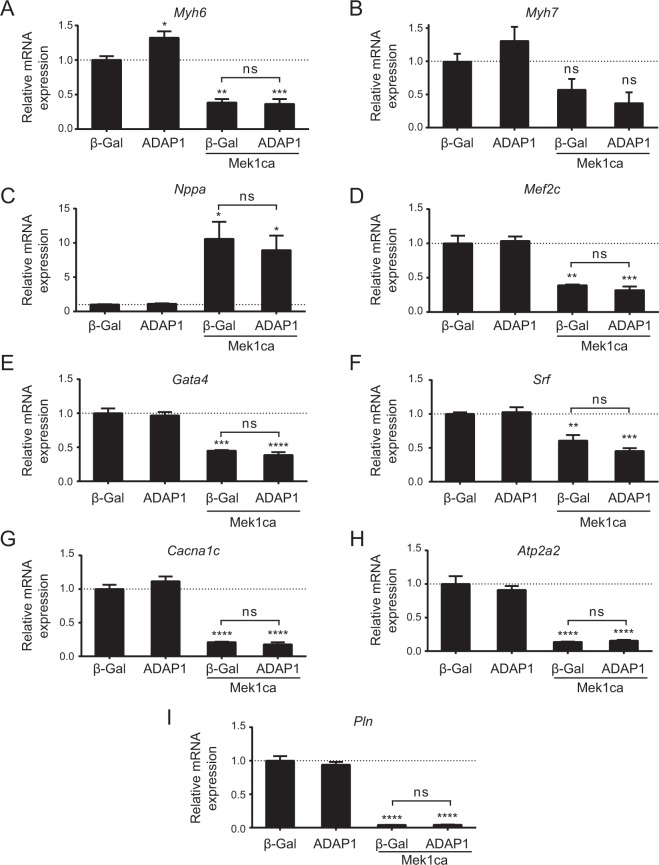
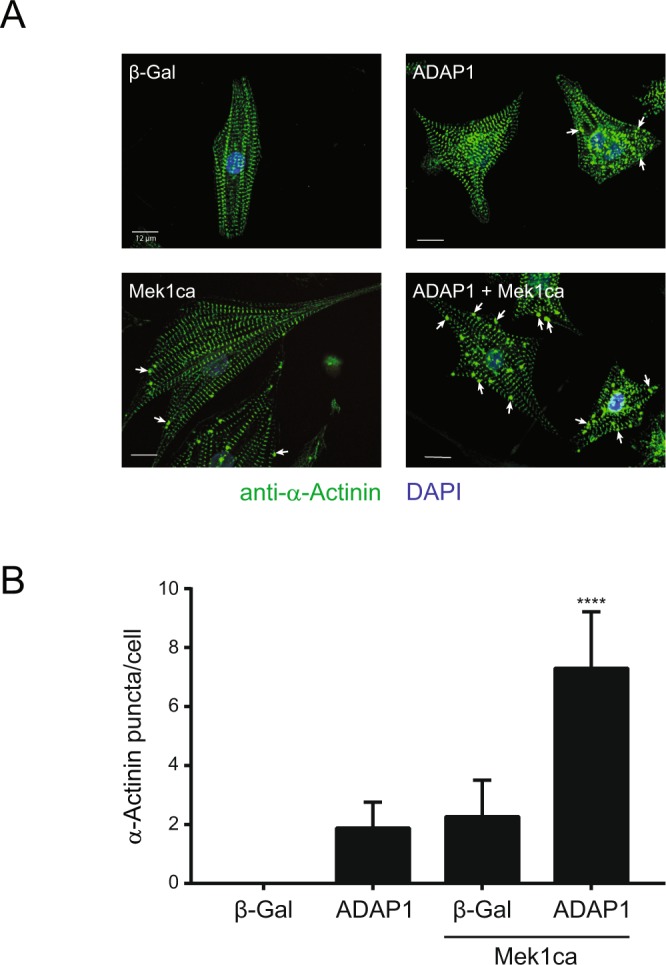
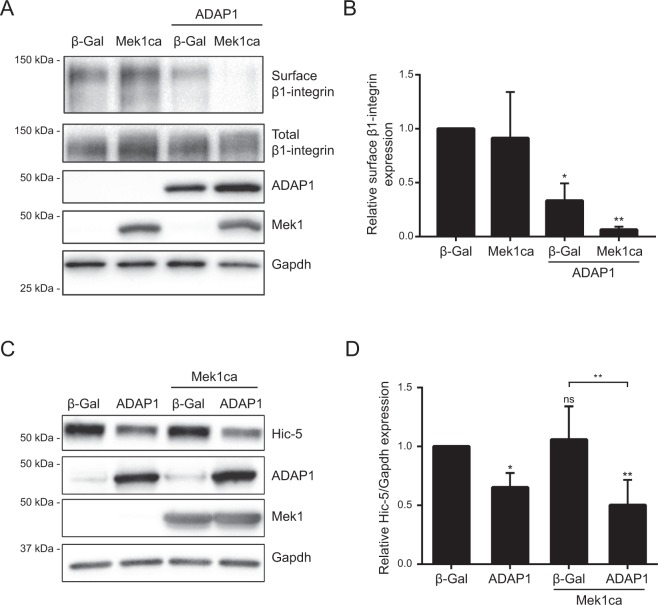
The ArfGAP with dual PH domains 1 (ADAP1) regulates the activation of the hypertrophic mitogen-activated protein kinase ERK1/2 pathway in non-cardiomyocytes. However, its role in cardiomyocytes is unknown. Our aim was to characterize the role of ADAP1 in the hypertrophic process of cardiomyocytes. We assessed the expression of ADAP1 in the hearts of adult and neonatal rats by RT-qPCR and Western blotting and showed that it is preferentially expressed in cardiomyocytes. Adenoviral-mediated ADAP1 overexpression in cultured rat neonatal ventricular cardiomyocytes limited their serum-induced hypertrophic response as measured by immunofluorescence microscopy. Furthermore, ADAP1 overexpression completely blocked phenylephrine- and Mek1 constitutively active (Mek1ca) mutant-induced hypertrophy in these cells. The anti-hypertrophic effect of ADAP1 was not caused by a reduction in protein synthesis, interference with the Erk1/2 pathway, or disruption of the fetal gene program activation, as assessed by nascent protein labeling, Western blotting, and RT-qPCR, respectively. An analysis of cultured cardiomyocytes by confocal microscopy revealed that ADAP1 partially re-organizes α-actinin into dense puncta, a phenomenon that is synergized by Mek1ca overexpression. Biotin labeling of cell surface proteins from cardiomyocytes overexpressing ADAP1 revealed that it reduces the surface expression of β1-integrin, an effect that is strongly potentiated by Mek1ca overexpression. Our findings provide insights into the anti-hypertrophic function of ADAP1 in cardiomyocytes.
Conflict of interest statement
The authors declare no competing interests.
Figures
Similar articles
-
ArfGAP with Dual Pleckstrin Homology Domains 2 Promotes Hypertrophy of Cultured Neonatal Cardiomyocytes.Int J Mol Sci. 2025 Aug 6;26(15):7588. doi: 10.3390/ijms26157588. Int J Mol Sci. 2025. PMID: 40806715 Free PMC article.
-
Regulation of the cell surface expression and function of angiotensin II type 1 receptor by Rab1-mediated endoplasmic reticulum-to-Golgi transport in cardiac myocytes.J Biol Chem. 2004 Sep 24;279(39):41077-84. doi: 10.1074/jbc.M405988200. Epub 2004 Jul 12. J Biol Chem. 2004. PMID: 15252015
-
Hypertrophic responses to cardiotrophin-1 are not mediated by STAT3, but via a MEK5-ERK5 pathway in cultured cardiomyocytes.J Mol Cell Cardiol. 2005 Jan;38(1):185-92. doi: 10.1016/j.yjmcc.2004.10.016. Epub 2004 Dec 10. J Mol Cell Cardiol. 2005. PMID: 15623435
-
PKC alpha regulates the hypertrophic growth of cardiomyocytes through extracellular signal-regulated kinase1/2 (ERK1/2).J Cell Biol. 2002 Mar 4;156(5):905-19. doi: 10.1083/jcb.200108062. Epub 2002 Feb 25. J Cell Biol. 2002. PMID: 11864993 Free PMC article.
-
Functions of the neuron-specific protein ADAP1 (centaurin-α1) in neuronal differentiation and neurodegenerative diseases, with an overview of structural and biochemical properties of ADAP1.Biol Chem. 2014 Nov 1;395(11):1321-40. doi: 10.1515/hsz-2014-0107. Biol Chem. 2014. PMID: 24854535 Review.
Cited by
-
Optimization of H9c2 differentiation leads to calcium-active and striated cardiac cells without addition of retinoic acid.Front Cell Dev Biol. 2024 Nov 22;12:1501540. doi: 10.3389/fcell.2024.1501540. eCollection 2024. Front Cell Dev Biol. 2024. PMID: 39650723 Free PMC article.
-
ArfGAP with Dual Pleckstrin Homology Domains 2 Promotes Hypertrophy of Cultured Neonatal Cardiomyocytes.Int J Mol Sci. 2025 Aug 6;26(15):7588. doi: 10.3390/ijms26157588. Int J Mol Sci. 2025. PMID: 40806715 Free PMC article.
-
Reovirus μ2 Protein Impairs Translation to Reduce U5 snRNP Protein Levels.Int J Mol Sci. 2022 Dec 31;24(1):727. doi: 10.3390/ijms24010727. Int J Mol Sci. 2022. PMID: 36614170 Free PMC article.
-
Cognitive Skills and DNA Methylation Are Correlating in Healthy and Novice College Students Practicing Preksha Dhyāna Meditation.Brain Sci. 2023 Aug 17;13(8):1214. doi: 10.3390/brainsci13081214. Brain Sci. 2023. PMID: 37626570 Free PMC article.
-
Luteolin suppresses lipopolysaccharide‑induced cardiomyocyte hypertrophy and autophagy in vitro.Mol Med Rep. 2019 Mar;19(3):1551-1560. doi: 10.3892/mmr.2019.9803. Epub 2019 Jan 2. Mol Med Rep. 2019. PMID: 30628693 Free PMC article.
References
-
- Venkateswarlu K, Brandom KG, Lawrence JL. Centaurin-alpha1 is an in vivo phosphatidylinositol 3,4,5-trisphosphate-dependent GTPase-activating protein for ARF6 that is involved in actin cytoskeleton organization. The Journal of biological chemistry. 2004;279:6205–6208. doi: 10.1074/jbc.C300482200. - DOI - PubMed
Publication types
MeSH terms
Substances
Supplementary concepts
Grants and funding
LinkOut - more resources
Full Text Sources
Other Literature Sources
Molecular Biology Databases
Miscellaneous
